Research Collection
Journal Article
Benefits of Increasing Information Accuracy in Variable Rate Technologies
Author(s):
Späti, Karin; Huber, Robert; Finger, Robert Publication Date:
2021-07
Permanent Link:
https://doi.org/10.3929/ethz-b-000477267
Originally published in:
Ecological Economics 185, http://doi.org/10.1016/j.ecolecon.2021.107047
Rights / License:
Creative Commons Attribution-NonCommercial-NoDerivatives 4.0 International
This page was generated automatically upon download from the ETH Zurich Research Collection. For more
information please consult the Terms of use.
Ecological Economics 185 (2021) 107047
Available online 31 March 2021
0921-8009/© 2021 The Author(s). Published by Elsevier B.V. This is an open access article under the CC BY-NC-ND license
(http://creativecommons.org/licenses/by-nc-nd/4.0/).
Methodological and Ideological Options
Benefits of Increasing Information Accuracy in Variable Rate Technologies
Karin Sp ¨ ati * , Robert Huber, Robert Finger
Agricultural Economics and Policy Group, Eidgen¨ossiche Technische Hochschule Zürich, 8092 Zurich, Switzerland
A R T I C L E I N F O
Keywords:Precision farming Nitrogen
Variable rate fertilization Wheat
Sensing
A B S T R A C T
Improvements in the sustainability of agricultural production depend essentially on advances in the efficient use of nitrogen. Precision farming promises solutions in this respect. Variable rate technologies allow the right quantities of fertilizer to be applied at the right place. This helps to both maintain yields and avoid nitrogen losses. However, these technologies are still not widely adopted, especially in small-scale farming systems.
Recent developments in sensing technologies, like drones or satellites, open up new opportunities for variable rate technologies. In this paper, we develop a bio-economic modelling framework to assess the usefulness of different sensing approaches in variable rate fertilization to measure environmental heterogeneity at field level, ranging from satellite imagery to drones and handheld N-sensors. We assess the utility of these sensing tech- nologies and quantify the effects on yields, nitrogen input and associated net returns using wheat production in Switzerland as our case study. Our results show that net profits increase when a high-resolution technology is applied to fields which exhibit higher spatial heterogeneity of soil conditions and lower spatial autocorrelation of different soil types. However, even with a high degree of spatial heterogeneity within a field, both the overall utility of variable rate fertilization and the absolute differences in the net returns between the technologies remain low. Our results suggest that the additional cost of using a drone that provides the highest resolution should not exceed 4.5 CHF/ha compared to the use of a standard N-sensor or satellite imagery. Thus, the adoption of variable rate technologies depends essentially on the additional economic and environmental effects they generate. Therefore, it might be necessary to implement specific policy measures, such as taxes on nitrogen in combination with subsidies. Moreover, specific technology providers, such as contractors, may play a vital role in technology uptake since the economic benefits might only play out at larger spatial levels.
1. Introduction
Some of todays’ most important issues for agricultural policy in the developed world involve the impacts of high nitrogen use on the envi- ronment and the associated pollution of aquatic and terrestrial ecosys- tems (Robertson and Vitousek, 2009; Sutton et al., 2011; van Grinsven et al., 2015). The efficiency of nitrogen use must be improved if agri- culture is to overcome systematic challenges, such as environmental degradation, agriculture’s contribution to climate change, the provision and security of food supplies and the wellbeing of farmers (Gebbers and Adamchuk, 2010; Tilman et al., 2011; Zhang et al., 2015). Variable rate technologies (VRT) can help to avoid nitrogen losses by applying the right amount of fertilizer at the right time and place to meet the needs of the crops (Diacono et al., 2013). This helps reduce nitrogen applications without loss of yield (Argento et al., 2020; Basso et al., 2019; Stama- tiadis et al., 2018; Wang et al., 2019) and contributes to a more sus- tainable agricultural production system (Basso and Antle, 2020).
However, while the adoption rate of these technologies is still low in the small-scale farming systems characteristic for Europe (Barnes et al., 2019), current technological developments open up optimistic prospects for the future of precision farming (e.g., Walter et al., 2017). Thus, the economic and ecological benefits of VRT in small-scale farming systems must be understood more clearly as it can play a major role in reducing nitrogen impact on the environment.
In this paper, we aim to contribute to a better understanding of the economic benefits of variable rate fertilization. More specifically, we develop a bio-economic modelling framework to investigate benefits of more accurate spatial information which can be acquired by different sensing approaches, ranging from handheld devices, tractor mounted sensors, drones to satellite imagery. We conceptually examine the applicability of different types of VRT in small-scale farming systems and test the relevance of characteristics of the field, e.g., heterogeneity of soil conditions and spatial clustering of soil types, for the economic viability of VRT. This enables us to assess optimal nitrogen use and the
* Corresponding author.
E-mail address: kspaeti@ethz.ch (K. Sp¨
ati).
Contents lists available at ScienceDirect
Ecological Economics
journal homepage: www.elsevier.com/locate/ecolecon
https://doi.org/10.1016/j.ecolecon.2021.107047
Received 13 May 2020; Received in revised form 28 January 2021; Accepted 12 March 2021
economic and environmental implications of various sensing approaches.
Recent research shows that the adoption of variable rate technolo- gies is very heterogeneous, with widespread adoption in large-scale farming systems, as in the USA, but low uptake in small-scale farming systems, as in Europe (Barnes et al., 2019; Schimmelpfennig, 2016;
Tamirat et al., 2018). The lack of profitability, especially with small fields and small farms, is a crucial adoption hurdle (Biermacher et al., 2009). Flat pay-off functions and low input prices are key factors for the low economic benefit of variable nitrogen application (Pannell, 2006;
Pannell et al., 2019). In addition, areas with a higher spatial heteroge- neity of yields are assumed to have a greater potential for benefits from site-specific management (Meyer-Aurich et al., 2010; Pannell et al., 2019), although this does not necessarily lead to higher economic benefits (Bachmaier and Gandorfer, 2012; Lawes and Robertson, 2011).
The potential benefits depend strongly on the extent to which this variability can be measured (Basso et al., 2011), whereby data collection is the most important step in this process, i.e., the sensing approach for the application of the VRT (Basso et al., 2016; Basso et al., 2011; Bier- macher et al., 2009; Koch et al., 2004; Meyer-Aurich et al., 2010).
In the existing literature, there are very few studies dealing with the profitability of VRT in small-scale farming systems and new sensing technologies. Studies carried out for Europe are either based on man- agement zones and the associated optimal N fertilization rate (Basso et al., 2016; Basso et al., 2011; Koch et al., 2004; Meyer-Aurich et al., 2010), or focus on a specific type of sensing approach used in VRT (Biermacher et al., 2009; Godwin et al., 2003). Moreover, recent tech- nological developments in sensing (e.g., via satellites, drones etc.,), guidance and application are expected to be game-changers by increasing the range of cost-efficient variable rate technologies, also in small-scale farming systems (e.g., Finger et al., 2019; Walter et al., 2017). The initial investment cost for these sensing technologies, as well as the costs of utilizing this information, depends largely on the type of technology. For example, satellite imagery might be freely available but require further processing costs, while the purchase of a nitrogen sensor or a drone may involve an investment of several tens of thousands of francs. Here we focus on the hitherto undocumented economic benefits of these technologies for farmers in the context of variable rate fertil- ization. This means it is not clear which market and environmental conditions make which type of sensing technology profitable for farmers and how polices can help overcome adoption hurdles and thus improve agriculure’s environmental footprint.
We aim to fill these gaps by examining which sensing technology provides information that is precise enough to be useful for farmers in connection with VRT applications. We focus on the applicability of these technologies in small-scale farming systems, using Swiss wheat pro- duction as our example. To this end, we develop a conceptual model that allows us to assess the benefits of different sensing approaches and parametrize a bio-economic simulation model to derive optimal nitro- gen use and the economic benefits of these technologies. In our simu- lations, we consider market and policy conditions as well as three components of field level environmental heterogeneity: i) the difference between soil conditions and thus optimal N use; ii) the heterogeneity of different soil types across the field measured by the Shannon Index; and iii) the spatial clustering of soils within the field, i.e., the spatial auto- correlation, measured by the Moran ’ s I value. Assuming that site- specific management is potentially more beneficial on areas with higher spatial heterogeneity, (Meyer-Aurich et al., 2010; Pannell et al., 2019), we hypothesize that for fields with high heterogeneity in soil types (i.e., a high Shannon Index) and low spatial autocorrelation (i.e., a low Moran’s I value) both profits and the environment benefit from a technology with greater spatial resolution.
Our results show that technologies with high spatial resolution are more useful under conditions of high environmental heterogeneity.
However, in our case study, the overall economic benefits of VRT remain low, while the technology still leads to high costs in small-scale farming
systems. Thus, the investment in VRT may not be profitbale for small farms and indeed the additional benefits of higher resolution sensing approaches, such as drones, might fail to offset the costs involved when applied to small-scale farming systems. For example, we find that the use a drone that provides the highest resolution of 2x2m should not cost over 4.5 CHF (approx. 4.25 € ) per hectare more than a 10x10m satellite image. Thus, while VRT in general and, more specifcally, the use of higher resolution sensing approaches provide environmental benefits, farmers are unlikely to adopt them. Better polices are essential to open the way for the environmental and economic opportunities arising from precision farming. For example, adoption rates could be increased by providing financial incentives to farmers in the form of subsidies and/or nitrogen taxes for generating environmental benefits by using (better) variable rate technologies and technology providers, such as contrac- tors, could play a vital role in technology adoption in small-scale farming systems.
The remainder of the paper is structured as follows. Firstly, we present an overview of different sensing technologies that can be used to collect information for the application of VRT. Next, we develop a simulation framework for the adoption of these technologies. We then provide numerical results for the profitability of variable rate nitrogen application in Swiss wheat production focusing on i) the impact of environmental heterogeneity on technology choice; ii) nitrogen use and yields with technologies using different spatial resolutions; and iii) changes in nitrogen use with a tax on fertilizer. Finally, we discuss our results with respect to the existing literature and draw policy conclusions.
2. Background: Types of Variable Rate Technologies
VRT does not merely describe one specific technology, but rather a range of technologies. The practical implementation of VRT is a cyclical process with the following steps: a) data collection, b) interpretation of the data collected, c) implementation of an appropriate management response, and d) monitoring of results in a continuous learning process of change (Patil and Shanwad, 2009). Data collection depends strongly on the resolution and therefore the accuracy of the data provided by the sensing technology (Table 1). Data can be collected in various ways, i.e., soil sampling, satellite data, drone images, yield mapping or handheld devices. Soil sampling can be carried out either as raster sampling or on the basis of partial areas created, for example, using yield maps. Grid sampling only provides sufficient information on nutrient distribution for small grids of 0.25 – 0.5 ha (Lorenz and Münchoff, 2018).
Two basic site-specific management methods are used for the application of nitrogen: map-based and sensor-based approaches (Ess et al., 2001). The map-based approach focuses on the establishment of management zones. This includes collection of geo-referenced data on yield, soil properties or crop biomass indices. The data is analysed to generate a site-specific map of properties which can be used for variable rate applications (Mooney et al., 2009). Spatial data on soil and plant properties can be obtained from aerial or satellite images or soil samples.
A global position system (GPS), or improved accuracy approaches like differential global position system (DGPS) are used to determine the current location in the field during sampling and application.
The sensor-based approach uses real-time sensors mounted on the
tractor and feedback control to measure soil properties or crop charac-
teristics and this information is available immediately for variable rate
application (Ess et al., 2001). Thus, data can be analysed in real-time
without the use of GPS or geographical information systems (GIS) in
the field (Mooney et al., 2009). However, sensor-based technologies can
also be combined with GPS and GIS to keep input records and compare
annual variations in input use. There are three different methods of
sensor-based nitrogen application: online, offline and an online pro-
cedure with map overlay (Drücker, 2016). The online method is stan-
dard for sensor-based nitrogen fertilization. The spectral indices
measured by sensors are converted into nitrogen target values and
passed directly to the application technology. GPS is not required for this method, but can be used for geo-referenced documentation of the site- specific nitrogen amounts applied. In the offline procedure, data acquisition and application are separated in time and therefore require the use of satellite navigation. The sensor-based data acquisition takes place prior to fertilizer application and the spread rate map based on this data is then processed on the tractor with the appropriate software and
application technology. This method is particularly suitable for crops where plant development is not show sufficiently advanced to be detected by the sensors at the time of application. Despite differences between these two approaches, their utility depends heavily on the ac- curacy of the measurement of the environmental heterogeneity in the data collection step. In the following analysis, we provide an economic framework and a simulation exercise to assess the economic benefits of this data collection step in VRT applications.
3. Economic Framework
Many factors affect the adoption of VRT in small-scale agricultural systems. We focus on two factors that are expected to have economic implications for using VRT: i) variation in costs for information sampling and application of VRT and ii) changes in costs for fertilizing (Bullock et al., 2002), whereby we assume that the net field-level profits π of variable rate fertilizer application (both measured per acreage unit) can be described as follows:
π = ∑
Ki=1
P*Y
i(N) − q
NN
i(Info) − q
XX
i(Info) − C
O− C
Info(1) The first term describes the profit from selling wheat on the markets, where P represents the output price and Y
i(N) denotes the site-specific production function describing crop yield Y
ias a function of nitrogen fertilizer N. The second term includes the cost of nitrogen use depending on the variable rate technology (and thus the information sampling).
The third term covers the other input costs, such as fuel, plant protec- tion, growth regulators and so on. The fourth and fifth terms show quasi- fixed costs for applying fertilizer (C
O), which are not depending on the sensing technologies and information technology (C
Info).
We focus on a single field with heterogeneous soil conditions. To reflect this heterogeneity as well as the varying resolution of different technologies, a field of fixed size (1 ha) is divided into i = 1, ….K parcels.
The higher the resolution of the chosen technology, the higher the heterogeneity detected in the field. Q
Nreflects the price for fertilizer and N
ithe amount of nitrogen applied. X
ireflects the amounts of other inputs (e.g., plant protection, growth regulator etc.,) and q
Xis the vector of other input prices. C
Orepresents the operating costs, e.g., reflecting the quasi-fixed costs of applying fertilizer. C
Infoare the information costs which comprise variable costs incurred for the collection of essential site-specific information on nutrient requirements.
We identify five different approaches to collect the required infor- mation (Info), based on the different types of technology described in Table 1:i) soil sampling, ii) sensing based on a tractor-mounted crop sensor that provides real-time measurements, iii) handheld devices, iv) sensing from satellites and v) sensing using drones. All the information must be processed in a management information system (reflected in investment and quasi-fixed costs). These different sensing approaches do not exclude each other. In fact, combinations are commonly used, e.g., to combine real-time information from the tractor-mounted crop sensor with records from soil samples and field-history data to continually adjust nitrogen rates in the field. Thus, moving from i) to v) increases Info and implies a higher state of information on plant nutrient needs.
We use a profit maximization model for our analysis with focus on the effect of (more spatial) information on N application. Therefore, (quasi-)fixed costs do not appear in the first order conditions (2). The optimal nitrogen level on the parcel is determined by maximizing the profit function with the following first-order condition based on
Table 1Types of data collection for the application in VRT.
Data collection method
Spatial resolution
and accuracy Remarks References
Drones From a few cm per pixel up to 2*2 m (±/- 0.01–0.02 m)
Offers high level of flexibility and spatial resolution.
Images are available on demand. Less dependent on weather conditions than satellite, but still affected by wind and rain.
Expensive and requires specific knowledge for use. Country specific legal regulations may complicate the use of drones.
Candiago et al.
(2015); Gonzalez et al. (2018); Maes and Steppe (2019);
Perera et al. (2019);
Reger et al., 2018
On the go N-sensors (tractor mounted)
125 measuring points per ha (+/- 0.1–0.3 m)
Provides immediate information about crop status and allows direct application without maps.
Purchase of equipment is expensive.
Drücker (2016)
Satellite imagery
<5 m
(microsatellites) 20*20 m/10*10 m (e.g., Sentinel 2) 30*30 m (e.g., EnMAP) (±/-11 m)
Satellite images can be obtained cheaply or even free of charge.
Only periodic coverage and strong dependence on weather conditions (e.g., clouds).
Comba et al. (2018);
Gonzalez et al.
(2018); Wolters et al., 2019
Yield
mapping 20*20 m
(+/− 0.02–0.2 m) Information automatically collected from newer combine harvesters, but only information about previous crops available.
Schimmelpfennig and Ebel (2016)
Soil
sampling Basically free, but mostly between 0.125 and 1 ha
Might be expensive and labour intensive, but must be carried out every 10 years anyway (OLN guidelines) ¨
Ess et al. (2001);
Lorenz and Münchoff (2018)
Handheld
N-sensor Free Not much
equipment needed and relatively easy to use.
Labour intensive to get high spatial resolution.
Munoz-Huerta et al., ˜ 2013
expected profits E( π )
1:
∂ E( π )/ ∂ N = p ∂ f (N)/ ∂ N − q
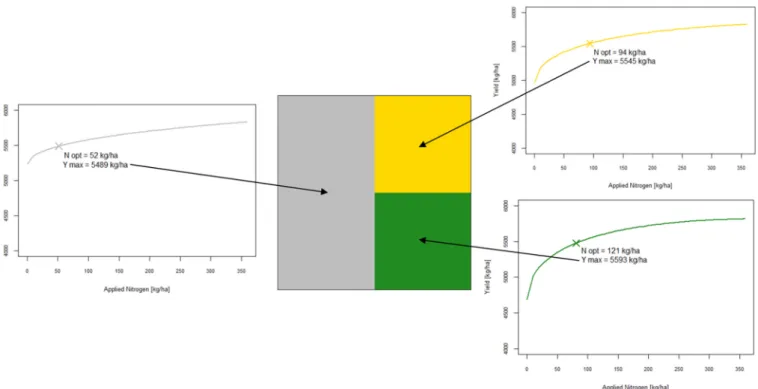
N− q ∂ X/ ∂ N = 0 (2) In line with Bullock and Bullock (2000) and Bullock et al. (2009), we assume a hypothetical quadratic field with three different soil types (see Fig. 1). The soil properties are assumed to be heterogeneous over the whole field, which also implies heterogeneous nutrient requirements within the field. Different technologies can be used to reveal the un- derlying objective soil heterogeneity, i.e., the observed nutrient re- quirements also depend on the technology selected. In our analysis, the surface of the field is divided into square areas of equal size. The size, and thus number of these parcels within the field, is determined by the spatial resolution of the respective technology (cf., Table 1). In all cases, we assume homogeneous conditions within each parcel (see Fig. 2 for an illustration).
Thus, the profit maximizing level of nitrogen use in each parcel de- pends on the technology used. The total amount of nitrogen N
infoused is the sum of all optimum nitrogen N
ioptvalues over all parcels i:
N
info=
∑
Ki=1
N
iopt(3)
Accordingly, total yields can be summarized as follows:
Y ( N
info) = ∑
Ki=1
Y
i( N
iopt)
(4) Finally, total net returns for the field are:
Net return π
info= ∑
Ki=1
p*Y
i( N
iopt)
− q*N
iopt(5)
Our framework shows that the heterogeneity of production condi- tions determines the utility of variable rate application of nitrogen. Net revenues are expected to increase due to the spatial optimization of nitrogen use achieved through variable rate application (Eq. (3)).
Increasing heterogeneity of field conditions is expected to enhance, ceteris paribus, the benefits of variable rate application of nitrogen due to higher N efficiency. Moreover, the advantages of the spatial optimi- zation of nitrogen use achieved with variable rate technologies become increasingly apparent in relation to expenditure for nitrogen. On the other hand, the use of (different) variable rate technologies may lead to an increase/decrease in overall nitrogen use and yield levels (e.g., Finger et al., 2019).
4. Simulation Framework
The empirical implementation is based on information regarding the underlying production functions of the different soils and the distribu- tion of soils across the parcels. The heterogeneity of production condi- tions in our simulations is split into three components: 1) Heterogeneity of soil types represented by different production functions (Fig. 2); 2) Heterogeneity of soil types within the field represented by the Shannon Index; 3) The spatial clustering of soils within the field, i.e., the spatial autocorrelation, represented by Moran’s I value.
4.1. Specification of the Production Function
A major challenge when analyzing the utility of different VRTs in- volves the uncertainty regarding a crop’s response to the use of nitrogen fertilizers, i.e., the production function, which is determined primarily
by complex spatio-temporal interactions between soil properties, pre- vailing weather conditions and variety choices (Morris et al., 2018; Sela et al., 2016; Tremblay et al., 2012). Therefore, the development of a yield response function that represents a crop ’ s response to N-rate management and the definition of the location-specific optimum nitro- gen rate (Basso et al., 2011) are key factors when simulating the benefits of site-specific management. In our study we use a square root function to specify the production function, (e.g., Finger and Hediger, 2008):
Y
i= α
n+ β
nN
m1/2+ γ
nN
m(6)
where Y
iis the yield on parcel i, the N
napplied amount of nitrogen on the parcel and α
n, β
nand γ
nare the coefficients of the regression analysis.
4.2. Production Function and Optimal Nitrogen Values for Different Soil Types
We estimate production functions for three different soil types S1, S2 and S3. Soil types S1 and S3 are defined according to Torriani et al.
(2007), Schmid and Finger (2008) and have the same composition: 26%
sand, 38% clay and 36% silt. The soil depth in both cases is 1.5 m, but the two soil types differ in their organic matter content. The organic matter content of soil type S1 is constant at 2.6% while in soil type S3 it is 2.6% in the upper 5 cm and 2.0% in the lower soil layers. This means that soil type S1 has a higher organic matter content and is therefore more fertile. These soil conditions reflect observations on the Swiss Plateau, the most important arable production region in Switzerland (Torriani et al., 2007). Soil type S2 is a mixture of the other two types and therefore has average fertility. Yield response functions in our analysis are based on a crop simulation model used to simulate N- fertilization experiments for wheat production on the Swiss Plateau (see Schmid and Finger, 2008 for the data). Estimation steps and diagnostics are documented in the Appendix and all codes and data are freely available. The resulting yield response functions for the three soil types are as follows
2:
Y
S1= 5233 + 38.1 * N
opt11/2− 0.34 * N
opt1(7) Y
S2= 4964 + 75.1 * N
opt21/2− 1.57 * N
opt2(8) Y
S3= 4689 + 114 * N
opt31/2− 2.85 * N
opt3(9)
Optimal nitrogen values for each soil type (Fig. 1) are obtained by maximizing the corresponding profit function for every yield response function. In the simulation, we assign each of these yield response functions to one soil type (Fig. 2).
4.3. Simulation Set-up
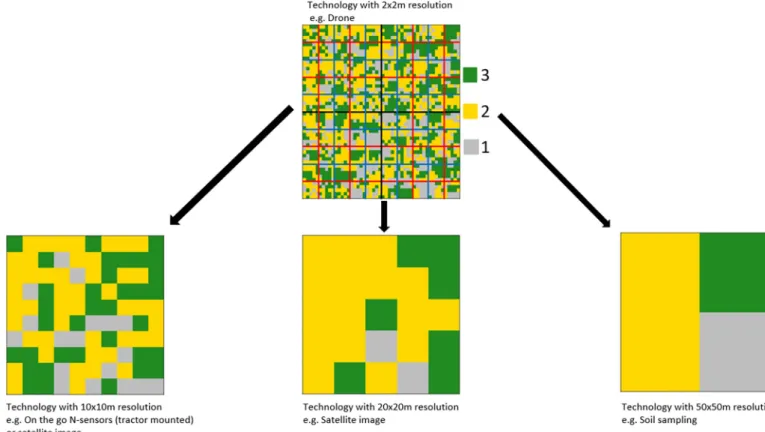
Based on the spatial resolution values for the different technologies (Table 1), we construct four different resolutions for information on the soil structure in a generic field of 1 ha (Fig. 3). Firstly, we create a field with a spatial resolution of 2 by 2 m for a 1 ha (10,000 m
2) area, resulting in 2500 parcels (K). This represents information that can be collected using a drone. We assume that it reveals the actual soil structure of the field and therefore serves as a reference for all further calculations. Secondly, we consider sensing technologies that have a resolution of about 10 by 10 m, such as N-sensors or satellite imagery.
We replace 25 parcels of the reference field (a square of 5 by 5 m) by one parcel representing the most frequent soil type. This results in a field with 100 parcels. Thirdly, we further aggregate the parcels to a resolu- tion of 20 by 20 m, representing sensing technologies such as satellite
1
The variability of profits (e.g., due to volatile yields and prices) and the variability of yield-nitrogen relationships, e.g., due to climate risks also affects optimal fertilizer use of non-risk-neutral decision makers (see e.g.,
Finger, 2012). We focus on profit maximization for clarity of the analysis, but provide astraightforward modelling approach that can be applied easily to extension.
2
Detailed coefficient estimates for the production functions are given in the
Appendix.
imagery or yield maps. In a last step, we only consider information with low spatial resolution, such as soil samples or the use of a handheld device, which results in four parcels per field.
These four levels of spatial resolution are then used in two simulation steps. Firstly, we vary the proportions of the different soil types between 0 and 100% and randomly assign a soil type to one of the 2500 parcels, i.
e., the reference field. The more even the proportions, the higher the Shannon Index in the reference field. In a second step, we allow for clusters in the random assignment of soil types. This leads to clusters with the same soil type and production function in the field and
increases the Moran ’ s I value accordingly.
The simulation process is repeated 10
′000 times for every simulation step. We calculate the utility of each sensing technology for all of the 10
′000 realizations using different values of the Shannon Index and Moran ’ s I. Calculations for yield, nitrogen and net returns were per- formed as described in Eqs. (5), (6) and (7). The prices for nitrogen and wheat used for the basic scenario were aligned to Swiss conditions (Schoch and Cassez, 2019). More specifically, the price of wheat is 0.52 CHF/kg and the price of nitrogen is 1.2 CHF/kg, which reflects the retail price in Switzerland in 2019.
Fig. 1.
Yield response functions derived from simulated data and corresponding profit maximizing nitrogen values. Note that a uniform application of nitrogen would lead to different yields depending on the underlying soil type. This illustrates the efficiency gains from using VRT in a field with various soil types.
Fig. 2.
Yield response functions and optimum nitrogen values (N
opt) for three different soil types in a field with three parcels i.
4.4. Robustness Checks
In addition, we provide various robustness checks. We re-run the analyses described above i) using different output prices, ii) increasing the number of soil types and iii) using a different form of the yield response function, i.e., a quadratic instead of square root function.
Furthermore, we also investigate the outcomes under higher nitrogen
prices as a policy-relevant sensitivity analysis. This reflects the possible effects of a nitrogen tax (e.g., Nam et al., 2007; Finger, 2012). To this end, we assume the nitrogen price increases by 50% and 100% (i.e., from 1.2 CHF/kg to 1.8 and 2.4 CHF/kg, respectively).
All codes and data used in this analysis are freely available with this paper (now attached for review).
Fig. 3.
Aggregation of soil information reflecting different sensing technologies in the simulation framework.
Fig. 4.
Prediction of which spatial characteristics of a field and which information technology are likely to generate the highest net returns.
5. Results
5.1. Optimal Technology Use Under Environmental Heterogeneity The combined results from increasing environmental heterogeneity (Shannon Index and Morans’ I) in our simulation are presented in Fig. 4 which advances a prediction regarding the degree of spatial heteroge- neity and the type of technology that are likely to generate the highest net returns.
The use of a low-resolution technology suffices in cases of low het- erogeneity and little spatial autocorrelation, i.e., the use of a high- resolution technology does not provide any additional economic benefit in our simulations. A technology with medium resolution in- creases net returns if heterogeneity is low and the spatial autocorrelation increases, i.e., the different soil types tend to occur in patches. The use of a high-resolution technology results in higher net returns when both heterogeneity and spatial dispersion increase.
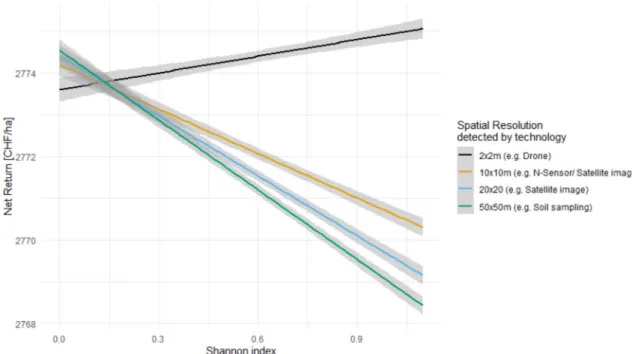
These results can be disaggregated into the effect of heterogeneity (Shannon Index) and spatial clustering (Moran’s I). With respect to the Shannon Index, the simulations show that net returns for high-resolution technologies increase with soil heterogeneity at field level (Fig. 5). This implies that when the Shannon Index values are high, information at lower spatial resolutions can be more useful. Increasing heterogeneity of soil conditions leads to a rise in the difference between the technology with the highest resolution and the other technologies. Thus, high- resolution technologies, such as drones, only generate higher net reve- nues if some critical level of soil heterogeneity is exceeded. Assuming the highest heterogeneity in soil conditions, net returns increase by around 6.5 CHF when using a 2x2m resolution technology rather than a technology with 50x50m resolution. This corresponds to roughly 0.2%
of the expected net returns in Swiss wheat production.
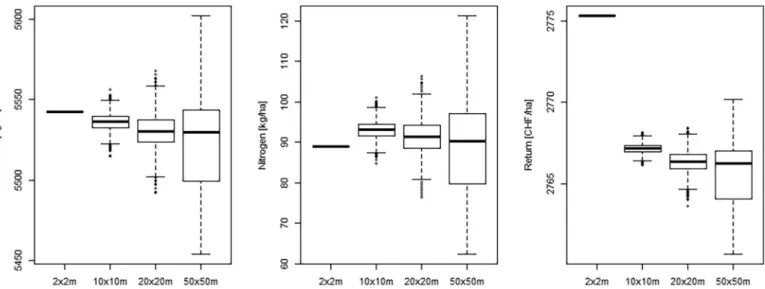
Fig. 6 shows the variability in yield, amount of nitrogen applied and net returns from the variation in Moran ’ s I for the four types of tech- nologies, given a high Shannon Index. Thus, the results can be inter- preted as an upper limit for the benefits of VRT from soil environmental heterogeneity within a field.
The results indicate that the use of a high-resolution technology only leads to a small average increase in yield and reduction in nitrogen input. The standard deviation of nitrogen use increases by 10 kg/ha
when using lower resolution technologies which corresponds to 11% of nitrogen input with high-resolution technologies. Consequently, the difference in net returns is also rather small and comparable to the in- crease in the Shannon Index. However, high-resolution sensing tech- nology clearly reduces variability in yields, nitrogen use and thus overall net returns.
5.2. Nitrogen Input and Yield With Information on Different Spatial Resolutions
The extent of these changes in net returns also depends on input and yield levels (Fig. 7). A comparison of nitrogen input and yields for the different sensing technologies shows that in cases with low to medium input applications, the use of a technology with a high spatial resolution leads to higher yields. When input use is high, i.e., in the section where the production functions are flat, lower resolution technologies result in the same yield levels as the high-resolution technology. This reflects our assumption that production functions converge with higher nitrogen input. The use of a technology with high spatial resolution only leads to a more efficient use of nitrogen if there is a heterogeneous reaction between the production function and the amount of nitrogen applied.
5.3. Nitrogen Input With Taxes
Fig. 8 illustrates the differences in net returns between the technol- ogies with the highest spatial resolution and those with the lowest res- olution for two different levels of input prices. Net gains increase with higher heterogeneity. However, differences in net returns between high- and low-resolution technologies remain relatively small in all cases.
Given the current nitrogen price of 1.2 CHF/kg, the average difference is no more than 5 CHF /ha even with high heterogeneity. If the nitrogen price is doubled, e.g., due to a nitrogen taxation (2.4 CHF/kg), the dif- ference increases only slightly, and is still low (approx. 8 CHF/ha), even with high heterogeneity. In addition, a further increase in the nitrogen price does not lead to a bigger difference in net returns between the technologies, because the amount of nitrogen applied declines. Thus, higher nitrogen prices generate little additional incentive to use a high- resolution technology.
Fig. 5.
Average net return values with 95% confidence interval for the four different categories of technologies depending on the soil heterogeneity represented by
the Shannon Index.
6. Discussion
Our results show that field-level soil heterogeneity plays an impor- tant role in the utility of different types of sensing approaches when using variable rate fertilization. The difference between the net utility of a high-resolution technology and those offering medium or low spatial resolution rises with higher spatial heterogeneity, as indicated by an increasing Shannon Index and with low spatial autocorrelation of the different soil types. These results support our hypothesis that fields with high heterogeneity require a technology with high spatial resolution.
Nevertheless, the differences between the individual technologies remain rather small, i.e., about 0.2% of total returns even with high environmental heterogeneity. To some extent these results reflect the observed “ flatness of the payoff function ” which in many crops has the effect of reducing the potential benefits of variable rate nitrogen appli- cations in agricultural systems with a high nitrogen input (Pannell et al.,
2019; Pannell, 2006). If nitrogen management with farmyard fertilizer in the form of slurry, which is very common in Switzerland, is also taken into account, the benefits of variable nitrogen application could sink even further.
When interpreting these results, it should be borne in mind that the use of VRT also leads to higher information costs, including expenditure for the hardware and software needed when using precision technolo- gies. These are not considered in our analysis, but vary significantly depending on the source of information. For example, satellite images provide reliable high-resolution remote sensing data (Meier et al., 2020) but are still inexpensive or are even available free of charge. Our sim- ulations suggest that this information can pay-off if there is a certain level of environmental heterogeneity within fields. The number of pixels required for site-specific cultivation depends on the heterogeneity of the field and the type of agricultural machinery used (Meier et al., 2020).
Practical experience suggests that a minimum of 50 pure spectral
Fig. 6.Yield, amount of nitrogen applied and net returns for the four different categories of technologies in the case of high heterogeneity of soil types (high Shannon Index) and variation in Moran
’s I (N
=10
′000).
Fig. 7.
Resulting combinations of nitrogen input and the yield obtained by using different sensing technologies. Each data point represents the result of a simulation
run (N
=10
′000) for one technology.
samples per field is required to develop site-specific management mea- sures in a meaningful way (Meier et al., 2020). However, as fields in Switzerland are rather small and are often irregular in shape, a tech- nology with high spatial resolution might be needed to reach this number. In this case, drone imagery may provide sufficient spatial resolution.
This technology could well prove too expensive, given the high in- vestment costs and the need for highly skilled labour. Our results suggest that a drone should not cost over 6.5 CHF/ha and year if it is to be more profitable than a low-resolution technology like soil sampling, or not more than 4.5 CHF/ha compared to the use of a 10x10m satellite image.
However, the investment costs vary greatly for the different technolo- gies. While satellite imagery is sometimes available free of charge or at a very low price, drones or nitrogen sensors can cost up to several thou- sand francs to purchase. However, having to seek additional informa- tion, e.g., to create prescription maps, may result in further direct or indirect costs. Moreover, the implementation of an appropriate man- agement response, e.g., through N-sensors mounted on machinery, will also lead to additional fixed costs amounting to several thousand francs.
These costs can result either from upgrading existing machines or pur- chasing a new machine suitable for variable rate application. Utilized farm area and useful service life determine the costs per hectare and year.
This implies that the utility of high-resolution technologies in VRT application should also be assessed in the context of investment costs.
The costs per ha and year arising from investments in sensors, drones or similar new technologies will depend largely on i) farm size on which technology can be used, ii) service lifetime of the technology and iii) possibilities to use equipment for other purposes (e.g., using drones for other scouting activities). Given that technologies develop quickly (implying shorter anticipated service life), the results presented here suggest that information technologies are hardly viable as stand-alone investments for individual farms in small-scale farming systems as in Switzerland (average farm size is about 20 ha (Swiss Federal Statistical Office FSO, 2019)). However, technology investments across multiple- farms, machine pools or the engagement of contractors may be viable options for adoption of variable rate fertilization in these systems.
In addition to the investment costs, there are other factors which may have a negative impact on VRT utility and which must be considered when evaluating VRT. For instance, when creating an application map, the capacity of the machine (e.g., the fertilizer spreader) must be taken into account (Welsh et al., 2003). Conventional fertilizer spreaders can only vary the application rate within certain limits. Thus, the informa- tion contained in the drone imagery must be downscaled to the mini- mum 7 × 7 m resolution of the application map for the common tractor terminal (Argento et al., 2020). Nevertheless, a drone-based approach provides additional benefits when compared to other sensing ap- proaches. For example, it allows vegetation development to be studied in more detail, which can be useful for improving other crop manage- ment processes and information can be gathered even on cloudy days (Argento et al., 2020). In addition, it is important to consider sources of error in variable rate applications (Dillon, 2003). The travel path chosen for fertilizer application is one possible source of errors. An optimum path definition can significantly reduce spreading errors resulting from the different changes in the desired application rates. Even the decision to drive up and down the field instead of from left and right can have a significant influence on the spreading error. In our model, we ignore possible constraints imposed by fertilizer spreaders. More specifically, a high-resolution sensing approach would also involve more costly, high- resolution fertilizer application technologies. In addition, our results present a rather optimistic picture of the economic benefits of high- resolution sensing approaches. In our model based on production functions, we assume that farmers are familiar with the production system and the associated spatial differences and can exploit them by adjusting fertilizer application. In real-world settings this may be not always possible if indicators like NDVI or NDRE are used.
The direct private economic benefits presented here suggest that
there is little economic incentive to use VRT for nitrogen application,
which may also explain the low adoption of these technologies in small-
scale agriculture. However, precision agriculture technologies, in
particular drones, not only provide information about the nitrogen sta-
tus of plants, but they can also supply additional information about
water and heat stress, lack of other nutrients and the presence of diseases
and weeds (Bogue, 2017; Candiago et al., 2015; Hunt Jr and Daughtry,
Fig. 8.Difference in net returns between a technology with 2x2m spatial resolution (e.g., drone) and a technology with 50x50m spatial resolution (e.g., soil
sampling) for two different nitrogen price levels and depending on field heterogeneity represented by the Shannon Index.
2018). Farmers can then use this additional information to optimize other inputs such as water and pesticides (Moskvitch, 2015) which could further reduce the variability of input use, yields and returns. Further- more, the use of VRT might have a positive impact on crop quality. A study by Karatay and Meyer-Aurich (2020) has shown that VRT can increase the protein content of wheat. This would improve the profit- ability of VRT, as a premium is paid for a higher protein content.
Finally, the use of VRT also implies possible public benefits, i.e., reduction of negative environmental impacts (Balafoutis et al., 2017).
Nitrogen surpluses can leach into groundwater and thus diminish its quality (Grizzetti et al., 2011) and consequently VRT nitrogen man- agement, adapted to the needs of the crop, could reduce negative environmental impacts caused by nitrous oxide emissions and nitrogen leaching (Zhang et al., 2015; Balafoutis et al., 2017; Tey and Brindal, 2012). Therefore, targeted nitrogen application using VRT can reduce these losses and help avoid nitrate contamination in groundwater to the benefit of both society and the environment (Hansen et al., 2017). In addition to the positive impact on the environment, the use of VRT could also have a positive social side effect by reducing the administrative burden for the farmer. However, these benefits are difficult to quantify and, in any case, an increase in the price of nitrogen via taxation only leads to a small increase in net returns that is unlikely to cover the additional costs for the technology. Therefore, it may be necessary to seek a combination with other policy measures, i.e., subsidizing such technologies (Finger et al., 2019). This kind of policy can help open up the environmental and economic opportunities arising from precision farming on a wide scale without compromising food production and thus contributing to a more sustainable agriculture.
7. Conclusion
We developed a bio-economic simulation model to analyze the benefits of different sensor techniques in the application of variable rate fertilization, ranging from handheld devices, tractor-mounted sensors, drones to satellite imagery. The evaluation shows the relevance of environmental field characteristics, e.g., heterogeneity of soil conditions and spatial clustering of soil types, in relation to the economic benefits of VRT. Generally speaking, we find that variable rate technologies only provide limited economic benefits under current conditions, e.g., ni- trogen prices are low so there are no savings pay-offs. Moreover, our results show that when there is a high degree of heterogeneity of soil conditions, the use of a technology with a higher spatial resolution, such as a drone, is more efficient than technologies with lower spatial reso- lutions. However, the economic benefits are still low. The absolute dif- ferences in net returns between high- and low-resolution technologies are small and may not offset the additional costs of high-resolution technology. For example, we find that the cost of using a drone should not exceed 6.5 CHF/ha if it is to be more profitable than a low-resolution technology such as soil sampling, or likewise not more than 4.5 CHF/ha as compared to the use of an N-sensor or a 10x10m satellite image.
Thus, the adoption of these technologies depends largely on eco- nomic benefits beyond savings in input expenditures. These include the possibility of VRT increasing the protein content of wheat and supplying additional information on the state of the plants (diseases, water shortages, etc.). Moreover, large-scale adoption will depend on possible benefits for farmers arising from the positive environmental effects of using VRT.
A critical assumption in our bio-economic modelling approach is the specification of the production function that represents the crop ’ s response to the nitrogen management. Our assumption results in a rather flat return (pay-off) function implying decreasing gains with higher nitrogen inputs. This must be considered when interpreting of our results since the effective response might vary considerably in diversified small-scale farming systems such as Switzerland. In this context, more precise data from field trials with different technologies would be very valuable. Furthermore, incorporating the uncertainty
caused by translating raw image information into site-specific yield response function could be another valuable step.
Despite these challenges, our findings have important policy impli- cations. The low economic benefits of VRT will continue to constrain the adoption of these technologies in small-scale farming systems. It might be necessary to implement specific policy measures to open up the environmental and economic opportunities arising from precision farming on a wide scale without compromising food production and thus contributing to a more sustainable agriculture. We find that nitrogen taxation would only encourage the adoption of these sensing technolo- gies if combined with other policy measures, i.e., subsidizing such technologies. Our findings underline that these policy measures should not focus primarily on the individual farmer but rather on farmers’
networks or specific technology providers such as contractors. It is possible that the economic benefits of VRT only play out at larger spatial levels. Accordingly, further research could examine the role of networks and contractors in the adoption of precision agriculture technologies in small-scale farming systems.
Declaration of Competing Interest
The authors declare that they have no known competing financial interests or personal relationships that could have appeared to influence the work reported in this paper.
Acknowledgement
This research is supported by the Swiss National Science Foundation (SNSF), within the framework of the National Research Programme
“ Sustainable Economy: resource-friendly, future-oriented, innovative ” (NRP 73), in the InnoFarm Project, Grant-N
◦407340_172433.
Additionally, we would like to thank the anonymous reviewers for their helpful comments on a previous version of the manuscript.
Appendix A. Supplementary Data
Supplementary data to this article can be found online at https://doi.
org/10.1016/j.ecolecon.2021.107047.
References
Argento, F., Anken, T., Abt, F., Vogelsanger, E., Walter, A., Liebisch, F., 2020. Site- specific nitrogen management in winter wheat supported by low-altitude remote sensing and soil data. Precis. Agric. 1–23.
Bachmaier, M., Gandorfer, M., 2012. Estimating uncertainty of economically optimum N fertilizer rates. Int. J. Agron. 2012.
Balafoutis, A., Beck, B., Fountas, S., Vangeyte, J., Wal, T., Soto, I., G´omez-Barbero, M., Barnes, A., Eory, V., 2017. Precision agriculture technologies positively contributing to GHG emissions mitigation, farm productivity and economics. Sustainability 9 (8), 1339.
Barnes, A.P., Soto, I., Eory, V., Beck, B., Balafoutis, A., S´anchez, B., Vangeyte, J., Fountas, S., van der Wal, T., Gomez-Barbero, M., 2019. Exploring the adoption of ´ precision agricultural technologies: a cross regional study of EU farmers. Land Use Policy 80, 163–174.
Basso, B., Antle, J., 2020. Digital agriculture to design sustainable agricultural systems.
Nat. Sustain. 3 (4), 254–256.
Basso, B., Ritchie, J.T., Cammarano, D., Sartori, L., 2011. A strategic and tactical management approach to select optimal N fertilizer rates for wheat in a spatially variable field. Eur. J. Agron. 35 (4), 215–222.
Basso, B., Dumont, B., Cammarano, D., Pezzuolo, A., Marinello, F., Sartori, L., 2016.
Environmental and economic benefits of variable rate nitrogen fertilization in a nitrate vulnerable zone. Sci. Total Environ. 545, 227–235.
Basso, B., Shuai, G., Zhang, J., Robertson, G.P., 2019. Yield stability analysis reveals sources of large-scale nitrogen loss from the US Midwest. Sci. Rep. 9 (1), 1–9.
Biermacher, J.T., Brorsen, B.W., Epplin, F.M., Solie, J.B., Raun, W.R., 2009. The economic potential of precision nitrogen application with wheat based on plant sensing. Agric. Econ. 40 (4), 397–407.
Bogue, R., 2017. Sensors key to advances in precision agriculture. Sens. Rev. 37, 1–6.
Bullock, D.S., Bullock, D.G., 2000. From agronomic research to farm management guidelines: a primer on the economics of information and precision technology.
Precis. Agric. 2 (1), 71–101.
Bullock, D.S., Lowenberg-DeBoer, J., Swinton, S.M., 2002. Adding value to spatially managed inputs by understanding site-specific yield response. Agric. Econ. 27 (3), 233–245.
Bullock, D.S., Ruffo, M.L., Bullock, D.G., Bollero, G.A., 2009. The value of variable rate technology: an information-theoretic approach. Am. J. Agric. Econ. 91 (1), 209–223.
Candiago, S., Remondino, F., De Giglio, M., Dubbini, M., Gattelli, M., 2015. Evaluating multispectral images and vegetation indices for precision farming applications from UAV images. Remote Sens. 7 (4), 4026–4047.
Comba, L., Biglia, A., Aimonino, D.R., Gay, P., 2018. Unsupervised detection of vineyards by 3D point-cloud UAV photogrammetry for precision agriculture. Comput. Electron.
Agric. 155, 84–95.
Diacono, M., Rubino, P., Montemurro, F., 2013. Precision nitrogen management of wheat. A review. Agron. Sustain. Dev. 33 (1), 219–241.
Dillon, C.R., 2003. A framework for economic analysis of cropping systems: profitability, risk management, and resource allocation. J. Crop. Prod. 9 (1–2), 409–432.
Drücker, H., 2016. Precision farming- Sensorgestützte Stickstoffdüngung. KTBL-Heft 113.
Ess, D.R., Morgan, M.T., Parson, S., 2001. Implementing Site-specific Management: Map- versus Sensor-based Variable Rate Application. Pub. No. SSM-2-W. Site-Specific Management Center, Purdue University, West Lafayette, IN.
Finger, R., 2012. Nitrogen use and the effects of nitrogen taxation under consideration of production and price risks. Agric. Syst. 107, 13–20.
Finger, R., Hediger, W., 2008. The application of robust regression to a production function comparison. Open Agric. J. 2 (1).
Finger, R., Swinton, S.M., El Benni, N., Walter, A., 2019. Precision farming at the nexus of agricultural production and the environment. Ann. Rev. Resour. Econ. 313–335.
FSO, 2019. Agriculture and Food: Pocket Statistics 2019. Swiss Federal Statistical Office.
Retrieved Dezember 10, 2020 from. https://www.bfs.admin.ch/bfs/en/home/stati stics/agriculture-forestry/farming.assetdetail.8706379.html.
Gebbers, R., Adamchuk, V.I., 2010. Precision agriculture and food security. Science 327 (5967), 828–831.
Godwin, R., Richards, T., Wood, G., Welsh, J., Knight, S., 2003. An economic analysis of the potential for precision farming in UK cereal production. Biosyst. Eng. 84 (4), 533–545.
Gonzalez, F., Mcfadyen, A., Puig, E., 2018. Advances in unmanned aerial systems and payload technologies for precision agriculture. In: Advances in Agricultural Machinery and Technologies. CRC Press, pp. 133–155.
Grizzetti, B., Bouraoui, F., Billen, G., Van Grinsven, H., Cardoso, A.C., Thieu, V., Garnier, J., Curtis, C., Howarth, R., Johnes, P., 2011. Nitrogen as a threat to European water quality. In: Sutton, M.A., Howard, C.M., Erisman, J.W., Billen, G., Bleeker, A., Grennfelt, P., Grinsven, H.V., Grizzetti, B. (Eds.), The European Nitrogen Assessment. Cambridge University Press, Cambridge, pp. 379–404.
Hansen, B., Thorling, L., Schullehner, J., Termansen, M., Dalgaard, T., 2017.
Groundwater nitrate response to sustainable nitrogen management. Sci. Rep. 7 (1), 1–12.
Hunt Jr., E.R., Daughtry, C.S., 2018. What good are unmanned aircraft systems for agricultural remote sensing and precision agriculture? Int. J. Remote Sens. 39 (15–16), 5345–5376.
Karatay, Y.N., Meyer-Aurich, A., 2020. Profitability and downside risk implications of site-specific nitrogen management with respect to wheat grain quality. Precis. Agric.
21 (2), 449–472.
Koch, B., Khosla, R., Frasier, W., Westfall, D., Inman, D., 2004. Economic feasibility of variable-rate nitrogen application utilizing site-specific management zones. Agron.
J. 96 (6), 1572–1580.
Lawes, R.A., Robertson, M.J., 2011. Whole farm implications on the application of variable rate technology to every cropped field. Field Crop Res. 124 (2), 142–148.
Lorenz, F., Münchoff, K., 2018. Teilfl¨achenspezifische Bodenprobenahme und Düngung.
Retrieved March 17 , 2020 from. https://www.dlg.org/de/landwirtschaft/themen /pflanzenbau/dlg-merkblatt-407/.
Maes, W.H., Steppe, K., 2019. Perspectives for remote sensing with unmanned aerial vehicles in precision agriculture. Trends Plant Sci. 24 (2), 152–164.
Meier, J., Mauser, W., Hank, T., Bach, H., 2020. Assessments on the impact of high- resolution-sensor pixel sizes for common agricultural policy and smart farming services in European regions. Comput. Electron. Agric. 169, 105205.
Meyer-Aurich, A., Weersink, A., Gandorfer, M., Wagner, P., 2010. Optimal site-specific fertilization and harvesting strategies with respect to crop yield and quality response to nitrogen. Agric. Syst. 103 (7), 478–485.
Mooney, D.F., Larson, J.A., Roberts, R.K., English, B.C., 2009. Economics of the Variable Rate Technology Investment Decision for Agricultural Sprayers (No. 1369-2016- 108610).
Morris, T.F., Murrell, T.S., Beegle, D.B., Camberato, J.J., Ferguson, R.B., Grove, J., Ketterings, Q., Kyveryga, P.M., Laboski, C.A.M., McGrath, J.M., Meisinger, J.J., Melkonian, J., Moebius-Clune, B., Nafziger, E.D., Osmond, D., Sawyer, J.E., Scharf, P.C., Smith, W., Spargo, J.T., van Es, H.M., Yang, H., 2018. Strengths and limitations of nitrogen rate recommendations for corn and opportunities for improvement. Agron. J. 110 (1), 1–37.
Moskvitch, K., 2015. Take off: are drones the future of farming? Eng. Technol. 10 (7), 62–66.
Mu˜noz-Huerta, R.F., Guevara-Gonzalez, R.G., Contreras-Medina, L.M., Torres- Pacheco, I., Prado-Olivarez, J., Ocampo-Velazquez, R.V., 2013. A review of methods for sensing the nitrogen status in plants: advantages, disadvantages and recent advances. Sensors 13 (8), 10823–10843.
Nam, C.W., Parsche, R., Radulescu, D.M., Sch¨ope, M., 2007. Taxation of fertilizers, pesticides and energy use for agricultural production in selected EU countries. Eur.
Environ. 17 (4), 267–284.
Pannell, D.J., 2006. Flat earth economics: the far-reaching consequences of flat payoff functions in economic decision making. Rev. Agric. Econ. 28 (4), 553–566.
Pannell, D.J., Gandorfer, M., Weersink, A., 2019. How flat is flat? Measuring payoff functions and the implications for site-specific crop management. Comput. Electron.
Agric. 162, 459–465.
Patil, V.C., Shanwad, U.K., 2009, December. Relevance of precision farming to Indian agriculture. In: Second National Conference on Agro-informatics and Precision Farming.
Perera, T., Priyankara, A., Jayasinghe, G., 2019. Unmanned Arial Vehicles (UAV) in Smart Agriculture: Trends, Benefits and Future Perspectives.
Reger, M., Bauerdick, J., Bernhardt, H., 2018. Drones in agriculture: current and future legal status in Germany, the EU, the USA and Japan. LANDTECHNIK 73 (3), 62–79.
Robertson, G.P., Vitousek, P.M., 2009. Nitrogen in agriculture: balancing the cost of an essential resource. Annu. Rev. Environ. Resour. 34, 97–125.
Schimmelpfennig, D., 2016. Farm Profits and Adoption of Precision Agriculture.
Economic Research Report-Economic Research Service, 217. USDA.
Schimmelpfennig, D., Ebel, R., 2016. Sequential adoption and cost savings from precision agriculture. J. Agric. Resour. Econ. 41 (1), 97–115.
Schmid, S., Finger, R., 2008. Dataset on simulated maize and winter wheat yields in Switzerland under current and future climate conditions. ETH Zurich Res. Collect.
https://doi.org/10.3929/ethz-b-000344460.
Schoch, H., Cassez, M., 2019. Reflex 2019 - Betriebswirtschaftliche Datensammlung.
AGRIDEA.
Sela, S., van Es, H.M., Moebius-Clune, B.N., Marjerison, R., Melkonian, J., Moebius- Clune, D., Schindelbeck, R., Gomes, S., 2016. Adapt-N outperforms grower-selected nitrogen rates in Northeast and Midwestern United States strip trials. Agron. J. 108 (4), 1726–1734.
Stamatiadis, S., Schepers, J.S., Evangelou, E., Tsadilas, C., Glampedakis, A., Glampedakis, M., Dercas, N., Spyropoulos, N., Dalezios, N.R., Eskridge, K., 2018.
Variable-rate nitrogen fertilization of winter wheat under high spatial resolution.
Precis. Agric. 19 (3), 570–587.
Sutton, M.A., Howard, C.M., Erisman, J.W., Billen, G., Bleeker, A., Grennfelt, P., van Grinsven, H., Grizzetti, B., 2011. The European Nitrogen Assessment: Sources, Effects and Policy Perspectives. Cambridge University Press.
Tamirat, T.W., Pedersen, S.M., Lind, K.M., 2018. Farm and operator characteristics affecting adoption of precision agriculture in Denmark and Germany. Acta Agric.
Scand. Sect. B 68 (4), 349–357.
Tey, Y.S., Brindal, M., 2012. Factors influencing the adoption of precision agricultural technologies: a review for policy implications. Precis. Agric. 13 (6), 713–730.
Tilman, D., Balzer, C., Hill, J., Befort, B.L., 2011. Global food demand and the sustainable intensification of agriculture. Proc. Natl. Acad. Sci. 108 (50), 20260–20264. https://
doi.org/10.1073/pnas.1116437108.
Torriani, D.S., Calanca, P., Schmid, S., Beniston, M., Fuhrer, J., 2007. Potential effects of changes in mean climate and climate variability on the yield of winter and spring crops in Switzerland. Clim. Res. 34 (1), 59–69.
Tremblay, N., Bouroubi, Y.M., B´elec, C., Mullen, R.W., Kitchen, N.R., Thomason, W.E., Francis, D.D., 2012. Corn response to nitrogen is influenced by soil texture and weather. Agron. J. 104 (6), 1658–1671.
van Grinsven, H.J., Bouwman, L., Cassman, K.G., van Es, H.M., McCrackin, M.L., Beusen, A.H., 2015. Losses of ammonia and nitrate from agriculture and their effect on nitrogen recovery in the European Union and the United States between 1900 and 2050. J. Environ. Qual. 44 (2), 356–367.
Walter, A., Finger, R., Huber, R., Buchmann, N., 2017. Opinion: smart farming is key to developing sustainable agriculture. Proc. Natl. Acad. Sci. 114 (24), 6148–6150.
https://doi.org/10.1073/pnas.1707462114.
Wang, X., Miao, Y., Dong, R., Guan, Y., Mulla, D.J., 2019. Evaluating the potential benefits of field-specific nitrogen management of spring maize in Northeast China.
In: Precision Agriculture’19. Proceedings of the 12th European Conference on Precision Agriculture. Wageningen Academic Publishers, Wageningen, The Netherlands, pp. 877–882.
Welsh, J.P., Wood, G.A., Godwin, R.J., Taylor, J.C., Earl, R., Blackmore, S., Knight, S.M., 2003. Developing strategies for spatially variable nitrogen application in cereals, part II: wheat. Biosyst. Eng. 84 (4), 495–511.
Wolters, S., S¨oderstr¨om, M., Piikki, K., Stenberg, M., 2019. Near-real time winter wheat N uptake from a combination of proximal and remote optical measurements: how to refine Sentinel-2 satellite images for use in a precision agriculture decision support system. In: Precision Agriculture’19. Wageningen Academic Publishers,
pp. 415–421.
Zhang, X., Davidson, E.A., Mauzerall, D.L., Searchinger, T.D., Dumas, P., Shen, Y., 2015.
Managing nitrogen for sustainable development. Nature 528 (7580), 51.