https://doi.org/10.1177/2058739218819171 European Journal of Inflammation Volume 16: 1 –8
© The Author(s) 2018 Article reuse guidelines:
sagepub.com/journals-permissions DOI: 10.1177/2058739218819171 journals.sagepub.com/home/eji
Creative Commons Non Commercial CC BY-NC: This article is distributed under the terms of the Creative Commons Attribution-NonCommercial 4.0 License (http://www.creativecommons.org/licenses/by-nc/4.0/) which permits non-commercial use, reproduction and distribution of the work without further permission provided the original work is attributed as specified on the SAGE and Open Access pages (https://us.sagepub.com/en-us/nam/open-access-at-sage).
Introduction
The rapid accumulation of polymorphonuclear cells (PMNs) at a specific site of inflammation is an essential part of host defence. PMNs are stimu- lated by several chemoattractants (CAs) to leave the bloodstream and migrate along a gradient towards the site of inflammation or injury. Among the CAs are the bacterial peptide n-formyl-l-meth- ionyl-l-leucyl-l-phenylalanine (FMLP) and the chemokine interleukin-8 (IL-8). The secretion of these CAs at the site of inflammation ensures a chemotactic gradient, causing an aligned migration of PMNs, which is distinguishable from random chemokinesis without a chemotactic gradient.
1,2Several assays have been applied to investigate chemokinetic movement of PMNs. While the Boyden chamber was the first system to measure chemotaxis in vitro, a number of other systems including the Zigmond chamber, the Dunn chamber,
Time course of chemotaxis and
chemokinesis of neutrophils following stimulation with IL-8 or FMLP
Matthias Hattenkofer,
1Michael Gruber,
1Sophia Metz,
1Sophie-Marie Pfaehler,
1Karla Lehle
2and Benedikt Trabold
1,3Abstract
Polymorphonuclear cells (PMNs) attend to inflammatory sites by chemotactic movement, caused by chemoattractants (CAs) like n-formyl-l-methionyl-l-leucyl-l-phenylalanine (FMLP) and interleukin-8 (IL-8). However, distinct but applicable assays for investigations of PMNs’ migration limit in vitro examination. We integrated CD15-bead-based isolation of PMNs with analysing their chemotaxis in a novel 3D-µ-Slide migration chamber. The PMNs were exposed to different concentrations of FMLP and IL-8 (1, 10 and 100 nM) and observed for 180 min in cell-physiological environment conditions.
Moving PMNs’ percentage (median and interquartile range) decreased from 62% (27%) to 36% (31%) without CA, from 88% (30%) to 22% (26%) for 1 nM IL-8, from 70% (22%) to 28% (13%) for 100 nM IL-8, from 30% (23%) to 18% (46%) for 1 nM FMLP and from 76% (20%) to 28% (13%) for 100 nM FMLP. Centres of cell movement turned towards the CAs (negative values) within a single 30-min observation period: 5.37 µm (16.82 µm) without CA, −181.37 µm (132.18 µm) with 10 nM and −239.34 µm (152.19 µm) with 100 nM IL-8; −116.2 µm (69.07 µm) with 10 nM and −71.59 µm (98.58 µm) with 100 nM FMLP. FMLP and IL-8 ensure chemotaxis without increase of chemokinesis. 3D-µ-Slide chemotaxis chambers facilitate time course analyses of PMNs’ migration in stable conditions over a long time with concise distinction of chemotaxis and chemokinesis.
Keywords
Chemotaxis, FMLP, IL-8, neutrophils, PMNs
Date received: 4 August 2018; accepted: 12 November 2018
1
Department of Anaesthesia, University Hospital Regensburg, Regensburg, Germany
2
Department of Thoracic Surgery, University Hospital Regensburg, Regensburg, Germany
3
Institute of Anaesthesia, Asklepios Hospital, Bad Abbach, Germany Corresponding author:
Benedikt Trabold, University Hospital Regensburg, Franz-Josef-Strauss- Allee 11, 93053 Regensburg, Germany.
Email: benedikt.trabold@klinik.uni-regensburg.de
Letter to the Editor
micropipette- or microfluidic assays have been used.
3Although these assays are widespread, they are often inadequate in providing a reproducible, controllable and stable gradient or are limited by their complex handling.
4–6To closely mimic the in vivo condition, an efficient chemotaxis system demands two steps:
1. Reliable isolation of PMNs in adequate quantities and viability;
2. Chemotaxis assays being sensitive, repro- ducible and easy to use.
In the present investigation, we describe a tech- nique, which integrates the two steps of isolating PMNs by using anti-CD15 microbeads and analys- ing their FMLP- and IL-8-induced chemotaxis on a 3D-µ-Slide migration chamber. Whereas the microbead method enables isolation of purified PMNs in sufficient quantity, viability and without pre-activation, the 3D-µ-slide facilitates high-qual- ity microscopy, linear concentration gradients and support of long-term assays.
7–9Materials and methods
The ethic committee (Ethikkommission, Faculty of Medicine, University Regensburg) approved the study (ethic vote 15–101–0043).
Isolation of PMNs
Six test persons participated in the investigation.
After confirming their written informed consent,
5 mL of blood was drawn from each healthy test person. To isolate the PMNs at high purity, the method of pluriSelect Life Science (Leipzig, Germany) was chosen, targeting CD15
+cells (Table 1 in Zengel et al.
10) with anti-human CD15 antibod- ies located on the surface of spherical beads (S-Beads). Following the instruction manual, the heparinized blood was incubated with CD15S- Beads at room temperature. After incubation, the sample was repeatedly washed to separate the S-Beads from non-binding cells. At the end of the isolation process, the connection between PMNs and S-Beads was resolved by adding a detachment buffer (w/o calcium) and a highly purified isolate of PMNs was retrieved. After final centrifugation, all extracted cells were suspended in RPMI 1640 (PAN-Biotech GmbH, Aidenbach, Germany) with 10% foetal calf serum (FCS; Sigma-Aldrich Chemie GmbH, Steinheim, Germany).
In three representative samples, the cells were further examined for purity and cellular death by flow cytometry. To detect any effect of the CAs on the viability of the cells, the three samples were split and separately either suspended in medium (RPMI 1640 with 10% FCS) or exposed to FMLP (Sigma) or IL-8 (Abcam Plc, Cambridge, UK) in medium in 1, 10 and 100 nM concentrations for up to 3 h. No effect of the CAs on the cells’ viability was detectable in the fluorescence-activated cell sorting (FACS) analyses, and the isolation method proofed to be highly selective on PMNs (95.1%, interquartile range (IQR) 1.6%). The median cells’
viability was 93.91% (IQR 7.15%).
Preparation of the migration chamber
For the chemotaxis experiments, a 3D-µ-Slide migra- tion chamber (Ibidi GmbH, Planegg, Germany) was used, which primarily consists of one channel for the cells and two reservoirs for the CAs or respectively the CA-free media on either side of the channel.
For our observations, we applied to the instruc- tions given by Ibidi in the application notes 17, 22, 23 and 26 (Ibidi GmbH). In accordance with these instructions, we produced a collagen–cell gel at a concentration of 0.5 mg/mL collagen and 3 × 10
6cells/mL and filled it into the channels.
During the gelation process of the gel, the filled migration chamber was incubated in a humid Petri dish at 37°C and 5% CO
2for 35 min. To prevent the cells from sedimentation through the gelling liquid and getting attached on the bottom of the
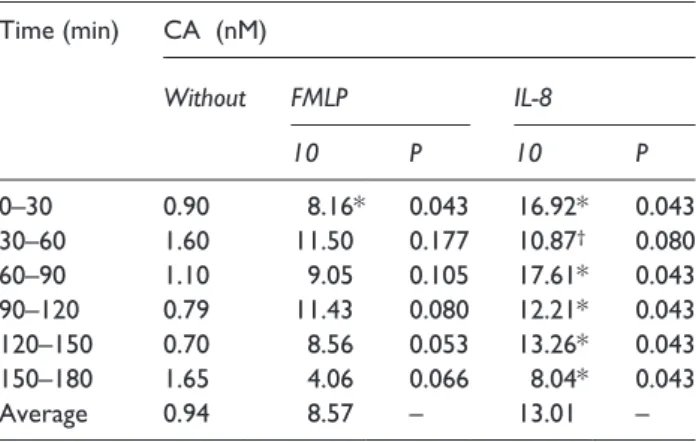
Table 1. Ratio of x- to y-Centre of Mass.
Time (min) CA (nM)
Without FMLP IL-8
10 P 10 P
0–30 0.90 8.16* 0.043 16.92* 0.043
30–60 1.60 11.50 0.177 10.87
†0.080
60–90 1.10 9.05 0.105 17.61* 0.043
90–120 0.79 11.43 0.080 12.21* 0.043
120–150 0.70 8.56 0.053 13.26* 0.043
150–180 1.65 4.06 0.066 8.04* 0.043
Average 0.94 8.57 – 13.01 –
CA: chemoattractant; FMLP: n-formyl-l-methionyl-l-leucyl-l-phenylala- nine; IL-8: interleukin-8.
Ratios are displayed for CA-free cases and for FMLP and IL-8 in 10 nM concentration, because here the greatest effects were seen. P refers to the comparison of FMLP or IL-8 to CA-free cases.
*Value is significantly (P < 0.05) different from corresponding value in cases without CA.
†
A greater effect was seen with 100 nM IL-8: 18.77, P = 0.08.
channel, the Petri dish was turned upside down after 15 min and again turned upside after another 10 min.
As CAs IL-8 and FMLP in 1, 10 and 100 nM concentrations in a medium of RPMI 1640 with 10% FCS were applied, a solution of RPMI 1640 with 10% FCS was placed as a negative control.
11After the end of the gelation process, the reservoirs of the µ-Slide were filled with either one of the CAs in medium or CA-free medium.
For experiments with CAs, the reservoir sited left to the channel was filled with the chemoattrac- tive solution, and the opposite reservoir on the right side of the channel was filled with the inert negative control. In case of control experiments, we filled both reservoirs with the inert solution.
Once a reservoir contains a chemoattractive solu- tion, a gradient of the CA towards the migration channel is established instantly. As a result, the cells within the gel are exposed to the stimulating effects of the specific CA.
10Microscopy
After the preparation of the chemotaxis chamber, cell movement was observed under a BZ-8100E microscope (Keyence Deutschland GmbH, Neu- Isenburg, Germany). During observation the µ-slide chamber was heated at 37°C and fumigated with 5% CO
2using the climate box INUA EF-F1 (Tokai Hit Co. Ltd., Fujinomiya-shi Shizuoka-ken, Japan). Observation was performed at a 10× mag- nification in a bright field modification at a lens wide of 0.17 with a Plan Fluor objective (20×/0.45, Keyence). At our setting, 1 pixel is consistent with 1.31 µm.
The period of observation was 180 min with one frame per minute taken for each channel. The migration chamber was fixed on the microscope table and the exact same location was electroni- cally monitored every minute. Due to technical limitations, we could observe only two of the three channels in the 3D-µ-Slide Chamber at our time interval between two pictures. For each observa- tion field in the two channels, 10 pictures were taken at different z-levels to minimize the impact of vertical movement during the observation. The picture with the highest contrast was chosen by the picture analysing software BZ 9000 Generation II Analyzer (Version 2.2, BZ-H2A/H2AE, Keyence) for further assessment. The resulting 180 pictures
– representing 180 min of observation – were divided into six episodes of 30 pictures each. This procedure guaranteed good conditions for manual analysis of the episodes by ImageJ (Version 1.47;
National Institutes of Health, Bethesda, Maryland, USA, http://rsb.info.nih.gov/ij/), as it also enabled us to scrutinize cell movement over the time.
Analysis of the chemotaxis parameters
All cells were tracked by Manual Tracking (Fabrice Cordelières; Institut Curie, Orsay, France), a plugin of ImageJ. In our analysis, we focused on the per- centage of moving cells and on different chemot- axis parameters.
Therefore, we defined as criterion for cell move- ment: An observed cell must not show a velocity of 0 µm/min in more than 50% of the frameshifts of a 30-min period. As single movement of one cell from one frame to the next frame, we defined that the cell must move completely out of the courser’s crosslines – corresponding to a distance of 8.8 µm.
In that case, we would move the courser’s crosslines to the cell’s new centre, acknowledging the cell’s movement. By this definition, all moving cells must at least show 15 single movements in a 30-frame episode. In the first picture of every epi- sode, that is, at minute 0, 30, 60, 90, 120 and 150, 50 cells were numbered by chance and subse- quently tested according to the moving criterion.
As a result, we could determine the percentage of moving cells for each episode.
If more than 20 cells were denominated as ‘mov- ing’, only the first 20 cells were taken into further chemotaxis analysis by ImageJ’s Chemotaxis Tool (Version 1.01, National Institutes of Health, Bethesda, Maryland, USA, http://www.ibidi.de/
applications/ap_chemo.html). If less than 20 cells could be identified as moving, only these ones were taken into further assessment. To detect effects on the PMNs’ motility, we compared the fraction of moving cells in cases, when CAs were present, to the fraction of moving cells, when no CAs were present. This ratio of moving cells indi- cates whether the fraction of moving cells rose in the presence of a CA (ratio >1) or declined (ratio
< 1) compared to the situation, when no CA was present.
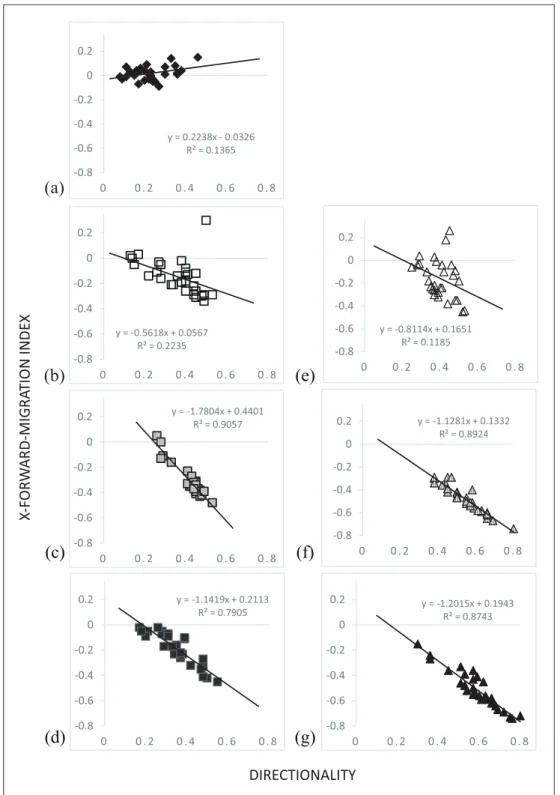
For chemotaxis analysis, we used the x- and
y-Forward-Migration Index (FMI) and the x- or
y-Centre of Mass (CoM). Because the CA was
always placed left to the channel, a migration towards the CA would result in a negative xCoM and xFMI. The CoM parameter indicates the aver- age translocation of the cells along the x-axis (xCoM) or the y-axis (yCoM). To detect chemot- axis of PMNs, we referred the PMNs’ movement in parallel direction to the CA (xCoM) to their move- ment in perpendicular direction (yCoM). Using only the absolute ratios of xCoM to yCoM, we could distinguish between chemokinesis (ratio ~1) and chemotactic movement in x-direction (ratio
> 1) or y-direction (ratio < 1).
Chemotactic effects could additionally be quan- tified by the FMI, which describes the efficiency and direction of any movement along either the x-axis (xFMI) or the y-axis (yFMI). To distinguish between chemotaxis in x- (ratio >1) and y-direc- tion (ratio < 1) and chemokinesis (ratio ~1), we analogously determined a ratio for the FMI index, as we did before with the CoM, again using only absolute values.
For further distinction of chemokinesis and chemotaxis, the Rayleigh test was applied. By com- parison of the FMI of both axes, the Rayleigh test for uniformity enables the analysis of circular distri- bution of cells. At a significance level of 0.05, its null hypothesis of an aligned migration was rejected.
Further on, we could quantify the effectiveness of any chemotactic movement using the Directionality.
This parameter is the relation of Euclidean to accu- mulated distance and, thus, measures the efficiency of the cells’ movement. Finally, we measured the mean velocity of the PMNs during observations.
All experiments were manually analysed by one person. Thus, we investigated the individual influ- ence on the results. A priori not involved staff (n = 5) analysed two different, blinded frame sets from 30 min periods, and their results were com- pared to the ones of the main investigator. No sig- nificant difference in the results could be found between the main investigator and the controlling staff (data not shown). Five experiments for each different concentration of IL-8, FMLP and for the negative controls were performed.
All data are displayed as median with interquar- tile ratio (IQR). Variables were compared between the groups by applying the Kruskal–Wallis test. In case of significant findings, the Wilcoxon rank- sum test with Bonferroni correction was used.
Analyses were performed using R (R Development Core Team, www.R-project.org), Excel (Microsoft,
Redmond, WA, USA) and SPSS (IBM Corporation, Armonk, NY, USA). P < 0.05 was considered to be statistically significant.
Results
Fraction of moving cells and motility ratio
During all observations, between 20% and 85% of the initially targeted cells were identified as mov- ing cells according to the above-mentioned crite- rion. Without CAs, the fraction of moving cells decreased from 62% (IQR 27 %) at the first obser- vation period to 36% (IQR 31%) after 3 h.
1 nM FMLP caused statistically insignificant lower ratios of moving cells than the CA-free cases.
Among the CAs, 10 nM FMLP showed constant high-motility ratios with the highest score (1.89, IQR 0.16); 100 nM FMLP activated the cells espe- cially in the first hour, and then, its ratio decreased insignificantly beneath the unstimulated level.
IL-8 in 1 and 100 nM concentrations caused an elevated ratio in the first hour, and then, their ratios decreased insignificantly below the ratio of unstim- ulated cells; 10 nM IL-8 caused high ratios of mov- ing cells throughout the time. All CAs had no statistically significant influence on the motility ratio compared to CA-free cases – except for 10 nM FMLP in the observation interval from 30–120 min (P = 0.043).
Displacement of centre of mass
The CoM along the x-axis (xCoM) for non- stimulated cells lay in a range from −3.47 µm (IQR 7.53 µm) to + 5.5 µm (IQR 4.36 µm).
Stimulation with FMLP achieved a nearly con- tinuous shift of the xCoM towards the CA in all concentrations. Compared to non-stimulated cells, 10 nM FMLP had significant higher xCoM values throughout the observation. 1 and 100 nM FMLP only partially had significant higher values (Supplemental Data). Stimulation with 10 nM FMLP effected a higher absolute shift of xCoM (−116.20 µm, IQR 69.07 µm) than stimulation with 100 nM FMLP (−71.59 µm, IQR 98.58 µm).
Towards the stimulation origin, 1 nM IL-8 achieved a continuous shift of the xCoM.
Stimulation with 10 or 100 nM of IL-8 resulted in a
strong shift of the xCoM. However, their effects on
the xCoM were declining within the beginning of
the observation (100 nM) after 90 min (10 nM).
Among IL-8, only 10 nM had a significant higher xCoM than non-stimulated cells for the complete observation; 1 and 100 nM IL-8 showed partially significant differences (Supplemental Data).
The PMNs’ displacement along the y-axis was low without any significant differences between cases with CAs and CA-free cases (data not shown). The ratio of xCoM to yCoM for experi- ments without CAs was nearly 1. In contrast, all CAs – especially 10 nM FMLP and IL-8 – induced a greater shift along the x-axis than along the y-axis (ratio > 1, Table 1).
Parallel (xFMI) and perpendicular (yFMI)
Without CAs, the xFMI was constantly next to 0 (Supplemental Data). In contrast, all concentrations of FMLP caused an increase in the xFMI and a turn towards the stimulation origin (negative values).
After 30 min, 1 nM FMLP increased the xFMI, with a constant time course afterwards; 10 nM FMLP showed the highest scores of xFMI among all FMLP concentrations and a constant course, similar to 100 nM FMLP.
In the first half of the observation, 1 nM IL-8 increased the xFMI and showed a constant course afterwards. Stimulation with 10 and 100 nM IL-8 showed the highest scores of xFMI among all CAs;
10 nM IL-8 reached its maximum after 1 h, gradually declining afterwards. With 100 nM IL-8, the xFMI rose to a maximum of 0.72 (IQR 0.26) in the first 30 min, which declined over the rest of the observation.
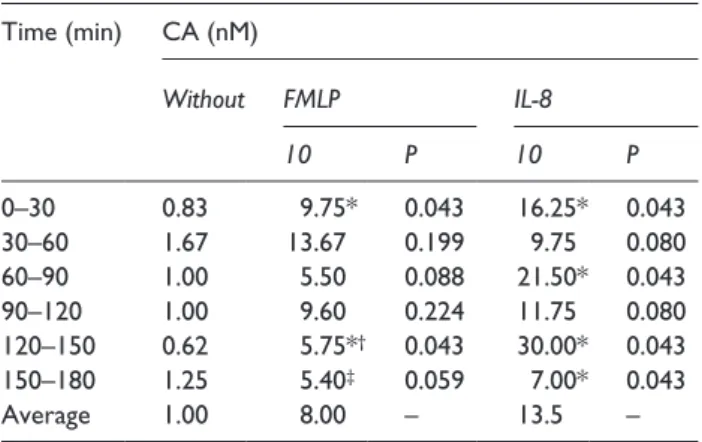
The yFMI was low and without any statistical difference between cases with CA and the CA-free cases (data not shown). The ratio of xFMI to yFMI was high (ratio > 1) for CA-experiments. In con- trast, experiments without CAs showed a ratio next to 1 (Table 2). Finally, the Rayleigh test for unstim- ulated cells did not show any difference (P > 0.05), whereas stimulation with IL-8 and with FMLP in all concentrations demonstrated a significant migra- tion along the x-axis (P < 0.05, data not shown).
Mean velocity
The PMNs’ mean velocity in cases without CAs declined during the observation period from 4.7 µm/min (IQR 2.0) to 2.8 µm/min (IQR 1.48).
Stimulation with FMLP demonstrated an increase in the mean velocity with continuous reduction over the time. Stimulation with 10 nM
FMLP (max. 11.60 µm/min, IQR 1.01) resulted in a higher velocity of the cells than stimulation with 100 nM FMLP (max. 10.15 µm/min, IQR 3.87).
Stimulation with 10 nM FMLP resulted in a signifi- cant higher velocity throughout the time compared to CA-free cases.
Consistent with the results regarding FMLP, stimulation with 10 nM IL-8 in average effectuated a higher velocity (max. 11.85 µm/min, IQR 3.47) than stimulation with 100 nM IL-8 (max. 11.89 µm/
min, IQR 3.72) – except for the observation time 30–60 min. Both concentrations increased the velocity of PMNs significantly for the complete observation compared to CA-free cases.
Directionality
The directionality of unstimulated PMNs was low, but steady (Supplemental Data). In contrast, all con- centrations of FMLP demonstrated high and steady values for the directionality parameter. Stimulation with 1 and 10 nM FMLP showed a greater direction- ality compared to 100 nM concentration.
Stimulation with IL-8 in all concentrations also demonstrated an increase in the directionality, but their values were more declining over the observa- tion time. IL-8 in 10 and 100 nM concentrations showed significant higher values for the direction- ality than non-stimulated PMNs for the complete observation.
Table 2. Ratio of x- to y-Forward-Migration Index.
Time (min) CA (nM)
Without FMLP IL-8
10 P 10 P
0–30 0.83 9.75* 0.043 16.25* 0.043
30–60 1.67 13.67 0.199 9.75 0.080
60–90 1.00 5.50 0.088 21.50* 0.043
90–120 1.00 9.60 0.224 11.75 0.080
120–150 0.62 5.75*
†0.043 30.00* 0.043
150–180 1.25 5.40
‡0.059 7.00* 0.043
Average 1.00 8.00 – 13.5 –
CA: chemoattractant; FMLP: n-formyl-l-methionyl-l-leucyl-l-phenylala- nine; IL-8: interleukin-8.
Ratios are displayed for CA-free cases and for FMLP and IL-8 in 10 nM concentration, because here the greatest effects were seen. P refers to the comparison of FMLP or IL-8 to CA-free cases.
*Value is significantly (P < 0.05) different from corresponding value in cases without CA.
†
A greater ratio was reached by 100 nM FMLP: 6.40, P = 0.043.
‡