July 2016
The Electoral Authoritarian’s Subtle Toolkit: Evidence from Singapore
Netina Tan
Bernard Grofman
Netina Tan, Bernard Grofman Title:
The Electoral Authoritarian’s Subtle Toolkit: Evidence from Singapore ISSN: 1605-8003
2016 Institut für Höhere Studien - Institute for Advanced Studies (IHS) Josefstädter Straße 39, A-1080 Wien
E-Mail: o ce@ihs.ac.atffi Web: ww w .ihs.ac. a t
All IHS Working Papers are available online: http://irihs. ihs. ac.at/view/ihs_series/
This paper is available for download without charge at:
https://irihs.ihs.ac.at/id/eprint/4020/
The Electoral Authoritarian’s Subtle Toolkit:
Evidence from Singapore
Netina Tan
1Department of Political Science McMaster University netina@mcmaster.ca
and
Bernard Grofman
2Department of Political Science And Center for the Study of Democracy
University of California, Irvine bgrofman@uci.edu
July 3, 2016
Words: 9,414 (including notes and references, but not including figures and tables)
Key Words: Electoral autocracy, apportionment, redistricting, electoral manipulation, seats- votes relationship, gerrymandering, partisan bias, electoral geography
1 Netina Tan is an Assistant Professor of Political Science at McMaster University. Her dissertation from the University of British Columbia, “Access to Power: Hegemonic Party Rule” in Singapore and Taiwan was awarded the 2011 Vincent Lemieux Prize for the best Ph.D. thesis submitted at a
Canadian institution. Her research interests include democratization, electoral authoritarianism, gender and governance in East and Southeast Asia.
2 Bernard Grofman is the Jack W. Peltason (Bren Foundation) Endowed Chair of Democracy Studies at the University of California, Irvine, He studies representation and electoral systems design and is a specialist on constituency boundary drawing (redistricting). His research on this paper was supported by the Peltason Chair and by the UCI Peltason Center for the Study of Democracy.
Introduction
This paper is driven by the puzzle of the legislative supermajority enjoyed by Singapore’s ruling People’s Action Party (PAP) over the last three decades well in excess of what we might expect from its vote share. The PAP has maintained a legislative seat share in excess of 95% despite a decline in average vote share: with an average vote share of only 65% since 1984, as compared to an average vote share of 74% from 1972-1980. In light of Singapore’s 2015 election, where the PAP continued its long string of electoral dominance, and made a substantial gain in vote share from the previous election, reversing a decline since 2001, an in-depth study on the partisan effects of electoral rules, malapportionment and
gerrymandering in Singapore is especially timely.
As Singapore is a classic electoral autocracy
3, previous work has emphasized how the PAP’s success may be attibuted to the suppression of electoral competition through well- known tools such as calibrated coercion (George, 2007), media censorship (George, 2012;
Rodan, 1998), campaign restrictions (Gomez, 2008; Tey, 2008) or use of libel or defamation suits (Jeyaretnam, 2012; Rajah, 2012; Tremewan, 1994). Authoritarian dominant parties can also enhance their electoral performance through limiting the franchise, selective
malapportionment, and electoral fraud (Donno, 2012; Gandhi & Przeworski, 2007; Sartori, 2005).
4But unlike other countries with a history of dominance by a single party or coalition, none of these latter manipulatory tools are found in use in Singapore. Singapore’s electoral districts, while malapportioned, unlike those in Malaysia,
5are not substantially
malapportioned to partisan ends. Singapore’s Chinese-dominated PAP has not sought to disenfranchise the minority Malay population, in the way that Ceylonese Sinhalese used the Citizenship Acts of 1948 and 1949 to disenfranchise the Indian Tamils (Rabushka &
Shepsle, 1972, p. 140). And, unlike most electoral autocracies, Singapore elections are not marred by ballot stuffing or overt electoral fraud, such as in Mexico under the Institutional Revolutionary Party (Magaloni, 2010). Indeed, according to Freedom House, Singapore elections are “free from irregularities and vote rigging” (2015).
6Scholars such as Barr has highlighted the importance of performance legitimacy as a reason for the PAP’s continued success, proposing that “an electorally legitimized
authoritarian regime can perpetuate itself in the long term, provided it delivers public goods to the population and is assiduous in responding to complaints” (2014, p. 29). However, while this explanation works to explain the PAP’s very high levels of vote support, it cannot explain how the PAP wins nearly ever seat. Rrather than seeking to explain (changes in) the PAP vote share, we limit ourselves to how, despite what seems to be a long term secular decline, that vote share continues to be successfully translated into complete party dominance at the level of seats.
3 See (Schedler, 2006). (Bellin, 2005; Case, 2006; Escribà-Folch, 2013)
4 In a hegemonic party regime, electoral fraud is rarely necessary to win elections. However, hegemonic parties may still wish to magnify their electoral success ((Daxecker, 2012; Lehoucq, 2003; Simpser, 2013)
5 Malaysia is a natural comparative case to Singapore (see Chin, 2013; Ostwald, 2013; Welsh, 2013).
6 The Bertelsmann Transformation Index (BTI) also characterizes Singapore elections as being free of fraud.
However, BTI’s report also emphasizes that “Despite the lack of fraud, elections cannot be considered free and fair.” (BTI, 2014)
Our explanation for this puzzle is based on the unduly neglected importance
7of
Singapore’s peculiar electoral system,
8the plurality party bloc voting rule used since 1988.
Our goal here is to highlight how the PAP has been able to make successful use of plurality PBV to maintain what is essentially monopoly control of the legislature by manipulating the average size of districts (district magnitude) in conjunction with a skilled strategic
manipulation of constituency boundaries. Plurality party bloc voting is one of a family of electoral rules, party bloc voting (PBV), where slates of candidates are pitted against each other in multiseat districts (MMDs), with the plurality or majority winning slate in each district automatically gaining all (or most of) the seats in the constituency.
9Our emphasis on the power of this electoral rule to affect outcomes thus adds to Schedler’s “menu of
manipulation” (2002) and also complements the list of eleven pre-election tools of misconduct identified in Figure 2 in Donno and Roussia (2012, p. 584).
It is well known that, in contrast to elections held using some form of proportional representation, plurality elections can magnify the seat share of the largest parties beyond their apparent voting strength ( Birch, 2007a; Blais & Carty, 1987; Lijphart & Grofman, 1984; Tufte, 1973), and can produce “artificial” legislative seat majorities. However, for a fixed geographic distribution of partisan electoral support, the expected degree of distortion varies with the form of the plurality rule.
10Ceteris paribus, the purely mechanical/statistical effects of plurality voting rules in exaggerating support for the party with the most votes is lower when plurality is used in single member constituencies than when plurality is used in multiseat constituencies.
11That is because, ceteris paribus, multiseat plurality can be expected to reduce the standard deviation of the vote distribution over that in comparable single seat plurality elections because the larger sized districts combine what would otherwise be single seat constitutencies, pushing the vote distribution acrross constituencies toward the mean, and making it less likely that there will be “outlier” districts where the overall plurality party is not the district winner.
However, this is not the only difference between single seat and multi-seat plurality contests.
While any plurality-based districting scheme can be manipulated via standard gerrymandering tools that operate to “waste” the opponent’s votes (e.g., packing, i.e., concentrating the opponent’s strength in handful of districts won by very large majorities, and cracking, i.e., dispersing much of the opponent’s remaining strength over a large number of districts where it has a substantial presence but not enough to win), a multiseat system has the additional wrinkle of allowing for the stacking form of gerrymander, in which pockets of opposition strength large enough to form the majority ina single seat are submerged by including them in a multiseat district together with areas of ruling party strength. Moreover, once we allow for district magnitudes of different sizes, this makes even more sophisticated stacking strategies possible under multiseat plurality than under single seat plurality.
7 For exceptions to this neglect, see (Hussin, 2002; N. Tan, 2013; Tey, 2008).
8 For a survey of the types of electoral rules used worldwide see Reynolds, Reilly, & Andrew (2008).
9 We use the terms ‘district’ and ‘constituency’ interchangeably in this paper.
10 Plurality is not the only method that can be used to exaggerate the strength of the largest party/larger parties. Some countries have bonus rules that give extra seats to the largest party (e.g. Greece) or to the largest coalition (e.g. Italy since 2006).
11 Birch’s work (2007a) has highlighted how a majoritarian electoral rule, the two-round ballot system, operating well in democracies such as France, can also be used to sustain electoral autocracies in power. Here, however, we will confine ourselves to plurality PBV in Singapore.
In the multiseat context there are two main forms of plurality voting. One is what in the U.S, is called plurality bloc voting, where voters vote for individual candidates but have as many votes as there are seats to be filled in the constituency, with the M candidates with the highest pluralities elected.
12The other is plurality PBV where voters have only a single vote.
Ceteris paribus, because voters under Plurality PBV have no choice but to either support a party slate fully or not at all,
13the magnifying effects of the voting rule on party success can be expected to higher under plurality PBV than under plurality bloc voting, though perhaps only marginally so.
When used in conjunction with standard gerrymandering tools such as packing and cracking, along with the stacking technique available when using multi-seat consitutencies, plurality PBV has allowed the PAP to be far more efficient in translating its votes into seats, than is the case for its opposition, especially when, as in previous decades, that opposition was divided. To demonstrate this, we later compare the success of the PAP under PBV with what could have been expected under a non-gerrymandered form of single seat plurality. We show that while the PAP’s striking vote support would have easily allowed it legislative dominance over the entire post-independence period, once there developed a more unified opposition, it could not have continued to achieve the levels of near 100% seat share it got without skillful manipulation of the distribution of district magnitudes and the use of tools of gerrymandering. We also demonstrate how the ethnic quota rule imposed by the PAP for public housing, in which more than 80% of resident Singaporeans live, has eliminated the potential for an ethnic-based party to win seats in plurality PBV elections via a
geographically concentrated base of electoral support.
14Parliamentary Elections in Singapore
There is no independent election commission in Singapore and control of the redistricting process is essentially political. Singapore’s Elections Department is under the Prime Minister (PM)’s office and the PM appoints an Electoral Boundaries Review Committee (EBRC) that redraws electoral boundaries before every election, without the need for Parliamentary approval.
15From 1965 to 1987, Singapore was spatially divided into single-member constituencies (SMCs) based on simple plurality. In 1988, the PAP government introduced multiseat districts, ostensibly to improve ethnic minority representation in the legislature. In 1988, an ethnic quota known as the Group Representation Scheme (GRC) was introduced, which required at least one ethnic minority candidate (Indian, Malay or mixed ethnicity) in each GRC. As earlier noted, Singapore’s GRCs use the plurality PBV rule, with each voter having a single vote to cast for a party list and the party with the most votes having its entire slate elected.
12 There is a variant of plurality bloc voting, plurality bloc voting with numbered places, where every voter still has as many individual votes to cast as there are seats to be filled, but candidacies are specified within distinct subdistricts (usually ones that are geographically defined).
13 We refer to the party ticket in a multiseat constituency using the plurality or majority voting forms of PBV as a slate, rather than as a list, since the names are not ordered, while in a party-list form of proportional representation (PR) the list of names is ordered.
14 Our study dovetails with Fetzer’s work to show how the ethnic desegregation divided Malay voters and potential ethnic-based opposition to the PAP (Fetzer, 2008).
15 See a study by Maruah, a local human rights group, on Singapore delimitation practices (2014).
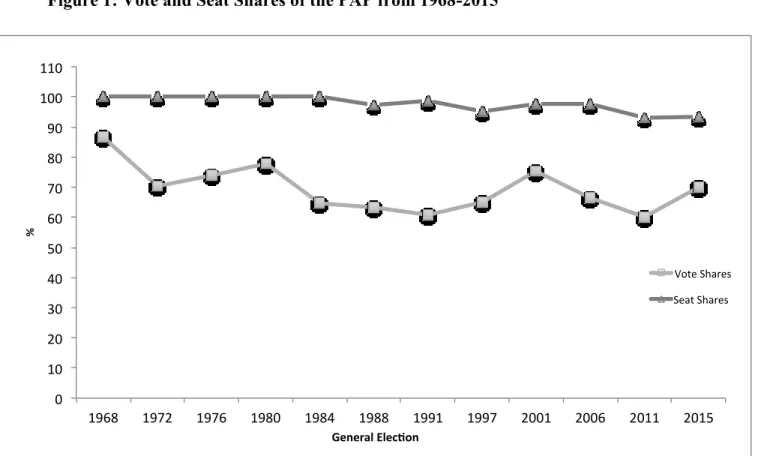
Figure 1 shows the PAP’s vote and seat shares. What this figure shows is that, regardless of the opposition vote share -- opposition vote shares have sometimes been close to one-third of the votes -- the PAP’s seat share has never fallen below 93%. In fact, from 1988 to 2015, after adopting the multiseat GRC scheme, the mean effective number of parties (Laakso &
Taagepera, 1979) in Parliament has been 1.05. This is, indeed, a hegemonic party!
Figure 1: Vote and Seat Shares of the PAP from 1968-2015
Source: Data from Singapore Elections Department website.
0 10 20 30 40 50 60 70 80 90 100 110
1968 1972 1976 1980 1984 1988 1991 1997 2001 2006 2011 2015
%
General Elec on
Vote Shares Seat Shares
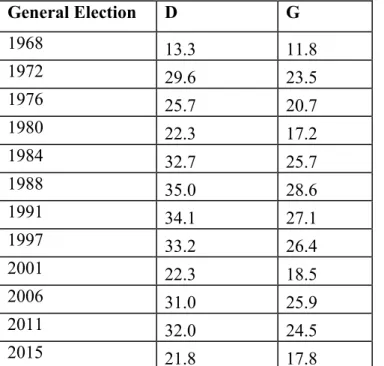
Table 1 shows the disproportionality for the PAP and the combined total opposition vote shares using the two standard indices in the electoral system literature, the Loosemore-Hanby Index of Distortion and the Gallagher Index (Gallagher, 1991). Singapore is characterized by an extraordinarily high level of disproportionality in its translation of votes to seats (N. Tan, 2013) In fact, it is one of the highest in Asia (Hicken, 2008).
Table 1: Loosemore-Hanby and Gallagher Indices of Disproportionality in Party Representation in Singapore
General Election D G
1968 13.3 11.8
1972 29.6 23.5
1976 25.7 20.7
1980 22.3 17.2
1984 32.7 25.7
1988 35.0 28.6
1991 34.1 27.1
1997 33.2 26.4
2001 22.3 18.5
2006 31.0 25.9
2011 32.0 24.5
2015 21.8 17.8
D: Loosemore-Hanby Index of Distortion (1971); G: Gallagher Index (Gallagher, 1991) Key Arguments
In the context of complete PAP control of the redistricting process, we highlight three explanatory factors that are linked to the use of multi-seat plurality PBV, focusing on the government’s strategically motivated changes in the rules that allowed the PAP to
compensate for declining vote share and to reduce the dangers to it of successful contestation by its opponents. We also discuss two other electoral features that are not specific to PBV, and we show the importance of one of these, and the limited importance of the other.
First, the imposition of a residential housing ethnic quota after the 1991 election work in conjunction with the PBV rule acted to prevent ethnic based parties from winning based on ethnic support. Second, while the choice of the PBV rule that involves multiseat districts,
“mechanically” advantaged the incumbent PAP to a considerable degree, as it is the largest party, this mechanical advantage was further augmented by careful strategic adjustment of the mean number of seats elected per district.
16Third, tools of partisan gerrymandering were skillfully deployed that can be more efficacious under plurality PBV with variable district magnitude than under any non-PBV rule.
16 See (N. Tan, 2012, p. Table 2)
Electoral secrecy is the fourth factor that is not directly tied to the use of plurality PBV.
Together, electoral secrecy, short notice of new constituency boundaries, and frequency of boundary changes work to disadvantage the opposition and make it hard for them to find candidates and organize their campaign. Given that the EBRC is under the PM’s control, we expect the PAP to know the future boundary lines well before they are publicly announced.
17Finally, we consider the effects of malapportionment. We have expected to find
malapportionment to aid the ruling party, as this powerful manipulatory tool is characteristics of many electoral autocracies where the ruling party controls the districting process, such as Malaysia (Ostwald, 2013). However, our study did not find strong pro-PAP effects due to malapportionment.
18Each of these mechanisms will be discussed in detail below.
Changing Ethnic Electoral Geography Through Ethnic Housing Quotas The PAP government’s justification for introducing the GRCs in 1988, with its
requirement of an ethnically mixed slate, was to limit ethnically polarized voting, and as a mechanism to ensure minority representation.
19In 1989, an ethnic housing quota was
imposed on all public housing (Ethnic Integration Policy, EIP) to prevent any ethnic minority group from exceeding 20% in any housing block or estate.
20Since about 80.4% of all housing in Singapore is owned by the state
21and all public housing is widely dispersed around the island, this ethnic housing quota means that ethnic minority groups such as the Malays and Indians will always constitute a minority in any constituency.
22While there are no official statistics on the ethnic demography of each constituency, estimates by one of the present authorsm based on the 2010 Singapore Census
Report(Statistics Singapore, 2011) and media reports on the selected constituencies before the 2011 elections, shows that ethnic minorities have been successfully distributed in most
electoral constituencies since the ethnic housing quotas were introduced. Presently, the Malay population in all SMCs and GRCs are within a narrow range. Our estimates drawn from public sources of the demographic breakdown of Singapore’s 2011 electoral constituencies show the range of Malay voters to be from 6% (Potong Pasir) to 23.4% (Tampines).
23This
17 In 2001 election, the EBRC report was released on 17 Oct, 3 weeks before polling day on 3 Nov.
18 For an earlier discussion see (E. Tan, 2010).
19 The use of ethnic quotas in Singapore is controversial since even in the pre GRC period, Malay representation in parliament was not that far below proportionality and the adoption of GRCS with plurality PBV was seen as politically motivated rather than motivated by a concern for ethnic integration.
20 Constraints on the minority population share in public housing project is implemented in many
democracies as a means to prevent racial segregation, see (Bagdon, 1985) For Singapore’s EIP, see (Sim, Yu, &
Han, 2003)
21 In 1960, the government owned 44% of the land. Now, about 80.4% of land is state owned. See (Department of Statistics Singapore, 2015a)
22 During the colonial period, Singapore’s housing was concentrated in ethnic-based districts. Between 1961- 84, the PAP government relocated Malay villagers from their traditional enclaves in Kampung Glam, Geylang Serai and Jalan Eunos to more urbanized areas as part of the country’s urban and housing redevelopment plans.
More than 230,000 households were resettled (Chua, 1997; Yuen, 2007). Archival history show that the resistance to the resettlement of Malays from the Malay villages to flats in the Geylang Serai contributed to the racial riot of 1964 (Blackburn, 2011; Lau, 1998).
23 Estimates of the ethnic demographic breakdown were extracted from 21 “On the Ground” Insight reports on 8 SMCs and 13 GRCs published in The Straits Times over the period from 30 Jul 2010 to 26 Nov 2010.
range approximates Malays’ national average of 13.3% (Department of Statistics Singapore, 2015b, p. 4). We believe the 2015 figures to be not much different.
Before the GRC and ethnic housing quota schemes were put in place, candidates from the PAP had difficulty winning seats in constituencies with a large Malay presence, such as in Kampong Kembangan and Geyland Serai, even when the PAP candidates were themselves of Malay descent. While the GRC scheme has successful ensured the legislative presence of ethnic minorities, it has greatly altered Singapore’s electoral geography -- dispersing all ethnic minorities through the ethnic housing quota and eliminating any credible challenge from a Malay based party such as the PKMS. Indeed, since 1997, no Malay candidate from the opposition parties -- and indeed no Malay candidate from the PAP itself -- has contested in any single seat constituency.
24Effects of Manipulating District Magnitudes
Perhaps the most direct way in which the PAP uses the tools available to it under plurality PBV to maintain its electoral dominance is through manipulation of the mean district
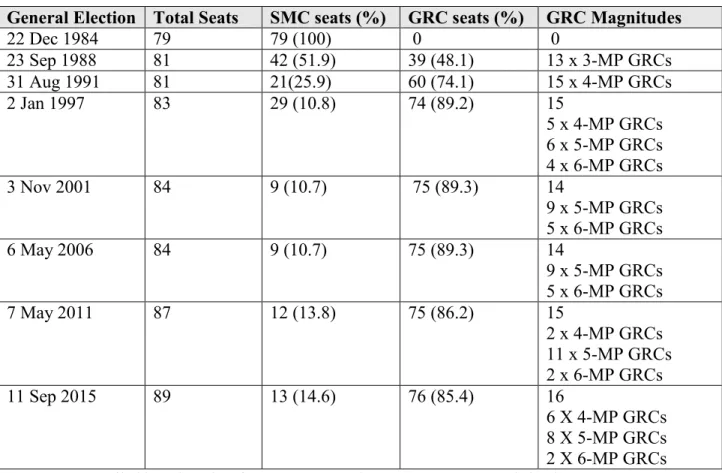
magnitude. Table 2 gives the district magnitude information for the period of 1988 to 2011.
There are two important time trends vis-a-vis Singapore’s district magnitude. First, the sizes of the multiseat constituencies were generally increasing: from three initially in 1988, to four in 1991, to a modal size of five in 1997, and later to five and six-member seats in 1997, although there was a return to 4 seat GRCs in 2015. Second, the proportion of the GRCs also increased, from zero percent in 1984 to a high of nearly 90% by 2006. In the 2015 election, there was, however, a slight reversal of this long run trend, although 76 out of the 89 constituencies were still GRCs (85.4%).
Prior to the 2011 election, the EBRC reduced the number of six-member GRCs from five to two, and oveerall decreased the average number of MPs per GRC from 5.4 to 5., while the SMCs increased from 9 to 12. Then Prime Minister Lee Hsien Loong said that the changes
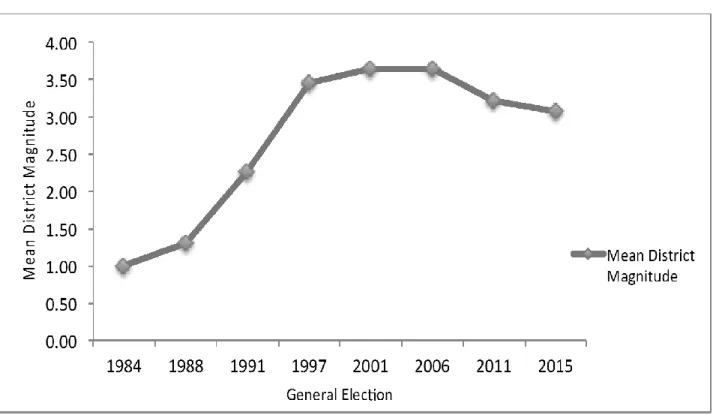
“should lower the hurdle for parties intending to contest the election”(Li, 2011) -- an implicit acknowledgement that the larger GRCs were an impediment to the opposition. The mean district magnitude was later reduced from 3.22 to 3.03 in the 2015 election. However, the two larger six-member GRCs were retained in 2015, despite earlier promise to reduce the larger GRCs.
25From 2001 to 2015, the mean district magnitude fell, from 3.65 to 3.03, but even this latter figure is still more than twice what district magnitude had been in 1991 (see Figure 2). The changes required by these shifts in district magnitudes meant that maps necessarily
24
For the first two decades after the GRC scheme with ethnic quotas was introduced in 1988, using PBV, no opposition party was able to capture a GRC. This changed in the 2011 election.
In the pre-GRC period, the opposition parties contested an average of 64% of the total seats. After the GRC scheme was introduced, the opposition was still combative, contesting 88% of all seats. However, after being roundly defeated, and faced with other mechanisms such as a high electoral deposit in the GRCs and ethnic housing quotas which deter ethnic-based mobilization, the opposition parties ended up contesting in an average of less than 46% of seats in four elections, from 1991 to 2006, i.e., more than half of parliamentary seats went to the PAP by default. The number of eligible voters who could not vote for the opposition as a result of uncontested seats rose from 13.1% in 1988 to a high of 66.9% by 2001. See (N. Tan, 2013) However, in the 2011 and 2015 elections, 95% and 100% of the seats, were contested by the opposition respectively.
25 Because these two six-member GRCs included as representatives, PM Lee Hsien Loong (Ang Mo Kio) and Deputy PM Teo Chee Hean (Pasir Ris-Punggol), the large constituencies may have been kept so as to allow inexperienced rookie PAP candidates to get elected on the coattails of party leaders.
changed considerably from one election to the next even without any major population shifts across districts.
Table 2: Distribution of SMCs and GRCs in Singapore (1984-2015)
General Election Total Seats SMC seats (%) GRC seats (%) GRC Magnitudes
22 Dec 1984 79 79 (100) 0 0
23 Sep 1988 81 42 (51.9) 39 (48.1) 13 x 3-MP GRCs
31 Aug 1991 81 21(25.9) 60 (74.1) 15 x 4-MP GRCs
2 Jan 1997 83 29 (10.8) 74 (89.2) 15
5 x 4-MP GRCs 6 x 5-MP GRCs 4 x 6-MP GRCs
3 Nov 2001 84 9 (10.7) 75 (89.3) 14
9 x 5-MP GRCs 5 x 6-MP GRCs
6 May 2006 84 9 (10.7) 75 (89.3) 14
9 x 5-MP GRCs 5 x 6-MP GRCs
7 May 2011 87 12 (13.8) 75 (86.2) 15
2 x 4-MP GRCs 11 x 5-MP GRCs 2 x 6-MP GRCs
11 Sep 2015 89 13 (14.6) 76 (85.4) 16
6 X 4-MP GRCs 8 X 5-MP GRCs 2 X 6-MP GRCs
Source: Compiled based on data from Singapore Elections Department website, here:http://www.eld.gov.sg/elections_past_parliamentary.html
Figure 2: Time Trend in Singapore: Mean District Magnitude from 1984-2015
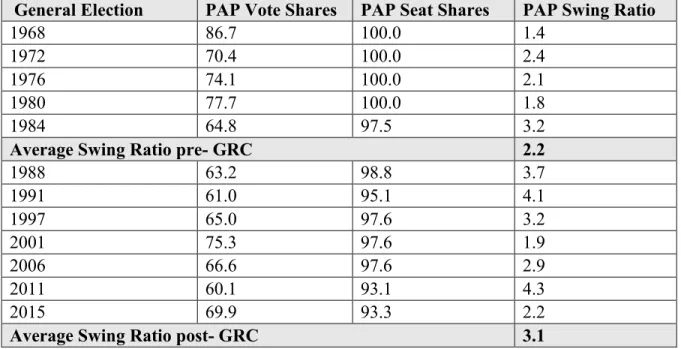
One way to understand seats-votes relationship is through parameters such as swing ratio and partisan bias (Tufte, 1974, Grofman, 1983). Because of lumpiness effects when dealing with electoral systems with a high proportion of multiseat constituencies, rather than
calculating hypothetical vaues of swing ratio and partisan bias for vote values at or near 50 percent, we insteand calculate a simplified version of the swing ratio, the aggregate level swing ratio
26and use it in conjunction with other information to make inferences about partisan bias.
In the pre-GRC period, the mean aggregate level swing ratio is 2.2; in the post-GRC period, the mean aggregate swing ratio is 3.1. This nearly 50% increase in aggregate level swing ratio means that, for any given vote share, the PAP’s seat share will be higher in the later periods. That is, even a lower vote share in the post-GRC period can yield the same seat share as a higher vote share in the pre-GRC period. While the exaggeration of vote share can be expected in any plurality system, as shown by the aggregate swing ratio of 2.2. during the period when Singapore only had single seat plurality elections, the exaggeration effect is much greater under the plurality PBV. For example, if the PAP earns 70% of the votes in the pre-GRC period, it can expect 94% of the seats, with a swing ratio of 2.2. But it could expect to do just as well with only 64% of the vote in the post-GRC period, since (64%-50%)*3.1 + 50% equals 93.4%. Thus, when the PAP’s vote share declines, it could, in principle,
compensate by raising district magnitude in a fashion that increases the aggregate swing ratio so as to maintain its legislative dominance. In Singapore, in fact, changes in the variance of
26 The aggregate level swing ratio for a party with a vote share (VS) at or above 50% is simply the ratio of seat share (SS) above 50% to vote share above 50%, i.e. swing ratio = 50%−𝑆𝑆50%−𝑉𝑆. However, this concept is really only meaningful for vote values near 50 percent.
the vote distribution across constitutions are taking place simultaneously with changes in district magnitude,with a correlation between district magnitude and the standard deviation of the vote distributiont of -.75.
27Table 3: Aggregate Level Calculations of Swing Ratio in Singapore, 1968-2015
General Election PAP Vote Shares PAP Seat Shares PAP Swing Ratio
1968 86.7 100.0 1.4
1972 70.4 100.0 2.4
1976 74.1 100.0 2.1
1980 77.7 100.0 1.8
1984 64.8 97.5 3.2
Average Swing Ratio pre- GRC 2.2
1988 63.2 98.8 3.7
1991 61.0 95.1 4.1
1997 65.0 97.6 3.2
2001 75.3 97.6 1.9
2006 66.6 97.6 2.9
2011 60.1 93.1 4.3
2015 69.9 93.3 2.2
Average Swing Ratio post- GRC 3.1
Source: Calculated based on data from Singapore Elections Department website, available here:
http://www.eld.gov.sg/elections_past_parliamentary.html
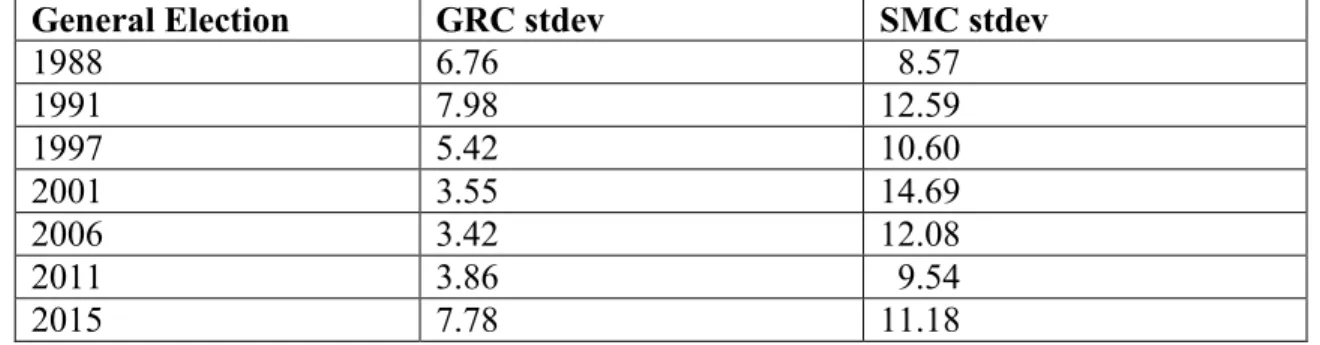
Becase the seat share of the PAP is virtually flat, with only a small (positive) relatioship to PAP vote share (r = .23), the usual way of investigating the relationship between votes and seats, namely via a regression of seat share on vote share is of limited value. A relatively straightforward way to check for the effects of effective PAP gerrymandering is to compare the outcomes we would expect to get in a single seat plurality election with the pattern we observe in Singapore. Table 4 shows that the standard deviation of the vote distribution across Singaporean constituencies is quite low compared to what we find in other parliaments
27A positive link between aggregate level swing ratio and mean district magnitude is what is theoretically expected for multiseat plurality systems. The effect of increasing district magnitude is analogous to the effects of increasing sample size in guaranteeing convergence to the true mean. Ceteris paribus, increasing district magnitude should make it ever more likely that the plurality party will capture all the seats (Grofman, Handley,
& Niemi, 1994). In the limit, in what in U.S. parlance is called an at-large plurality election, i.e., where there all the seats in the legislature are elected by simple plurality with each voter having as many votes as there are seats to be filled, the majority bloc can elect its chosen representatives to 100% of the seats. In effect, at-large elections gives rise to an aggregate level swing ratio of infinity. However, in Singapore the link between aggregate level swing ratio and mean district magnitude is actually negative over the 1988-2015 period (r =- .50), rather than positive. On the other hand, we expect a negative link between the variance of the vote distribution and the aggregate level swing ratio, since a low variance means that there are few outliers and so most districts will be won by the plurality party, yet in Singapore this link is positive (r=.21). The reason that we get these unexpected findings is, we believe, the effect of changes in PAP vote share on changes in aggregate level swing ratio, due to boundedness effects (see comments in text below).
that use some form of plurality rule. For example, in the U.S House of Representatives there are relatively few districts that are closely competitive, and there have often been 100 or more districts out of 435 that are completely uncontested, but with some held by Republicans and some by Democrats, suggesting that, taking all districts into account, the range of possible vote outcomes is quite substantial. Indeed, the standard deviation of vote share in the U.S.
House in 2014 was around 18 percentage points, far higher than what is reported for
Singapore in Table 4. At the same time as the PAP is increasing district magnitude it is also carefully crafting the new large districts to be relatively uniform in their (expected) vote share (i.e., with a low standard deviation of vote share across districts – see especially the data in Table 4 for the period 1997-2011), thus guaranteeing that the vote outcome in virtually all such districts will be near to the overall mean, and hence virtually guaranteeing that the PAP will win almost all seats when its vote share is 60 percent or higher.
Table 4: Standard Deviation of the PAP’s Vote Share in GRCs and SMCs, 1988-2011
General Election GRC stdev SMC stdev
1988 6.76 8.57
1991 7.98 12.59
1997 5.42 10.60
2001 3.55 14.69
2006 3.42 12.08
2011 3.86 9.54
2015 7.78 11.18
Source: Calculated based on data from Singapore Elections Department website, available here:
http://www.eld.gov.sg/elections_past_parliamentary.html Note: Uncontested elections are omitted.
We have already commented that Singapore now has aggregate level swing ratio values in excess of the values near two we see in most other single seat plurality systems with an effective number of two or fewer parties,
28and that the mean aggregate swing ratio in Singapore in the pre-GRC period was only 2.2. To see what this means for the ability of the PAP to translate its votes into seats we can calculate how much higher the PAP vote share was in actuality than what it would have achieved had the aggregate swing ratio been only 2.2. The mean gain for the PAP over the 1988-2015 period due to the higher than 2.2
aggregate swing ratio is 11.2 percentage points. That number is lower than it might otherwise be since there are two years, 2001 and 2015, where the very high values of PAP vote share set limits on maximum aggregate level swing that are below 2.2.
29When vote share is high, the fact that seat share is bounded at 100% means that there is also a bound on the size of the aggregate level swing ratio measure.
30When we recalculate the seat bonus for the PAP in using plurality PBV by excluding those two years in which it is mathematically impossible for our measure to show such a positive bonus, for the remaining five elections we find an
28 See e.g., Table 4 in Grofman (1975, p. 323).
29 PAP vote share is also a further confounding factor in the relationship between district magnitude , aggregate level swing ratio, and seat shares.
30 For example, if the vote share is 75%, the maximum possible aggregate level swing ratio is 2.
estimated seat share bonus for the PAP derived from its use of plurality PBV in conjunction with careful boundary drawing of 17.4 percentage points.
Now we turn from aggregate level analyses to a more district specific approach.
Specific Electoral Boundary Manipulation
Birch’s(2007a) cross-national study shows that SMD elections held under plurality or majority rule are more likely to be the object of boundary manipulation for partisan purposes than MMD elections held under proportional representation. However, Singapore’s mix of single and multiseat plurality, with variable district magnitude, offers even more
opportunities for partisan manipulation of district boundaries than in single-seat districting, especially when the manipulation of electoral boundaries is done in conjunction with the kinds of district magnitude change reported in Figure 2.
31As we have argued, the changes in district magnitude can exaggerate PAP’s voting strength through the mechanical effect on swing ratio of increasing district magnitude. But gerrymandering to affect the distribution of opposition electoral strength can further reduce the opposition’s ability to gain representation. Some districts can be dissolved and other districts can be redrawn to more efficiently distribute PAP voting strength. Usually this recrafting results in the form of shoring up weak districts or paring down PAP strength in safe districts, but gerrymandering can also occur by ceding certain districts to the opposition in a way that will waste opposition votes.
32Unless GRCs are being conceded to the opposition, it is generally more important for the PAP to limit variance in the GRCs than in the SMCs, i.e., to win all GRCS with similar vote share, as there are more seats at stake in the GRCs. As Table 4 shows, the standard deviation of PAP support has generally been lower in the GRC component of the election than in the SMC component.
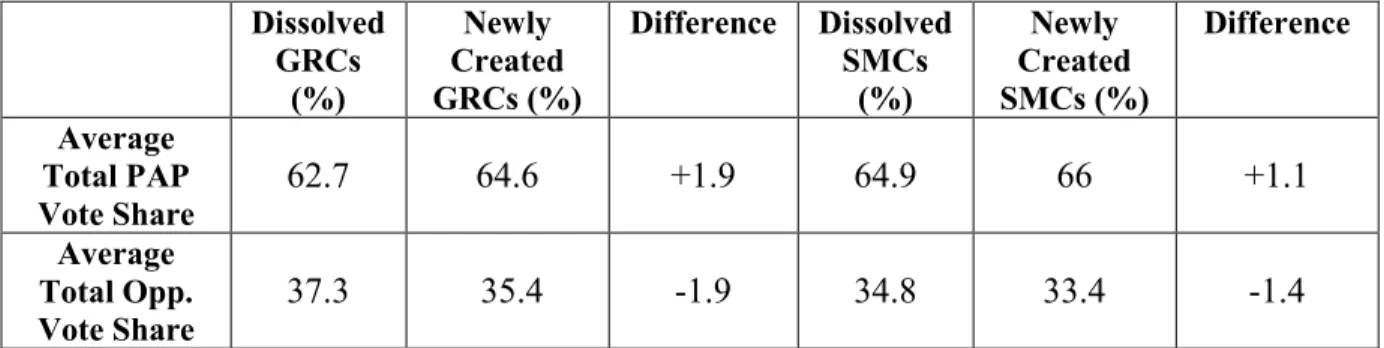
33Since 1988, most SMDs with over 40% oppositional voting have disappeared or been submerged into GRCs (e.g. Braddell Heights, Bukit Batok, Changi, Nee Soon South, Ulu Pandan and Yuhua after 1991; Bukit Panjang, Fengshan, Paya Lebar, Punggol and Whampoa after 1988). Similarly, the GRCs with more than 40% oppositional support have been
dissolved or reshaped (e.g. Moulmein-Kallang after 2011; Cheng San after 1997; Eunos after 1991 and Tiong Bahru after 1988). Between 1988 and 2015, we find, on average, the PAP had a 64.9% vote share in the dissolved SMCs, a value below the mean PAP SMC
31 Gerrymandering also existed in the pre-GRC period when Singapore had only SMD elections under plurality rule, but the focus was on minimizing the impact of Malay enclaves (Rahim, 2008, p. 109).
32In 1991, Kampong Glam SMD was mysteriously dissolved, revived in 1996 and dissolved again in 2001.
Likewise, Bukit Timah SMC also underwent several boundary changes. It was first merged into a GRC in 1997, then recrafted as an SMD in the 2001 election and reconfigured into another Holland-Bukit Timah GRC in 2006. When comparing the vote share results of these constituencies over the different time periods, the PAP’s vote share in Kampong Glam improved from 67% to 76% for 1997 after boundary changes, while Bukit Timah was uncontested by the opposition for three elections (1997, 2001 and 2006) after boundary changes.
33 There may be portions of the country where a ruling party is advantaged by drawing MMDs and winning seats by the stacking form of gerrymandering, and other areas where it is advantaged by drawing SMDs into which it can pack the opposition. In general, if a party can control the line drawing process, and it has the potential to vary district magnitude, ceteris paribus, it will prefer a mix of SMDs and MMDs, but the balance of MMDs and SMDs will vary with the electoral geography. As a dominant party begins to lose support, after a certain point, the attractiveness of concentrating opposition strength in a few districts ceded to the opposition rises, but until then, increasing district magnitude while choosing geography so as to reduce the variance of the expected vote distribution across districts will usually be the more efficacious strategy.
performance. Similarly, the PAP had a lower vote share in the dissolved GRCs than in other GRCs. See Table 5. In the 2015 redistricting, the most controversial boundary change was the elimination of Joo Chiat SMC, a district that was hotly contested by the opposition Worker’s Party (WP) candidate, Yee Jenn Jong. In the 2011 election. Yee, lost narrowly, by 1% to his PAP opponent. Joo Chia SMC was subsequently absorbed into Marine Parade GRC in the 2015 election and the PAP won 64.1% vote share in the new district.
34Table 5: Average Vote Shares of the PAP and Opposition Parties in All Newly Created Constituencies and Dissolved Constituencies since 1988 to 2015
Dissolved GRCs
(%)
Newly Created GRCs (%)
Difference Dissolved SMCs
(%)
Newly Created SMCs (%)
Difference
Average Total PAP
Vote Share
62.7 64.6 +1.9 64.9 66 +1.1
Average Total Opp.
Vote Share
37.3 35.4 -1.9 34.8 33.4 -1.4
Source: Calculated based on data from Singapore Elections Department website, available here:
http://www.eld.gov.sg/elections_past_parliamentary.html
On the other hand, the dissolution of pro-PAP Kampong Glam SMC (after 1997) and Buona Vista and Mountbatten SMCs (after 1991) probably occurred because, at 75%, 79.5%
and 78% PAP vote shares respectively, they were already far above the mean vote share of 63% average over the two elections. The PAP may have felt it desirable to redistribute their vote strength to shore up other constituencies. Similarly, SMCs such as Kebun Baru (75.4%), Serangoon Gardens (74%) and Teck Ghee (79%) were most likely dissolved after 1988 for the same reason, as they exceeded the PAP’s average vote share of 63% for that year.
Prior to the 2011 elections, eight additional SMCs were created.
35Configuration of three new SMCs (Radin Mas, Yuhua and Sengkang West) and one older SMC (Bukit Panjang) look most suspicious, as they are crafted literally inside or or on the edges of the respective PAP GRC strongholds of Tanjong Pagar, Holland-Bukit Timah and Chua Chu Kang. It is hard to imagine a rationale for creating a SMC inside a GRC other than the PAP’s wish to assuage the mass demand for more SMCs without actually affecting its own seat winning abilities. The three single-member seats in 2011 created within the existing GRCs now enjoyed above average PAP vote share.
In 2015 elections, three new SMCs were added.
36Two of these SMCs (Bukit Batok and Macpherson) were created on the edges of the PAP strongholds whose candidates included
34 Expressing his disappointment with the EBRC report on his Facebook post, Yee lamented that: “[T]here is no clear justification for the changes. With the eraser and the pencil, the mighty committee has made the Joo Chiat SMC with such a rich and unique tradition disappear.” Joo Chiat was an SMC from 1959-1988 and also for the last three general elections since 2001(Kek, 2015).
35 They are Hong Kah North, Mountbatten, Pioneer, Punggol East, Radin Mas, Sengkang West, Whampoa and Yuhua.
36 They are Bukit Batok, Fengshan and Macpherson SMCs.
heavy-weight PAP Cabinet Ministers in Jurong and Marine Parade GRCs. See Figure 3 for the 2011 and the 2015 electoral maps.
Figures 3 and 4: Maps of Singapore Electoral Districts in 2011 and 2015
Source: (Hussain, 2015)
Electoral Secrecy
While the effects of electoral secrecy are largely independent of the voting rule used, electoral secrecy effects are exacerbated by the plurality PVB used in Singapore, because the arbitrary manipulation of the constituency sizes and boundaries raise electoral uncertainties, and the timing of public release of information about new lines makes it harder for the opposition to plan campaigns and identify suitable candidates in advance of the new elections. These effects are further exacerbated by the frequency of redistricting.
By the 1996 elections, 42 SMCs in existence in 1988 were whittled down to just 9 SMCs.
In the 2006 elections, the boundaries of 11 out of 23 constituencies were changed. Prior to the 2011 elections, 16 out of 27 constituencies were redrawn, affecting more than 30% of all voters (N. Tan, 2012, p. 5). In the 2015 elections, parliamentary seats were increased from 87 to 89 and electoral constituencies were raised from 27 to 29, with many districts changed in configuration. In particular, a SMC and a GRC were dissolved, while three SMCs and one new four-member GRC were created. These changes are carried out unilaterally by the EBRC without consultation or accountability to the Parliament or political parties.
Not only is the EBRC not independent, its actions also lack transparency (ACE Electoral Knowledge, 2012). For example, in the 2011 election boundary report, only one paragraph was given to explain why the boundary changes were made. In fact, the explanation that the boundary changes were made to reflect the “configurations and population changes since the last boundary delineation exercise [in 2006]” was so non-specific, it is basically useless (see Li, 2010). Similarly, in 2015, no explanation was given to the dissolution of Joo Chiat SMC, a seat that was hotly contested by the opposition WP in 2011, nor was an explanation given to the elimination of Moulmein-Kallang GRC from the electoral map, or why three new SMCs (Bukit Batok, Fengshan or Macpherson) were created (EBRC, 2015) Over the years, the opaque redistricting process has led to frequent complaints by the opposition.
37Malapportionment
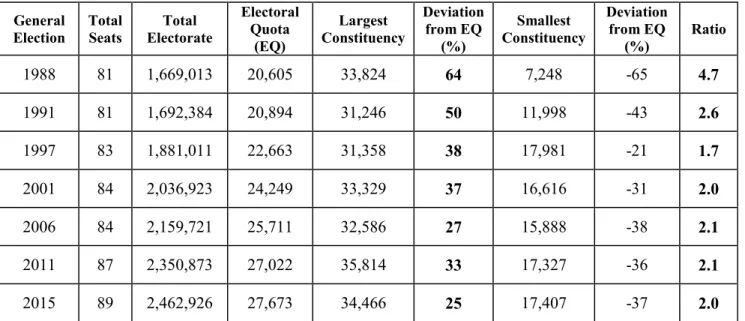
The wide variation in registrants per seat in Singapore is another well-known problem (N.
Tan, 2013, 2016). See Table 6. The plus or minus 30% from ideal used in Singapore provides great room for manipulation. If the largest district is 130% of ideal and the smallest district is 70% of ideal, then the largest district can be nearly twice as large as the smallest (130/70 = 1.86). In contrast, with a plus or minus 5% legal limitation, as in U.S. legislative districting, the worst-case scenario is 105/95 = 1.11. Moreover, in nearly all U.S. state legislatures, the actual range ratio is well under 1.11.
3837 See complaint of gerrymandering by WP leader Sylvia Lim in Parliament (Lim, 2010).
38 In the U.S., a plus or minus 5% only applies to state legislatures, while, an “as close to zero deviation as practicable” applies to Congressional redistricting (Grofman, 1985).
Table 6: Distribution of SMC and GRC Seats (1984-2015)
General
Election Total
Seats Total Electorate
Electoral Quota
(EQ)
Largest Constituency
Deviation from EQ
(%)
Smallest Constituency
Deviation from EQ
(%)
Ratio
1988 81 1,669,013 20,605 33,824 64 7,248 -65 4.7
1991 81 1,692,384 20,894 31,246 50 11,998 -43 2.6
1997 83 1,881,011 22,663 31,358 38 17,981 -21 1.7
2001 84 2,036,923 24,249 33,329 37 16,616 -31 2.0
2006 84 2,159,721 25,711 32,586 27 15,888 -38 2.1
2011 87 2,350,873 27,022 35,814 33 17,327 -36 2.1
2015 89 2,462,926 27,673 34,466 25 17,407 -37 2.0
Source: Calculated based on data from Singapore Elections Department website, available here:
http://www.eld.gov.sg/elections_past_parliamentary.html
As Table 6 shows, the ratios of largest to smallest districts are at their maximum, or even fractionally higher than is technically allowable, giving rise to considerable variance in per capita representation. Given the lack of an independent election commission, there is great potential for malapportionment to be used by the PAP as a partisan tool, but whether it actually does so is an empirical question.
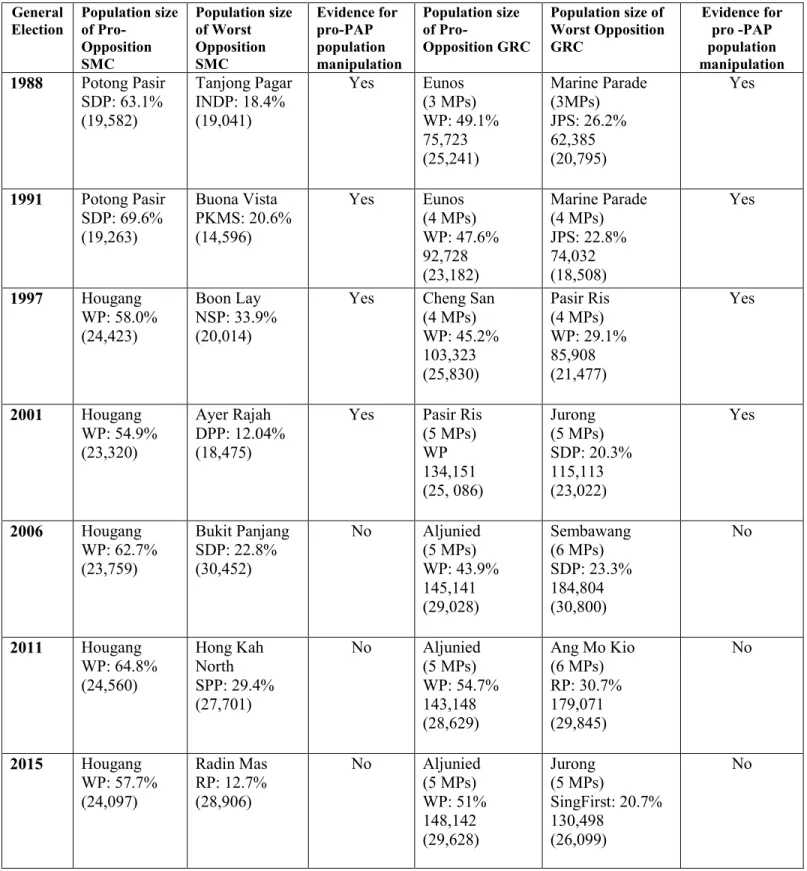
One way to assess for malapportionment is to compare the population sizes in PAP
strongholds with the population size in opposition strongholds. If malapportionment is used
for partisan gains, then we should expect to see a pattern in which the PAP strongholds are
underpopulated and pro-opposition strongholds are overpopulated. However, our study of the
population sizes of pro-PAP and pro-opposition constituencies shows mixed results. Table 7
shows little evidence of an overall pattern. In the four earliest elections, there were some
differences in pro-opposition and PAP strongholds in a direction consistent with the
hypothesis of malapportionment being used for partisan ends. But in 2006, 2011 and 2015
elections, the population discrepancies are in favor of the opposition, i.e. it is opposition
strongholds that are underpopulated.
Table 7: Population Size of Best and Worst Opposition Districts in Singapore
General
Election Population size of Pro-
Opposition SMC
Population size of Worst Opposition SMC
Evidence for pro-PAP population manipulation
Population size of Pro-
Opposition GRC
Population size of Worst Opposition GRC
Evidence for pro -PAP population manipulation 1988 Potong Pasir
SDP: 63.1%
(19,582)
Tanjong Pagar INDP: 18.4%
(19,041)
Yes Eunos
(3 MPs) WP: 49.1%
75,723 (25,241)
Marine Parade (3MPs)
JPS: 26.2%
62,385 (20,795)
Yes
1991 Potong Pasir SDP: 69.6%
(19,263)
Buona Vista PKMS: 20.6%
(14,596)
Yes Eunos
(4 MPs) WP: 47.6%
92,728 (23,182)
Marine Parade (4 MPs)
JPS: 22.8%
74,032 (18,508)
Yes
1997 Hougang WP: 58.0%
(24,423)
Boon Lay NSP: 33.9%
(20,014)
Yes Cheng San (4 MPs) WP: 45.2%
103,323 (25,830)
Pasir Ris (4 MPs) WP: 29.1%
85,908 (21,477)
Yes
2001 Hougang WP: 54.9%
(23,320)
Ayer Rajah DPP: 12.04%
(18,475)
Yes Pasir Ris (5 MPs) WP 134,151 (25, 086)
Jurong (5 MPs) SDP: 20.3%
115,113 (23,022)
Yes
2006 Hougang WP: 62.7%
(23,759)
Bukit Panjang SDP: 22.8%
(30,452)
No Aljunied (5 MPs) WP: 43.9%
145,141 (29,028)
Sembawang (6 MPs) SDP: 23.3%
184,804 (30,800)
No
2011 Hougang WP: 64.8%
(24,560)
Hong Kah North SPP: 29.4%
(27,701)
No Aljunied (5 MPs) WP: 54.7%
143,148 (28,629)
Ang Mo Kio (6 MPs) RP: 30.7%
179,071 (29,845)
No
2015 Hougang WP: 57.7%
(24,097)
Radin Mas RP: 12.7%
(28,906)
No Aljunied (5 MPs) WP: 51%
148,142 (29,628)
Jurong (5 MPs)
SingFirst: 20.7%
130,498 (26,099)
No
Source: Calculated based on data from Singapore Elections Department website available here:
http://www.eld.gov.sg/elections_past_parliamentary.html
NOTE: Numbers in bracket is the mean population per representative of GRCs
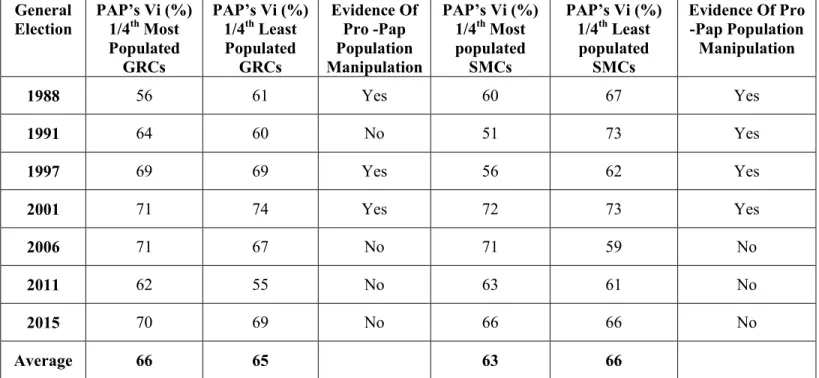
Another way to assess for malapportionment is to examine whether the average PAP vote share in the under-populated constituencies (1/4
thof the total) is higher than those in the over- populated ones (1/4
thof the total). As Table 8 shows, in the two earlier elections (1988-1991), the PAP does show a few higher points in vote share in the most under-populated GRCs and SMCs than in the most over-populated ones, but no such pattern is found in the subsequent elections (2006-2015).
Table 8: The PAP’s Average Vote Share in (1/4
th) Most and (1/4
th) Least Populated Constituencies (%)
General Election
PAP’s Vi (%) 1/4th Most Populated
GRCs
PAP’s Vi (%) 1/4th Least Populated
GRCs
Evidence Of Pro -Pap Population Manipulation
PAP’s Vi (%) 1/4th Most populated
SMCs
PAP’s Vi (%) 1/4th Least
populated SMCs
Evidence Of Pro -Pap Population Manipulation
1988 56 61 Yes 60 67 Yes
1991 64 60 No 51 73 Yes
1997 69 69 Yes 56 62 Yes
2001 71 74 Yes 72 73 Yes
2006 71 67 No 71 59 No
2011 62 55 No 63 61 No
2015 70 69 No 66 66 No
Average 66 65 63 66
Source: Calculated based on data from Singapore Elections Department website, available here:
http://www.eld.gov.sg/elections_past_parliamentary.html
On balance, we find no clear evidence for use of malapportionment as a partisan tool.
Conclusion: Electoral Rules and Gerrymandering to Preserve Dominant Parties This study on Singapore offers insights into the specific mechanisms that allow sophisticated dominant parties such as the PAP to maintain a legislative supermajority, and also into other features of electoral authoritarianism. First and most importantly, Singapore’s case shows how the manipulation of electoral laws that may appear neutral, e.g., choice of a plurality based voting rule and choice of mean district magnitude under that rule, can result from strategic choices aimed at clear partisan advantage (Benoit, 2007; Birch, 2007b). As one of the reviewers of an earlier version of this paper aptly put it: “[E]lectoral system
manipulation is less salient to the public because it is not outright blatant fraud (vote-buying
or ballot stuffing) that impinges on the principle of one-man-one-vote. Electoral systems
operate on the more difficult-to-understand question of how to legitimately convert votes into
seats.”
Second, while an electoral system is expected to have “mechanical effects,” even if there is no deliberate partisan manipulation, these effects can be exaggerated when there is selective manipulation of district boundaries. As demonstrated above, the fragmenting of the opposition strength and submerging its strength via stacking in the multimember
constituencies is one of the PAP’s key techniques. Where the opposition showed strength, the boundaries and sizes of the GRCs were changed to submerge that opposition. Also,
sometimes, the PAP also concedes “token” districts (e.g. Potong Pasir, Hougang and Aljunied) to the opposition, to enhance the PAP’s democratic legitimacy. As we noted earlier, if the PAP vote share declines in the future, this becomes a more attractive tactic for them.
Third, who controls the redistricting process is also critical if we want to understand the effects of electoral rules.
39Without an opposition check in the Parliament and without an independent election commission, the unilateral changes in boundaries can have substantial partisan effects.
Fourth, no electoral rule works in a vacuum. Singapore’s case shows how the potential for manipulation is closely linked to the geographic distribution of electoral support. In Singapore the PAP has successfully manipulated this distribution through the ethnic housing quotas to prevent the success of a Malay-based opposition party.
40Fifth, the analysis of patterns in Singapore reinforces the claim derived from the study of other authoritarian regimes that major electoral changes are most likely to occur when the ruling party faces challenge (McElwain, 2008; Remmer, 2008). In 1984, the election before the GRC scheme was introduced, ethnic minority candidates were competitive, with more than nine minority candidates from the WP and PKMS, earning more than a 35% vote shares.
Taken in conjunction, the GRC scheme in 1988 and the ethnic housing quota in 1989 may be seen to repress the electoral effects of rising support for the opposition’s ethnic minority leaders.
Looking to the Future
Given the patriotic fervor in 2015 that responded to Lee Kuan Yew’s death and a celebration of the nation’s rise to independence the PAP increased its vote share to 69% in the 2015 general elections. We believe this is a temporary blip in a longer term pattern of PAP vote decline. Also, if the economy continues to slow, this is likely to affect the Chinese working class and reduce the PAP’s claims to performance legitimacy based on economic growth. The ethnic housing quotas has been useful in neutralizing the potential for a Malay- based opposition party. However, this does not protect the PAP from an opposition that comes from the Chinese majority communities, as seen in the Aljunied and Hougang constituencies.
The PAP has not yet exhausted all the potential for using redistricting to increase its seats to votes ratio. It has also preserved the strategy of having a limited number of “Potemkin Villages” won or closely contested by the opposition to buttress the claim that Singapore is a
39 We know, from the U.S. literature on gerrymandering that, when partisan control of the redistricting process changes, there can be substantial changes in partisan composition attributable directly to the changes in boundaries (McGann, Smith, Latner, & Keena, 2016).
40 Our work also contributes to the study of the complex interaction between electoral system and electoral geography (Bochsler, 2010a; cf. Gudgin and Taylor 1974; R. J. Johnston, Shelley, and Taylor 1990; R. Johnston 2002).
competitive electoral democracy. In particular, we may see more SMCs or smaller GRCs created to siphon off opposition strength with the least cost to the PAP (also see Driscoll, 2016). We saw this being done in Bukit Panjang SMC (within Holland-Bukit Timah GRC);
Yuhua SMC (within Jurong GRC) and Pioneer SMC (within West Coast GRC). See Figure 3.
Such a strategy appeases the masses’ demand for more SMCs and at the same time
concentrates the opposition forces to minimize the number of seats that they could win.
41In the 2011 elections, if all the GRC seats were to be distributed based on the most common list PR rule (D’Hondt) (Reynolds, Reilly, & Andrew, 2008), then, ceteris paribus, the opposition would have won 27 seats out of 75 (36%) instead of the only 5 seats (7%) that they won under the PBV rule. In 2015, when the PAP gained in votes, the opposition would have won 20 seats out of 76 (26%) under PR instead of 5 (7%). However, had the opposition parties been successful to that degree, then their ability to recruit good candidates and mount effective candidates would also have gone up. Given that a PR system would guarantee minority gains (Blais & Carty, 1987) there is no reason to believe that the PAP leadership, which has consistently rejected proposals for a PR system, or a mix of PR and plurality SMDs, will change its mind in the foreseeable future.
42To our knowledge, party bloc voting in the plurality party bloc voting form and in its other variants, has only been used in authoritarian and semi-authoritarian systems. For example, some form of PBV is currently in use in in Chad, Djibouti, Cameroon and Senegal,
43and it has been used in the past under authoritarian regimes such as pre- Erdogan Turkey, Portugal under Salazar, and pre Arab-Spring Tunisia. In our view, the plurality PBV rule used in Singapore, and the PBV variants that are currently used in Chad, Djibouti, Cameroon and Senegal, ought to be regarded as among the most undesirable electoral rules in the world from a democracy standpoint, truly the “authoritarian’s friend.”
41 Aljunied is a natural candidate for such a shift if it is possible to concentrate opposition forces within the present 5 seat district into a smaller district. However, Deputy Prime Minister Teo argued the 2015 redistricting was fair because Aljunied GRC, which was won by the opposition in 2011, was left untouched. (Teng, 2015) That observation suggests the PAP may be reluctant to ticker with Aljunied because it is a district that “proves”
that Singaporean elections are more than shams.
42 The PAP leaders claim they reject PR because “it would encourage race politics.” ((Wong, 2013))
43Except possibly for Senegal, whose rating has varied over the time period of PBV use, all of the countries that use or used PBV in one of its variants may be regarded as an electoral authoritarian regime based on Schedler’s definition in (2002) and classified “Partly free” or “Unfree” by Freedom House. Plurality PBV was used in Turkey, for four national elections from 1946 to 1957. PBV variants have also been used in pre-Arab Spring Tunisia and in Salazar’s Portugal. (We thank Esra Issever Ekinci for bringing the latter historical example to our attention.) Because of space limitations, and the variation in ethnic compositions and in the operational details of the PBV system used in the African cases (Cameroon, Chad and Senegal, like Singapore, have a mix of SMD and MMDs, while Djibouti only has MMDs) we reserve to future work (in conjunction with an expert on African elections) a full discussion of these cases. In all the cases known to us PBV has resulted in high disproportionality in favor of the ruling party.