Report No. 38
South Asia Human Development Sector
Determinants of Fertility,
Women's Health and Employment Behavior in Sri Lanka
October 2012
Discussion Paper Series
Public Disclosure AuthorizedPublic Disclosure AuthorizedPublic Disclosure AuthorizedPublic Disclosure Authorized
74169
Report No. 38
South Asia: Human Development Unit
Determinants of Fertility,
W
omen's Health and Employment Behaviour in Sri LankaOctober 2012
Discussion Paper Series
Discussion Papers are published to communicate the results of the World Bank’s work to the development community with the least possible delay. The typescript manuscript of this paper therefore has not been prepared in accordance with the procedures appropriate to the formally edited texts. Some sources cited in the paper may be informal documents that are not readily available.
The findings, interpretations, and conclusions expressed herein do not necessarily reflect the views of the International Bank for Reconstruction and Development / The World Bank and its affiliated organizations, or those of the Executive Directors of the World Bank or the government they represent.
The World Bank does not guarantee the accuracy of the data included in this work. The
boundaries, colors, denominations, and other information shown on any map in this work do not
imply any judgment on the part of the World Bank concerning the legal status of any territory or
the endorsement or acceptance of such boundaries.
iii
Contents
Acknowledgements ... v
List of Acronyms ... vi
Introduction ... 1
Characteristics of the data used... 2
Fertility trends ... 4
Proximate determinants of fertility in Sri Lanka ... 6
Marriage and fertility preferences ... 6
Number of children ever-born ... 6
Birth intervals (for those women with 2 or more births, in months) ... 9
Contraception - knowledge and ever-utilization ... 12
Socioeconomic and cultural factors influencing fertility ... 14
Females’ nutritional status ... 14
Note: Currently pregnant women and women who gave birth in the last 2 months preceding the survey are excluded from this analysis... 17
Information on health and barriers to treatment ... 17
Health insurance ... 18
Women’s empowerment and decision making ... 19
Work ... 20
Source: DHS 2006/07. World Bank staff calculations+ ... 24
Decisions about earnings ... 24
Nutritional status of children ... 24
Key Findings ... 28
Tables
Table 1: Characteristics of women of reproductive age, 2006-07. ... 2Table 2: Fertility rates, South Asian countries. ... 4
Table 3: Probability of ever giving birth (ever-married women 15-49 year olds) – marginal effects from a Probit model. ... 8
Table 4: Multivariate analysis of birth intervals – results from an OLS ... 11
Table 5: Multivariate analysis of women’s BMI – results from an OLS ... 16
Table 6: Probability of working (ever-married women 15-49 year olds) – marginal effects from a Probit model ... 23
Table 7: Nutritional status of children under five years old - what happened since 2000? ... 25
Table 8: Nutritional status of children under five years old, by age groups ... 26
Table 9: Nutritional status of children – marginal effects from a Probit model results (0-59 months old) 27 Table 10: Review of wealth differentials for various indicators ... 32
Figures
Figure 1: Total fertility rate and average number of children ... 5Figure 2: Number of children ever-born, 2006/07 ... 7
Figure 3: Birth interval for women with two or more children, 2006/07 (in months) ... 9
Figure 4: Women’s nutritional status, 2006/07 ... 14
Figure 5: Working status of ever-married women 15-49 year olds, 2006/07 ... 21
iv
Authors
Stefania Rodica Cnobloch
v
Acknowledgements
The author acknowledges the comments and suggestions by Cem Mete (Lead Economist, World
Bank) and Denis Nikitin (Consultant, World Bank).
vi
List of Acronyms
BMI Body Mass Index
CEB Children Ever Born
DHS Demographic and Health Survey
NCDs Non-Communicable Diseases
TFR Total Fertility Rate
1
Introduction
There is now a consensus view that challenges in social protection are deeply rooted in demographic dynamics, particularly population ageing and family formation and dissolution, while social vulnerabilities are strongly connected to the combined effects of age, gender and family composition.
1Changes in partnership, fertility, mortality, and ageing have important implications for social protection in both its scope (e.g., coverage) and commitment to specific aspects. The number of single person households and one-parent families, mean age at first birth and average age of childbearing, fertility levels, changing gender roles regarding the family, the parenthood-work nexus, life expectancy at birth, and ageing are only some of the demographic issues to be accounted for in policy making. Some of these are chances and choices of individuals, which many times find themselves being faced with overlapping problems. It is therefore essential to use demographic profiling as an early warning system in order to identify households and individuals who will be at risk of social exclusion, and further identify the best policies to address them.
Since the Government acknowledged that easily accessible adequate health services is a small price to pay for having a healthy and economically active nation and started implementing health reforms in the 1930s, overall mortality and infant mortality rates fell and life expectancy has continuously risen in Sri Lanka. Population grew rapidly until 1970s, after which fertility rates began to drop, the total fertility rate (TFR) falling by 2000 at 1.9 children per woman of reproductive age, below the replacement level. Since then though, the TFR has increased again to an above replacement-level of 2.3 children per woman as of 2006/2007.
As a result of low fertility rates and high life expectancy, the current demographic challenges faced by Sri Lanka are its declining share of children and increasing share of elderly, and an increasing working age population. While the country continues to take advantage of the high share of working age population to stimulate economic growth in the short term, the other two emerging population issues spur questions on their own.
An accompanying paper, De Silva (2011)
2analyzes the drivers of population growth in Sri Lanka focusing on changes that occur in fertility, mortality and international migration levels. Of these, the present note will focus in depth only on the fertility and fertility-related challenges.
First, the fertility trends will be reviewed. Further, following the framework developed by Bongaarts (1978),
3some direct determinants of fertility are presented. Third, a few specific socioeconomic and cultural factors influencing the fertility in Sri Lanka are analyzed, including child mortality and nutrition, information on health and barriers to treatment, women’s empowerment and decision making, and women’s labor and decisions about earnings.
1Dragana Avramov – “People, demography and social exclusion,” Council of Europe, Strasbourg, 2001.
2 De Silva, W. Indralal – “Sri Lankan Population Change and Demographic Bonus – Challenges and Opportunities in the New Millennium,”
background paper for the “Sri Lanka: Managing the Demographic Transition” study, 2011.
3 Bongaarts, J – “A Framework for Analyzing the Proximate Determinants of Fertility,” Population and Development Review, Vol.4 No.1, 1978.
2
Characteristics of the data used
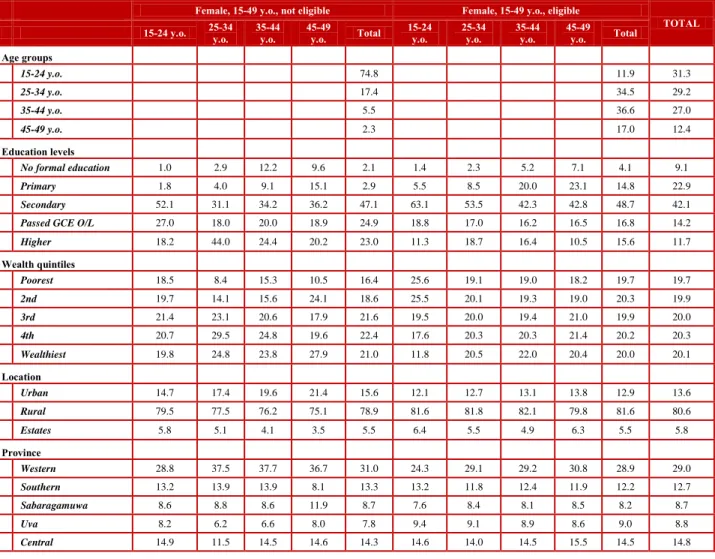
This analysis relies primarily on the 2006-07 Demographic and Health Survey (DHS), supplemented by the 2000 DHS to highlight selected time trends. The DHS collects information on household characteristics as well as on the characteristics of the women and children, and their nutritional status and reproductive behavior (in the case of women). A note of caution in comparing the findings of the two surveys is that the later DHS includes the Eastern Province, although both exclude the Northern Province from enumeration. Only ever-married female 15-49 year olds are eligible for being interviewed for the female questionnaire. Thus the non-eligible sample of (single) women 15-49 year olds is strongly skewed towards the left: in 2006-07, the distribution of eligible females by 10-yrs age-groups is 11.9, 34.5, 36.6 and 17 percent respectively among the eligible females, while the same distribution is 74.8, 17.4, 5.5, and 2.3 percent respectively for the non-eligible females. Due to the age bias, the two groups have different characteristics: the non-eligible, single women of 15-49 years of age are more educated, wealthier, and tend to live more in urban areas compared to their eligible, ever-married, counterparts.
Table 1: Characteristics of women of reproductive age, 2006-07
Female, 15-49 y.o., not eligible Female, 15-49 y.o., eligible
TOTAL
15-24 y.o. 25-34
y.o. 35-44
y.o. 45-49
y.o. Total 15-24
y.o. 25-34
y.o. 35-44
y.o. 45-49 y.o. Total Age groups
15-24 y.o. 74.8 11.9 31.3
25-34 y.o. 17.4 34.5 29.2
35-44 y.o. 5.5 36.6 27.0
45-49 y.o. 2.3 17.0 12.4
Education levels
No formal education 1.0 2.9 12.2 9.6 2.1 1.4 2.3 5.2 7.1 4.1 9.1
Primary 1.8 4.0 9.1 15.1 2.9 5.5 8.5 20.0 23.1 14.8 22.9
Secondary 52.1 31.1 34.2 36.2 47.1 63.1 53.5 42.3 42.8 48.7 42.1
Passed GCE O/L 27.0 18.0 20.0 18.9 24.9 18.8 17.0 16.2 16.5 16.8 14.2
Higher 18.2 44.0 24.4 20.2 23.0 11.3 18.7 16.4 10.5 15.6 11.7
Wealth quintiles
Poorest 18.5 8.4 15.3 10.5 16.4 25.6 19.1 19.0 18.2 19.7 19.7
2nd 19.7 14.1 15.6 24.1 18.6 25.5 20.1 19.3 19.0 20.3 19.9
3rd 21.4 23.1 20.6 17.9 21.6 19.5 20.0 19.4 21.0 19.9 20.0
4th 20.7 29.5 24.8 19.6 22.4 17.6 20.3 20.3 21.4 20.2 20.3
Wealthiest 19.8 24.8 23.8 27.9 21.0 11.8 20.5 22.0 20.4 20.0 20.1
Location
Urban 14.7 17.4 19.6 21.4 15.6 12.1 12.7 13.1 13.8 12.9 13.6
Rural 79.5 77.5 76.2 75.1 78.9 81.6 81.8 82.1 79.8 81.6 80.6
Estates 5.8 5.1 4.1 3.5 5.5 6.4 5.5 4.9 6.3 5.5 5.8
Province
Western 28.8 37.5 37.7 36.7 31.0 24.3 29.1 29.2 30.8 28.9 29.0
Southern 13.2 13.9 13.9 8.1 13.3 13.2 11.8 12.4 11.9 12.2 12.7
Sabaragamuwa 8.6 8.8 8.6 11.9 8.7 7.6 8.4 8.1 8.5 8.2 8.7
Uva 8.2 6.2 6.6 8.0 7.8 9.4 9.1 8.9 8.6 9.0 8.8
Central 14.9 11.5 14.5 14.6 14.3 14.6 14.0 14.5 15.5 14.5 14.8
3
Eastern 9.7 9.3 4.7 4.2 9.2 11.1 9.3 10.2 8.3 9.7 9.2
North-Central 6.4 4.1 5.9 6.4 5.9 8.5 8.3 6.4 6.5 7.3 6.7
North-Western 10.2 8.8 8.1 10.0 9.8 11.3 10.1 10.3 10.0 10.3 10.1
Religion
Buddhism 69.8 73.8 72.7 73.0 72.8
Hindu 10.3 8.8 8.7 10.1 9.1
Islamic 12.7 10.4 11.2 9.1 10.7
Romano-Catholic 5.6 5.9 6.1 6.7 6.1
Other 1.6 1.2 1.3 1.1 1.3
Ethnicity
Sinhalese 74.8 78.6 77.9 78.6 77.9
Sri Lanka Tamil 6.6 6.6 6.6 7.2 6.7
Indian Tamil 5.3 4.3 4.2 4.8 4.5
Sri Lanka Moor 12.4 10.0 10.8 8.5 10.3
Other 0.9 0.5 0.6 0.8 0.6
drugs_heart 0.2 0.3 1.3 2.8 0.3 0.5 0.6 1.2 1.6 1.0 1.4
drugs_hyper 0.1 0.0 1.5 3.4 0.2 0.2 1.0 3.6 8.0 3.1 5.6
drugs_astma 1.5 1.6 3.2 6.5 1.7 1.9 2.8 5.3 5.3 4.0 4.1
drugs_strke 0.0 0.2 0.6 0.0 0.1 0.1 0.0 0.1 0.2 0.1 0.3
drugs_diabt 0.0 0.1 0.8 3.5 0.2 0.0 0.7 2.1 4.4 1.8 3.0
drugs_cncer 0.0 0.0 0.0 1.5 0.1 0.0 0.1 0.3 0.6 0.2 0.3
Source: DHS 2006/07. World Bank staff calculations.
The sample of eligible women in 2006/07 changed only slightly compared with 2000. It includes a higher proportion of women with secondary (48.7 percent versus 45.1 percent in 2000) and higher education (15.6 versus 12.6 percent), a larger proportion of women from rural areas (81.6 versus 73.5 percent), but a lower percentage of women practicing Buddhism (72.8 versus 77.4 percent) and of Sinhalese ethnicity (77.9 versus 84.2 percent).
The intended sample size for the 2000 DHS was 8,765 households, out of which 8,169
households (or 96.3 percent) were interviewed. There were 6,601 eligible women in the
interviewed households, out of which only 6,385 (or 96.6 percent) were fully interviewed. The
intended sample size for the 2006/2007 DHS was much bigger, 21,600 households, and the
response rate slightly higher at 97.8 percent, or 19,862 households. For the eligible women, these
numbers are 15,068 females identified as eligible, and a 97.5 percent response rate (or 14,692
interviewed eligible women).
4
Fertility trends
Historically, Sri Lanka has had the lowest total fertility rate (TFR) in the South Asia region. Still, while the fertility rates decreased over the years for all the countries in the region, Sri Lanka’s fertility decreased until 2000 (when it reached the under-replacement level of 1.9 children born to a women of reproductive age), but started increasing again during the 2000-2006/07 period.
During this period, fertility increased from 1.9 to 2.3 children per women,
4higher on estates (2.5) than in urban areas (2.2), higher for women with lower than with higher education (except xthose w/ no formal education); it has a U-shaped form by wealth (2.4-2.2-2.4). Contraceptive usage faced a small decrease (from 70 to 68 percent), the modern contraceptive usage increasing from 49.5 to 52.8 percent. In terms of fertility preferences, the percentage of women being unable or not willing to have more children stayed approximately the same (about 62 percent).
However, while the percentage of females sterilized or declared infecund was around 23 percent and the percentage declaring they want no more children was 38.7 percent in 2000, these percentages were 20 and 43 respectively in 2006/07.
Table 2: Fertility rates, South Asian countries
Urban Rural Estate Total
Bangladesh 2007 2.4 2.8 2.7
2004 2.5 3.2 3.0
1999-00 2.5 3.5 3.3
1993-94 2.1 3.4 3.3
India 2005-06 2.7 3.5 3.4
1998-99 2.1 3.0 2.7
1992-93 2.3 3.1 2.8
Nepal 2006 2.7 3.7 3.4
2001 2.1 4.4 4.1
1996 2.9 4.8 4.6
Pakistan 2006-07 3.3 4.5 4.1
1990-91 4.5 5.1 4.9
Sri Lanka 2006-07 2.2 2.3 2.5 2.3
2000 2.0 1.8 2.4 1.9
1993 2.2 2.3 2.6 2.3
1987 2.3 2.9 3.4 2.8
Source: DHS Macro International for all countries but Sri Lanka. DHS final reports for Sri Lanka.
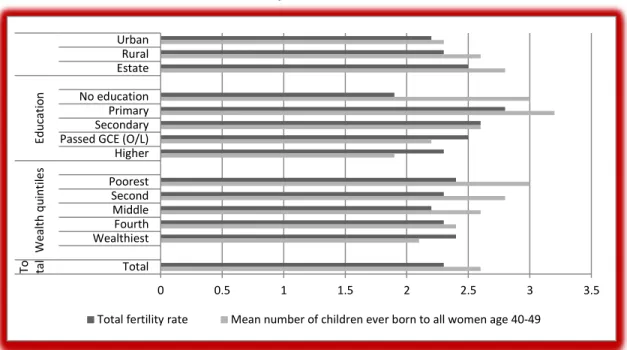
In an attempt to roughly link fertility in the past several decades with current fertility rates, Figure 1 below presents the TFR for the three years preceding the survey in conjunction with the average number of children ever born (CEB) to women age 40-49 at the time of the survey. The mean number of children ever born is an indicator of cumulative fertility; hence, it represents
4 Care should be paid to the fact that the TFR is computed based on number of births in the five years preceding the survey in 2000, and for a period of three years preceding the survey in 2006/07.
5
completed fertility for women aged 40-49 (assuming that women in this age group would hardly have newborns).
The average number of children ever born to women between ages 40 and 49, who are at the end of their childbearing years, is 2.6 (see Figure 1). The decline in fertility over time therefore is not very large, evident from the difference of 0.3 children between the average number of children for women who are currently in their forties, and the number of children women would have in their lifetime if they were subject to the current age-specific fertility rates (2.6 versus 2.3 children). The pattern of differences in the average number of children ever-born parallels the pattern of differentials in the TFR only for the place of residence. The differentials by education and wealth are (partial) exceptions to the rule. For example, uneducated women have one of the highest number of children at ages 40-49 but the lowest TFR (1.9). At the same time, “past fertility” is clearly declining with wealth (from 3 to 2.1 children), but TFR has a relatively tight U-shaped relation by wealth status. In addition, current fertility is higher in 2006/07 for women with above secondary education and lower for those with at most primary education.
Figure 1: Total fertility rate and average number of children ever born to all women 40-49 year olds
Source: Demographic and Health Survey 2006/07 Preliminary Report, Department of Census and Statistics (DCS), May 2008.
Note: The wealth index used by DCS is not necessarily comparable with the index used by the World Bank staff, as the later was constructed in a way comparable with the 2000 DHS.
0 0.5 1 1.5 2 2.5 3 3.5
Urban Rural Estate No education Primary Secondary Passed GCE (O/L) Higher Poorest Second Middle Fourth Wealthiest Total EducationWealth quintilesTo tal
Total fertility rate Mean number of children ever born to all women age 40-49
6
Proximate determinants of fertility in Sri Lanka
The relationship between socioeconomic factors and fertility is often studied in order to find specific mechanisms and vulnerable groups, which could be influenced by public policy. Still, it is acknowledged that these are only indirect determinants of fertility, which are in turn influencing other factors known as the direct determinants of fertility or intermediate fertility variables. Of these, we will focus our attention on marriage, contraception, lactational infecundability, and duration of the fertile period. Other factors found as important intermediate variables in other countries, such as induced abortion, or deemed as not very influential, such as frequency of intercourse, sterility and spontaneous intrauterine mortality are not addressed in this study due to lack of data.
Marriage and fertility preferences
The traditionalism of the Sri Lankan society, where intercourse and childbearing are acceptable mostly in formal marriages, situates marriage as one of the main determinants of fertility. The actual reproductive years will be determined by the proportion of women married, and influenced by age at marriage and age at first birth, number of children ever born and birth intervals among other factors. Before further studying each of these factors, the paper focuses on the definition of total marital fertility rate (TM), defined as the number of births to a women of reproductive age if she was to bear children at existing age-specific marital fertility rates and to remain married during the entire reproductive period.
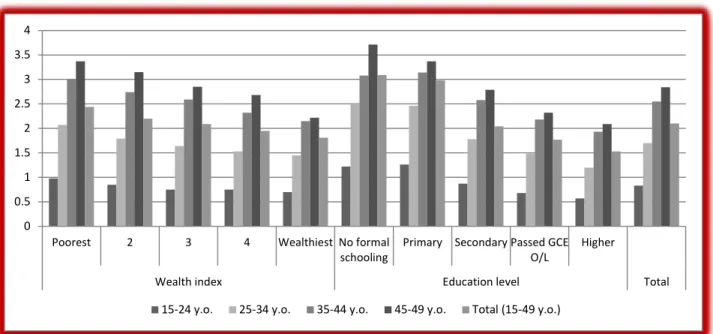
Number of children ever-born5
As mentioned above, the number of children a woman has ever borne is a cohort measure of fertility. It reflects fertility in the past, and it thus provides a somewhat different picture of fertility than do period measures of fertility such as TFR. The number of children ever-born to women of reproductive age has been continuously decreasing since 1987: it was 3 in 1987, 2.6 in 1993, 2.2 in 2000, and 2.1 in 2006/07. This number increases with women’s age regardless of the category under study: overall, it is 0.8 for the youngest cohort (15-24 year olds) and reaches 2.8 for the older cohort (45-49 year olds), decreasing from 0.9 and 3.1 respectively in 2000.
5The “number of children ever-born and alive” closely mimics both the figures and the general trend for “number of children ever-born,” the total figures being 2.8, 2.5, 2.1 and 2 in the respective years. We will therefore not discuss that indicator in the text.
7
Figure 2: Number of children ever-born, 2006/07
Source: DHS 2006/07. World Bank staff calculations.
The wealthier and more educated females tend to ever-borne fewer children for all the age groups; on average, women belonging to the wealthiest quintile gave birth to 1.8 living children versus those in the poorest quintile who procreate 2.4 children. This gap has reduced over time due to the decline in the number of births for women in the poorest quintile (2.6 in 2000). A large gap exists also by education - women with no formal education have about 3.1 children alive as opposed to women with higher education who have only 1.5; this gap slightly increased over time: in 2000, these numbers were 2.9 and 1.5 respectively. At the same time, the number of children is higher for women on estates (2.4, whereas it is 2.1 and 2 for rural and urban areas respectively), and for those of Islamic religion (2.6). Buddhist and Catholic women among religions (2 children respectively), and Sinhalese women among ethnicities (2) have the smallest number of children.
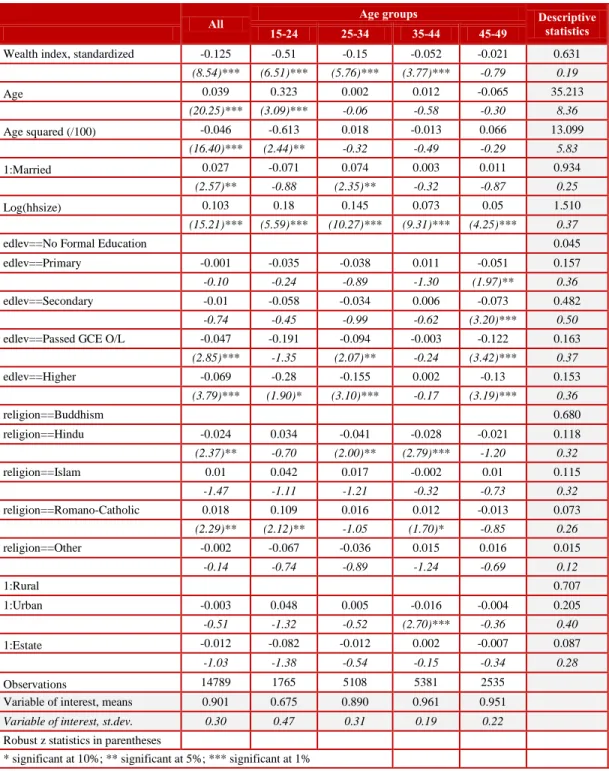
Everything else taken into account, the probability of ever giving birth decreases with wealth and education (see Table 3 below) – a 0.1 point increase in the standardized wealth index would determine a 0.013 points decrease in the probability and, compared to having no formal education, having higher education decreases the probability by 0.069 percentage points. The probability increases with the age of the women (a one year increase in the age increases the probability of ever having children by 0.039, while a one unit increase in log (household size) increases the probability with 0.103. These effects are much larger for the youngest cohort (15- 24 year olds), and they decrease with age of the cohort. At the same time, being on estates or in urban areas seems to have no significant effect on the probability of giving birth.
0 0.5 1 1.5 2 2.5 3 3.5 4
Poorest 2 3 4 Wealthiest No formal
schooling
Primary Secondary Passed GCE O/L
Higher
Wealth index Education level Total
15-24 y.o. 25-34 y.o. 35-44 y.o. 45-49 y.o. Total (15-49 y.o.)
8
Table 3: Probability of ever giving birth (ever-married women 15-49 year olds) – marginal effects from a Probit model
All Age groups Descriptive
statistics
15-24 25-34 35-44 45-49
Wealth index, standardized -0.125 -0.51 -0.15 -0.052 -0.021 0.631
(8.54)*** (6.51)*** (5.76)*** (3.77)*** -0.79 0.19
Age 0.039 0.323 0.002 0.012 -0.065 35.213
(20.25)*** (3.09)*** -0.06 -0.58 -0.30 8.36
Age squared (/100) -0.046 -0.613 0.018 -0.013 0.066 13.099
(16.40)*** (2.44)** -0.32 -0.49 -0.29 5.83
1:Married 0.027 -0.071 0.074 0.003 0.011 0.934
(2.57)** -0.88 (2.35)** -0.32 -0.87 0.25
Log(hhsize) 0.103 0.18 0.145 0.073 0.05 1.510
(15.21)*** (5.59)*** (10.27)*** (9.31)*** (4.25)*** 0.37
edlev==No Formal Education 0.045
edlev==Primary -0.001 -0.035 -0.038 0.011 -0.051 0.157
-0.10 -0.24 -0.89 -1.30 (1.97)** 0.36
edlev==Secondary -0.01 -0.058 -0.034 0.006 -0.073 0.482
-0.74 -0.45 -0.99 -0.62 (3.20)*** 0.50
edlev==Passed GCE O/L -0.047 -0.191 -0.094 -0.003 -0.122 0.163
(2.85)*** -1.35 (2.07)** -0.24 (3.42)*** 0.37
edlev==Higher -0.069 -0.28 -0.155 0.002 -0.13 0.153
(3.79)*** (1.90)* (3.10)*** -0.17 (3.19)*** 0.36
religion==Buddhism 0.680
religion==Hindu -0.024 0.034 -0.041 -0.028 -0.021 0.118
(2.37)** -0.70 (2.00)** (2.79)*** -1.20 0.32
religion==Islam 0.01 0.042 0.017 -0.002 0.01 0.115
-1.47 -1.11 -1.21 -0.32 -0.73 0.32
religion==Romano-Catholic 0.018 0.109 0.016 0.012 -0.013 0.073
(2.29)** (2.12)** -1.05 (1.70)* -0.85 0.26
religion==Other -0.002 -0.067 -0.036 0.015 0.016 0.015
-0.14 -0.74 -0.89 -1.24 -0.69 0.12
1:Rural 0.707
1:Urban -0.003 0.048 0.005 -0.016 -0.004 0.205
-0.51 -1.32 -0.52 (2.70)*** -0.36 0.40
1:Estate -0.012 -0.082 -0.012 0.002 -0.007 0.087
-1.03 -1.38 -0.54 -0.15 -0.34 0.28
Observations 14789 1765 5108 5381 2535
Variable of interest, means 0.901 0.675 0.890 0.961 0.951
Variable of interest, st.dev. 0.30 0.47 0.31 0.19 0.22
Robust z statistics in parentheses
* significant at 10%; ** significant at 5%; *** significant at 1%
Source: DHS 2006/07. World Bank staff calculations
To a different degree, the same effects can be observed in a regression on the number of children
ever-born to a woman of current reproductive age. The only difference is that, when controlling
for other effects, living on estates or in urban areas significantly decrease the number of children
ever-born; this is true in general, as well as for the older (35-44 and 45-49 years old) cohorts.
9
Birth intervals (for those women with 2 or more births, in months)6
The length of the interval between live births indicates the pace of childbearing and has implications for both fertility and mortality. It is hypothesized that women who have births in rapid successions complete their childbearing years with more children than those who space births farther apart. On the other hand, research shows that the birth interval influences child mortality: short intervals may unfavorably affect both mother’s health and the child’s chances of survival, with birth intervals lower than two years being generally considered as too short, and hence treated as having the highest risk of mortality.
From this point of view, the spacing of births in Sri Lanka is on the right track, on average, increasing from 39.1 months in 2000 to 44.3 months in 2006/07. The interval tends to be shortest for the 15-24 year olds (36.6 months) and largest for 25-34 year olds (47.3 months); the difference between the age cohorts increased in time (from 32 and 39.4 months respectively for the above-mentioned cohorts in 2000).
Figure 3: Birth interval for women with 2 or more children, 2006/07 (in months)
Source: DHS 2006/07. World Bank staff calculations.
6 In computing the average birth interval, twins are treated as one (1) pregnancy/birth episode instead as considering it as 2 separate episodes with 0 months in between.
0 10 20 30 40 50
Poorest 2 3 4 Wealthiest No formal
schooling
Primary Secondary Passed GCE O/L
Higher
Wealth index Education level Total
15-24 y.o. 25-34 y.o. 35-44 y.o. 45-49 y.o. Total (15-49 y.o.)
10
The wealthier and more educated women have larger births intervals, but the trends among the quintiles or education levels are not so clear cut for all the age groups. Even if larger for rural areas, the numbers for rural and urban areas are comparable (45.1 and 44 months), and almost 12 months longer than on estates (34.8 months). The Hindu have the smallest birth interval across the religions (37.4 months), while a similar place is occupied by the Indian Tamil across the ethnicities (34.8 months); the Sinhalese have the largest birth interval (46.2 months) among religions.
Multivariate analysis results in Table 4 below confirm that wealth is an important factor
determining the length of the birth interval: a 0.1 unit increase in the standardized wealth index is
associated with a 0.8 months increase in the birth interval. Birth order is also significantly
increasing the birth intervals, and a one-year increase in the women’s age is associated with a 3.1
months increase in the birth interval. In this setting, all other factors being constant, higher
education is also associated with larger spacing of births, but having secondary education or
having passed GCE O/L have a larger effect than higher education. All the religions have lower
birth intervals than women of Buddhist religion. The intervals are approximately 5 months lower
for women on estates than those residing in rural areas.
11
Table 4: Multivariate analysis of birth intervals – results from an OLS
All women (25-49 year olds)
Age groups
Descriptive statistics
25-34 35-44 45-49
Wealth index, standardized 7.855 9.684 7.993 6.409 0.598
(5.69)*** (4.09)*** (3.89)*** (2.13)** 0.20
Birth order: 2nd (comparison) 0.5475
Birth order: 3rd or fourth 3.180 0.330 4.631 3.656 0.387
(6.47)*** -0.34 (6.53)*** (3.84)*** 0.49
Birth order: 5th or above 1.783 -3.435 2.003 3.813 0.066
(1.68)* -1.14 -1.35 (2.32)** 0.25
Age 3.086 3.413 7.498 -21.875 39.228
(9.18)*** -1.09 (1.99)** -0.83 6.66
Age squared (/100) -4.54 -4.765 -10.147 22.496 15.832
(10.06)*** -0.91 (2.14)** -0.80 5.04
edlev==No Formal Education 0.077
edlev==Primary -0.619 0.263 -0.777 0.098 0.259
-0.69 -0.13 -0.56 -0.06 0.44
edlev==Secondary 3.277 3.229 2.635 4.289 0.457
(3.47)*** -1.57 (1.88)* (2.49)** 0.50
edlev==Passed GCE O/L 4.313 -1.413 6.386 6.163 0.121
(3.76)*** -0.60 (3.61)*** (2.85)*** 0.33
edlev==Higher 1.727 -7.858 3.025 9.002 0.086
-1.42 (3.26)*** (1.71)* (3.33)*** 0.28
religion==Buddhism 0.618
religion==Hindu -4.407 -9.535 -5.778 3.840 0.143
(5.43)*** (7.19)*** (4.97)*** (1.70)* 0.35
religion==Islam -5.531 -11.435 -5.995 1.732 0.157
(7.60)*** (10.18)*** (5.30)*** -1.23 0.36
religion==Romano-Catholic -2.331 -4.900 -4.468 3.274 0.066
(2.34)** (2.82)*** (3.14)*** -1.38 0.25
religion==Other -4.494 -5.973 -5.504 2.181 0.016
(2.45)** -1.61 (2.64)*** -0.49 0.13
1:Rural 0.710
1:Urban -0.849 -1.994 -0.751 -0.624 0.184
-1.28 (1.83)* -0.79 -0.43 0.39
1:Estate -4.929 -8.626 -2.949 -5.436 0.105
(5.50)*** (6.00)*** (2.30)** (2.27)** 0.31
Constant -11.071 -14.540 -98.411 561.617
(1.82)* -0.31 -1.33 -0.91
Observations 17,600
4,112 8,480 4,707
R-squared 0.04 0.08 0.03 0.02
Variable of interest, means 43.603 46.418 44.554 39.928
Variable of interest, st.dev. 27.31 24.74 28.34 27.65
Robust z statistics in parentheses
* significant at 10%; ** significant at 5%; *** significant at 1%
Source: DHS 2006/07. World Bank staff calculations.
12 Contraception - knowledge and ever-utilization
The knowledge of at least one contraceptive method is almost universal among women, with rates larger than 97 percent regardless of the wealth status, education level, location, religion, or ethnicity. Still, while knowledge about the modern contraceptives is almost universal, the knowledge about traditional methods is at about 80 percent overall, with large discrepancies by any of the above groupings. The wealthier and better educated women (89 and 96 percent respectively), rural and urban residents (84 and 77 percent respectively), Sinhalese and Buddhists (89 percent each) tend to have more knowledge about traditional methods, as opposed to less wealthy and less educated (66 and 43 percent respectively), those residing on estates (only 28 percent), Hindu and Indian Tamils (38 and 26 percent respectively).
The same trends apply to the ever-usage of contraceptives: about 85 percent of eligible women ever-used any contraceptive methods, with 75 percent ever-using at least one modern and only 41 percent ever-using at least one traditional method. Again, the poor and less educated seem to have used more the modern methods than the rich and more educated; the reverse is true for the traditional methods. Overall, the rural areas have the highest rates of ever-utilization of either a modern or a traditional method (77 and 44 percent respectively), with the estates lagging behind in the usage of traditional methods (8 percent). This overall low usage of traditional methods on estates hides the decreasing trend among age cohorts: 11 percent for the 15-24 year olds, and 3 percent for 45-49 year olds. At the same time, the ever-usage of modern contraceptives on estates has an opposite trend: it is 57 percent for the 15-24 year olds, reaches 81 percent for the 35-44 year olds, and 75 percent for the 45-49 year olds.
The high rate of ever-usage of a modern method is partly due to the ever-usage of women’s sterilization: among those who ever used a contraceptive method, 20 percent ever-used female sterilization. It seems though that it is the more disadvantaged groups - poorer, less educated, living on estates - that refer to sterilization. On the estates, as high as 56 percent of the women ever-using a contraceptive method report having used sterilization, and as much as 77 and 85 percent of the women 35-44 year olds and 45-49 year olds respectively report it.
The starting time of contraceptive usage is an indicator of fertility preference. The wealthiest seem to start using contraceptives earlier in their reproductive life than the poorest women: on average, the wealthiest start using them after having one child whereas the poorest - after having 1.6 children. Also, females on the estates start using contraceptives “later” than their urban/rural counterparts (after 2.1 children, versus about 1.2 in urban/rural locations). Similarly, the Hindu (2.1) and Islamic (1.9) women start using contraceptives later than their Buddhist (1.1) counterparts. In terms of ethnicity, it is the Indian and Sri Lankan Tamil (about 2.1) who start using it later, while Sinhalese women start much earlier (1.1).
While the decision on first using contraceptives is made by the couple in proportion of more than
70 percent of the cases for better educated and the wealthiest, this proportion drops to 45-52
percent for the poorest and less educated. Women from these latter categories are likely to have
taken the decision either by themselves or yield to their husbands’ decision or agree with the
midwife’s decision (e.g. midwife takes the decision in 21 percent of the cases within the poorest
quintile, while only in 8 percent of the cases in the wealthiest quintile). There are interesting
trends by:
13
-
Location: while the distribution of the decision takers is similar in rural and urban areas (about 65 percent by couple, and about 10 percent each by respondent, husband, or midwife), this structure changes on estates: about 45 percent by couples, 22 percent by midwifes, 10 percent by respondent, and 13 percent by husbands.
-
Hindu and Indian Tamil have a similar distributional structure as the estates, while Buddhists/Sinhalese – similar with rural areas.
In terms of current usage of contraceptives, 14 percent of women never used contraceptives, 14 percent use no current methods (1 percent are on menopause), 4 percent are pregnant, 17 percent are sterilized, and 51 percent use methods other than sterilization. As a method of contraception, being sterilized seems to happen more often to poorer (approx 29 percent) than to richer females (12 percent); the bulk of them have either secondary (45 percent) or primary education (31 percent), live mostly in rural areas (76 percent), practice Buddhism (70 percent) or Hinduism (16 percent), and are Sinhalese (75 percent).
The decision on using the current method (for currently married, not pregnant or sterilized women) is more often taken as a couple (70 percent), than as an individual (about 10 percent each of respondent, her husband, or public midwife). There are variations among the age groups – the decision is taken by the couple in 67 percent of the cases, lies at about 8 percent each with the respondent or her husband and 14 percent with the public midwife for the 15-24 year olds. At the same time, for the 45-49 year olds the decision is taken more often by the couple (72 percent) or the husband (16 percent), than by the respondent (7 percent) or public midwife (4 percent).
The decision on using the current method is taken by the couple more often for the wealthier (78
versus 60 percent for the poorest women) and more educated women (about 77 percent for those
who passed GCE O/L or higher, while only 46 percent for those with no formal schooling), and
less on estates (48 percent versus over 70 percent in other areas) and among Indian Tamil (51
percent versus more than 70 percent for other ethnicities). The percentage of women taking the
decision by themselves or leaving the decision to public midwives decreases with wealth and
education, and it is lower for women of Islamic religion; it is, however, larger on estates and
among Indian Tamils. The work status does not influence the decision of using the current
contraceptive method.
14
Socioeconomic and cultural factors influencing fertility
Females’ nutritional status
Recent medical research has identified epigenetic mechanisms as potentially providing a path by which conditions of scarcity in the past can influence the pathogenesis of heart disease in subsequent generations. Therefore, the maternal under-nutrition and its legacy of fetal under- nutrition is now recognized as a major long-term risk factor in the development of adult cardiovascular disease and diabetes.
7It is therefore important to understand the nutritional status of female of reproductive age, as they are the mothers of the young generations.
A measure of nutritional status for adults is the body mass index (BMI). The BMI is defined as weight in kilograms divided by height in meters squared (kg/m2).
8A cut-off point of 18.5 is used to define thinness or acute under-nutrition (low BMI), and a cut-off point of 25 – to indicate overweight or obesity.
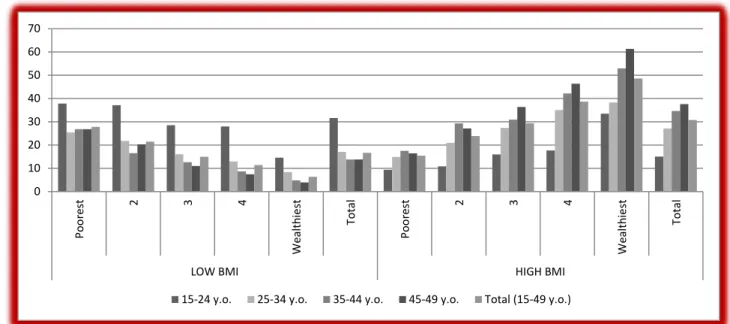
Women’s’ BMI increased over the 2000-2006/07 period from an average of 22.1 to 23, and the overall percentage of women with low BMI decreased from 21.8 to 16.6 percent. At the same time, the percentage of those having a low BMI decreases while the percentage of those experiencing high BMI increases as the cohorts advance in age.
Figure 4: Women’s nutritional status, 2006/07
Source: DHS 2006/07. World Bank staff calculations.
7 See “Clinic and Hospital-based Preventive and Curative Health Services Delivery in Sri Lanka for Non-communicable Diseases (NCDs): Policy Options for the Future,” 2010.
8 This index excludes women pregnant at the time of the survey, and women who gave birth during the last two months preceding the survey.
0 10 20 30 40 50 60 70
Poorest 2 3 4 Wealthiest Total Poorest 2 3 4 Wealthiest Total
LOW BMI HIGH BMI
15-24 y.o. 25-34 y.o. 35-44 y.o. 45-49 y.o. Total (15-49 y.o.)
15
Multivariate analysis confirms the positive effect of wealth, being married, better education, number of children born and living, and urban location on BMI value; it is only the household size and living on estates that have a negative effect (see Table 5 below for detailed results). The relation between wealth and BMI is strong: a 0.1 point increase in the standardized wealth index triggers a 0.543 increase in BMI. Being married determines a 0.8 increase in BMI, while living in urban areas increases the BMI of women by 0.8 when compared to their rural counterparts.
Still, the estates’ women BMI is 1.59 lower than that of the rural counterparts.
In terms of education, the effect of higher education is strong. However, while the effect
increases with the education level until “Passed GCE O/L,” it decreases for those with higher
education. This might illustrate that the higher educated women take more control in managing
their BMI than their less educated counterparts. A question arises though as to the quality of the
food used and the health behavior of these women: Is the food more nutritious or just empty
calories, which would in the future cause obesity? (See the increase in percentage of overweight,
from 24 to 30.5.) Are women provided with time/knowledge for physical activity?
16
Table 5: Multivariate analysis of women’s BMI – results from an OLS
All women (15-49 y.o.)
Age groups Descriptive
statistics
15-24 25-34 35-44 45-49
Wealth index, standardized 5.427 4.111 4.446 5.781 7.107 0.626
(21.02)*** (6.18)*** (10.34)*** (13.87)*** (11.83)*** 0.19
Age 0.324 0.063 0.862 0.536 -3.454 35.912
(7.17)*** -0.07 -1.50 -0.79 -0.65 8.21
Age squared (/100) -0.338 0.216 -1.288 -0.633 3.644 13.570
(5.18)*** -0.10 -1.33 -0.73 -0.64 5.78
1:Married 0.802 0.376 1.235 0.606 0.771 0.929
(4.75)*** -0.65 (3.36)*** (2.18)** (2.81)*** 0.26
Ever given birth 0.800 -0.107 0.714 0.758 0.939 0.922
(5.04)*** -0.25 (2.57)** (2.18)** (2.07)** 0.27
Nr. own children 0-14 in the hhld 0.049 0.639 0.125 -0.061 -0.218 1.316
-0.91 (1.98)** -1.20 -0.75 -1.63 1.06
Nr. not own children 0-14 in the hhld 0.164 0.246 0.223 -0.108 0.352 0.195
(1.90)* -1.42 -1.57 -0.64 (1.88)* 0.60
Number of elderly (60+ y.o.) 0.005 0.011 0.163 -0.162 -0.119 0.317
-0.07 -0.05 -1.33 -1.23 -0.55 0.60
Log(hhsize) -0.374 -0.707 -0.653 0.260 -0.436 1.506
(2.42)** (1.94)* (2.30)** -0.90 -1.35 0.37
edlev==No Formal Education 0.049
edlev==Primary 0.624 0.943 0.448 0.660 0.477 0.169
(3.28)*** -1.03 -1.03 (2.33)** -1.40 0.37
edlev==Secondary 0.685 0.685 0.206 0.781 0.465 0.477
(3.70)*** -0.79 -0.52 (2.67)*** -1.33 0.50
edlev==Passed GCE O/L 0.749 0.661 0.106 1.020 0.760 0.158
(3.51)*** -0.73 -0.25 (3.07)*** (1.82)* 0.36
edlev==Higher 0.498 0.266 -0.130 0.794 0.703 0.147
(2.26)** -0.28 -0.29 (2.27)** -1.49 0.35
religion==Buddhism 0.677
religion==Hindu 0.420 0.226 0.146 0.642 0.458 0.120
(2.23)** -0.55 -0.49 (2.22)** -1.20 0.33
religion==Islam 1.876 1.051 1.688 2.064 2.401 0.114
(10.49)*** (2.26)** (5.78)*** (7.24)*** (5.77)*** 0.32
religion==Romano-Catholic 0.950 1.054 0.859 1.049 0.840 0.075
(5.40)*** (1.96)** (2.87)*** (3.50)*** (2.26)** 0.26
religion==Other 0.984 -0.126 0.814 1.386 1.008 0.014
(2.47)** -0.16 -1.30 (2.12)** -1.49 0.12
1:Rural 0.707
1:Urban 0.799 0.750 0.687 0.766 1.029 0.205
(5.81)*** (1.92)* (3.16)*** (3.57)*** (3.49)*** 0.40
1:Estate -1.590 -0.836 -1.349 -1.705 -2.176 0.089
(7.77)*** (1.93)* (4.07)*** (5.17)*** (5.54)*** 0.28
Constant 10.602 15.344 4.244 5.879 99.336
(13.26)*** -1.64 -0.49 -0.44 -0.79
Observations 12,867 1,285 4,225 4,948 2,409
R-squared 0.14 0.09 0.08 0.13 0.18
Variable of interest, means 23.036 20.991 22.715 23.477 23.785