Supporting Information for “Stand-alone Pacific Coastal Warming events”
Joke F. Lübbecke 1,2*, Daniel Rudloff 1,2, and Lothar Stramma1
1GEOMAR Helmholtz Centre for Ocean Research Kiel, Kiel, Germany.
2Christian-Albrechts-Universität zu Kiel, Kiel, Germany
Contents of this file:
Figures S1, S2, S3, S4 Table S1
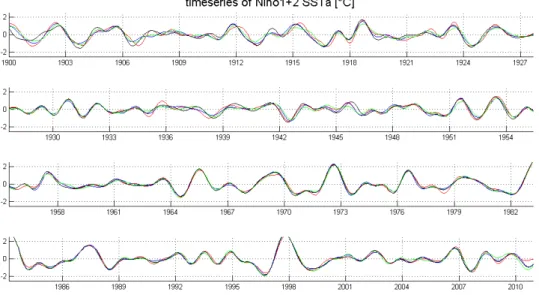
Figure S1. Time series of the Niño1+2 index for COBE2 (green), NOAA ERSSTv5 (black), SODA2.2.4 (red), and HadISST (blue) datasets.
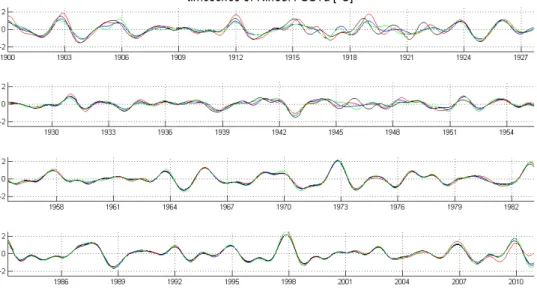
Figure S2. Time series of the Niño3.4 index for COBE2 (green), NOAA ERSSTv5 (black), SODA2.2.4 (red), and HadISST (blue) datasets.
Figure S3. Time series of Niño1+2 (solid) and Niño3.4 (dashed) SSTa from SODA2.2.4. Red bars indicate the coastal warming events identified from all data sets (for criteria see
manuscript section 2).
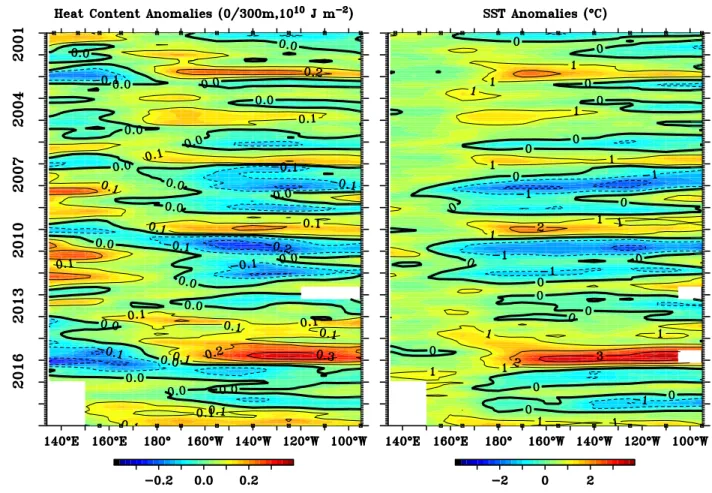
Figure S4. Longitude-time diagram of (a) Heat Content anomalies in Jm-2 and (b) SST anomalies in ºC averaged over 2ºS to 2ºN from the TAO/TRITON array (obtained from https://www.pmel.noaa.gov/tao/drupal/disdel/).
Year of event
SODA 2.2.4
HadISST COBE SST2
NOAA ERSSTv5 1902 02 - 06 02 - 06 04 - 06 03 1923 04 - 06 05 - 07 03 - 06 03 - 06 1925 05 - 10 05 - 08 06 - 07 04 - 08
1932 04 - 05 03 - 06 - 03 - 04
1943 04 - 06 05 - 06 - 03 - 06
1945 06 - 10 06 - 11 - 08 - 12
1951 04 - 07 04 - 06 - 05 - 08
1953 03 - 10 04 - 09 05 - 06 02 - 08 1957 03 - 06 04 - 06 04 - 06 03 - 05 1965 03 - 06 02 - 06 02 - 06 02 - 06
1969 06 - 10 05 - 09 - 05 - 10
1972 03 - 05 03 - 05 03 - 05 03 - 04 1976 04 - 07 04 - 06 04 - 06 04 - 07 1979 03 - 08 02 - 10 04 - 11 03 - 09 1983 06 - 10 06 - 10 06 - 10 06 - 10 1993 06 - 10 06 - 09 05 - 08 05 - 09 1998 05 - 06 06 05 - 06 05 - 06 2008 05 - 09 05 - 08 05 - 10 04 - 09
Table S1. Calendar months in which the coastal warming events occur in the different data sets (for criteria see manuscript section 2).