Wilfried Jokat1,2 , John O'Connor1,3,4 , Folkmar Hauff5 , Anthony A.P. Koppers6 , and Dan P. Miggins6
1Alfred Wegener Institute Helmholtz Centre for Polar and Marine Research, Bremerhaven, Germany,2Faculty of Geosciences, University of Bremen, Bremen, Germany,3GeoZentrum Nordbayern, University Erlangen‐Nürnberg, Erlangen, Germany,4Faculty of Science, VU University Amsterdam, Amsterdam, Netherlands,5GEOMAR Helmholtz Centre for Ocean Research Kiel, Kiel, Germany,6College of Earth, Ocean, and Atmospheric Sciences, Oregon State University, Corvallis, OR, USA
ABSTRACT
Ultraslow spreading ridges are poorly understood plate boundaries consisting of magmatic and amagmatic segments that expose mostly mantle peridotite and only traces of basalt and gabbro. The slowest part of the global spreading system is represented by the eastern Gakkel Ridge in the Central Arctic Ocean, where crustal accretion is characterized by extreme focusing of melt to discrete magmatic centers.Close to its eastern tip lies the unusual 5,310‐m‐deep Gakkel Ridge Deep (GRD) with limited sediment infill, which is in strong contrast to the broader sediment‐filled rift valleys to the east and west. Here, we report an40Ar/39Ar age of 3.65 ± 0.01 Ma for a pillow basalt from a seamount located on the rim the GRD, confirming ultraslow spreading rates of ~7 mm/year close to the Laptev Sea as suggested from aeromagnetic data. Its geochemistry points to an alkaline lava, attributed to partial melting of a source that underwent prior geochemical enrichment. We note that the GRD extracts compositionally similar melts as the sparsely magmatic zone further west but at much slower spreading velocities of only ~6−7 mm/year, indicating the widespread occurrence of similarly fertile mantle in the High Arctic. This enriched source differs from subcontinental lithospheric mantle that influences magmatism along the Western Volcanic Zone (Goldstein et al., 2008, https://doi.org/10.1038/nature06919) and is similar to metasomatized mantle, shown to influence melt genesis along the Eastern Volcanic Zone.
1. Introduction
The Gakkel Ridge extending for 1,800 km under the Arctic ice is the slowest spreading ridge on Earth with estimated full spreading rates varying from ~13 mm/year in the west to only ~6 mm/year in the east (Brozena et al., 2003; Karasik, 1968; Vogt et al., 1979). There is growing evidence that the Gakkel Ridge expresses unique modes of crustal accretion and tectonic extension (Cochran, 2008; Dick et al., 2003;
Jokat et al., 2003; Jokat & Schmidt‐Aursch, 2007; Michael et al., 2003; Schlindwein & Schmidt, 2016; Sohn et al., 2008). Moreover, because it contains no significant transform offsets that can act as boundaries to man- tleflow and composition, it is an ideal place to study mantle source heterogeneity and melting dynamics at ultraslow spreading rates and the processes contributing to the composition of the Arctic mantle (Dick et al., 2003; Goldstein et al., 2008; Michael et al., 2003; Schlindwein & Schmidt, 2016).
Based on thefirst systematic geophysical/petrological study along most of the Gakkel Ridge between 7°W and 85°E (Jokat et al., 2003; Michael et al., 2003) the Gakkel Ridge was divided into three tectonic segments, composed of robust Western (WVZ) and Eastern (EVZ) Volcanic Zones separated by a“Sparsely Magmatic Zone”(SMZ) (Figure 1).
The WVZ has mid‐Atlantic ridge‐type morphology with a 15‐km‐wide rift, axial volcanic ridges, volcanoes scattered on the valleyfloor, and rift valley walls consisting of high‐angle faults (Cochran, 2008). The num- ber and size of volcanic features are, however, greatly reduced compared to those of the slow spreading Mid‐ Atlantic Ridge (e.g., Cochran, 2008; Jokat et al., 2003). Basalts were recovered by dredging almost exclusively in this segment (Figure 1d), carrying a pronounced magnetic anomaly of up to 500 nT.
Further to the east, the SMZ and EVZ display a very different mode of crustal accretion. The transition from the WVZ to the SMZ at 03°30′E is abrupt: Water depths drop from 4,000 to 5,200 m, the magneticfield decreases to low values around 10 nT, and in this 300‐km‐long segment less than 20% of the rift valley is
©2019. The Authors.
This is an open access article under the terms of the Creative Commons Attribution License, which permits use, distribution and reproduction in any medium, provided the original work is properly cited.
Special Section:
Polar region geosystems
Key Points:
• The Sparsely Magmatic Zone (Gakkel Ridge) geochemistry and topography represent the low extreme for global seafloor spreading ridges
• Thefirst age dating of a Gakkel Ridge rock sample shows that seafloor spreading is active along the eastern part of the ridge
• The study contributes to our global understanding of ultraslow spreading mid‐ocean ridges
Supporting Information:
•Supporting Information S1
Correspondence to:
W. Jokat,
wilfried.jokat@awi.de
Citation:
Jokat, W., O'Connor, J., Hauff, F., Koppers, A. A. P., & Miggins, D. P.
(2019). Ultraslow spreading and volcanism at the eastern end of Gakkel Ridge, Arctic Ocean.Geochemistry, Geophysics, Geosystems,20. https://doi.
org/10.1029/2019GC008297
Received 26 FEB 2019 Accepted 5 NOV 2019
Accepted article online 3 SEP 2019
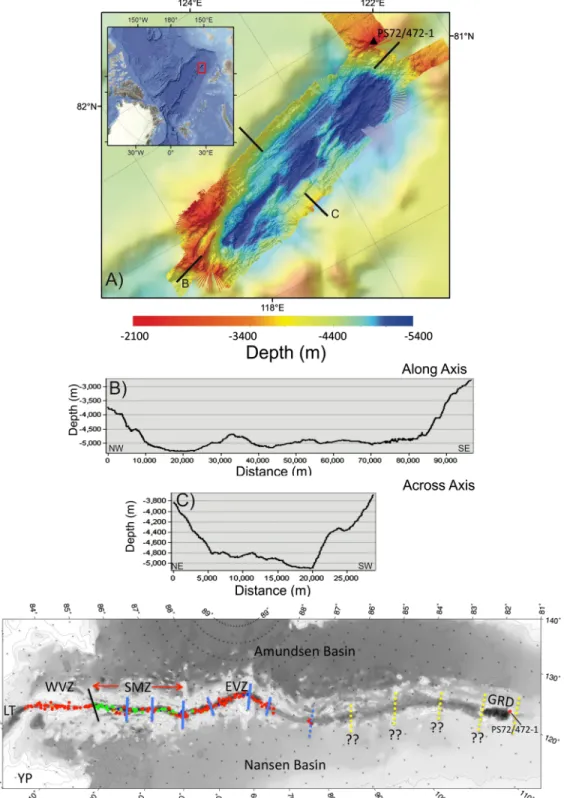
Figure 1. (a–c) Inset shows the bathymetry of the Eurasian Basin in the Arctic Ocean (IBCAO grid v3, 500‐m grid resolution) (Jakobsson et al., 2012). The red box indicates our research area. (a) The swath bathymetry acquired during two RVPolarsterncruises. Rock sample PS72/472‐1 was recovered from Shaykin Seamount during the RVPolarsterncruise ARK‐XXIII/3. Dredge track from 81°12.76′N, 121°25.87′E, 3,257‐m water depth to 81°12.15′N, 121°31.26′E, 2,474‐m water depth. See Jokat (2009) for further details. The black lines indicate the location of the along‐and across‐axis depth profiles shown in (b) and (c), respectively.
(d) Bathymetry of the Gakkel Ridge and the adjacent deep sea plains (Jakobsson et al., 2012). Sample locations are marked according to Michael et al. (2003).
Red = basalt; green = peridotite; orange = gabbro; blue = others. The colored lines mark different tectonic elements: black line = eastern termination of the WVZ;
blue lines = volcanic basement ridges (six) perpendicular to the rift valley, which subdivide the three general segments; dashed blue line = location of recent volcanism (Müller & Jokat, 2000; Sohn et al., 2008), dashed yellow lines = suggested location of transverse volcanic basement ridges caused by focused magmatism but almost completely covered by sediments. Abbreviations: EVZ = Eastern Volcanic Zone; GRD = Gakkel Ridge Deep; LT = Lena Trough; SMZ = Sparsely Magmatic Zone; WVZ = Western Volcanic Zone; YP: Yermak Plateau.
covered by basalts (Figure 1d; Michael et al., 2003). In contrast to the WVZ segment, the SMZ and EVZ seg- ments are characterized by a total of six magmatic basement ridges with a spacing of 100 km. These ridges carry a strong magnetic signal of up to 500 nT, which declines to low values close to 0 nT between them (Jokat & Schmidt‐Aursch, 2007) and correlates with dredging results. Within the SMZ, basalts were mostly dredged in the vicinity of the magmatic ridges, while peridotites were recovered in between. In the EVZ basalts dominate again the seafloor between the basement ridges. These data were interpreted as evidence for extreme focusing of melt into discrete magmatic centers, which might be related to local diapirism result- ing from localized melting of inhomogeneities embedded in a heterogeneous (veined?) mantle (Jokat et al., 2003; Michael et al., 2003).
It is still unknown whether this pattern of ridge segmentation continues at even slower spreading rates of ~6 mm/year along the remaining portion of the Gakkel Ridge toward the Laptev Sea, since the rift valley east of 70°E isfilled by several‐kilometer‐thick sediments (Jokat & Micksch, 2004; Nikishin et al., 2017; Sekretov, 2002). East of 85°E, only a few high standingflanks of the rift valley are accessible to basement sampling.
A notable exception occurs between 81°10′N and 82°N latitude along 120°E longitude (Figure 1). Here, on the easternmost part of the Gakkel Ridge, bathymetric data reveal a deep depression (maximum 5,310 m) almost devoid of sediments and thus referred to as the Gakkel Ridge Deep (GRD) (Figure 1; Nikishin et al., 2017). Seismic reflection data (Nikishin et al., 2017; Piskarev & Elkina, 2017) confirm the near absence of sediment in the GRD. Despite the lack of basement exposure, no information about lithology, crustal thick- ness, and age of the easternmost Gakkel Ridge rift valley is so far available. Recent swath mapping shows that the GRD is roughly 97 km long, 30 km wide, with a basin depth that is 1,800–2,000 m deeper than the surroundingflanks, which are composed of several volcanic peaks and mounds (Figures 1a–1c). The cen- tral part of the GRD reveals rift‐parallel ridges up to 0.5–1 km high, similar to other mid‐ocean rift valleys (Figures 1a–1c). Overall, a 10‐km‐wide, tectonically active, divergent plate boundary is evident for the central GRD.
Here we report high‐precision40Ar/39Ar age, geochemical, and Sr‐Nd‐Pb isotopic data for a highly plagio- clase porphyritic pillow lava (PS72/472‐1) dredged from the northeast rim of the GRD at 81°12.76′N/121°
25.87′E (Jokat, 2009) (Figure 1). We use these data, in combination with geophysical information (Jokat &
Micksch, 2004; Nikishin et al., 2017; Piskarev & Elkina, 2017), to investigate the age/origin of the GRD and its implications for understanding mantle melting processes at extremely low spreading rates and if magmatism is still focused at the eastern end of the Gakkel Ridge.
2. Methods
2.1. Geochemistry
Bulk rock powder of the GRD sample PS72/472‐1 was prepared by established standard procedures at GEOMAR using a jaw crusher, agate mortar, and agate swing mill (see also Rohde et al., 2013, for technical details). Due to the highly plagioclase porphyritic nature of the lava, about 50 g of rock chips was milled to assure homogeneity. For Sr‐Nd‐Pb isotope analysis 0.5‐to 1‐mm groundmass rock chips were picked under a binocular microscope. No fresh glass is present along the thin (<1 mm) palagonitized glassy margin of the pillow. Major element and some trace element data were obtained by X‐rayfluorescence on fused beads with a Philipps X'Unique spectrometer at GEOMAR. H2O and CO2were determined with a Rosemount infrared photometer. A full set of trace element concentrations were obtained by solution inductively coupled plasma mass spectrometry on an Agilent 7500cs instrument at the Institute of Geosciences at Kiel University follow- ing the methods of Garbe‐Schönberg (1993). Sr‐Nd‐Pb isotope analyses were carried out on mildly leached groundmass chips (2 M HCl at 70 °C for 1 hr) by thermal ionization mass spectrometry as outlined in Hoernle et al. (2011). A second Sr isotope analysis used strongly leached powders (6 M HCl at 150 °C for 12 hr) to remove the effects of seawater alteration more efficiently. Analytical data along with standard mea- surements are provided in Table 1.
Correction of bulk rock analyses for plagioclase accumulation used average ~An89 compositions of samples HB12B‐1 and HB12B‐2 at https://serc.carleton.edu/NAGTWorkshops/petrology/teaching_examples/24648.
html. For each correction step, percentages are calculated for the main plagioclase constituents (SiO2, Al2O3,
Table 1
Major Element, Trace Element and Radiogenic Sr‐Nd‐Pb Isotope Data of Sample PS72/472‐1 Along With Reference Materials Analyzed
Method Unit
Sample ID Standards
PS72/472‐1 JA‐2 JB‐2 JB‐3 JR‐1
SiO2 XRF wt% 49.24 56.24 53.03 50.8 74.92
TiO2 XRF wt% 1.69 0.67 1.17 1.41 0.11
Al2O3 XRF wt% 20.12 15.45 14.77 17.21 12.84
Fe2O3 XRF wt% 8.21 6.38 14.45 11.98 0.85
MnO XRF wt% 0.12 0.11 0.21 0.17 0.1
MgO XRF wt% 2.75 8.04 4.71 5.2 0.14
CaO XRF wt% 12.03 6.26 9.89 9.75 0.7
Na2O XRF wt% 3.82 2.98 2.03 2.76 4.11
K2O XRF wt% 0.69 1.75 0.41 0.77 4.46
P2O5 XRF wt% 0.32 0.15 0.1 0.29 0.03
Co XRF ppm 28 30 47 41 5
Cr XRF ppm 199 451 29 68 b.d.l
Ni XRF ppm 22 112 28 30 b.d.l
V XRF ppm 240 126 558 385 b.d.l
Zn XRF ppm 58 64 109 99 30
Nb XRF ppm 17 9 b.d.l b.d.l 14
Ga XRF ppm 21 21 18 26 19
Rb XRF ppm 11 76 10 19 269
Ba XRF ppm 95 314 235 248 44
Sr XRF ppm 379 240 178 403 28
Y XRF ppm 24 3 21 22 11
Zr XRF ppm 154 88 42 83 82
Sum XRF wt% 99.15 98.21 100.94 100.51 98.33
H2O XRF wt% 0.84 n.a. n.a. n.a. n.a
CO2 XRF wt% 0.02 n.a. n.a. n.a. n.a.
Total XRF wt% 100.01
BIR‐1 BHVO‐2 BCR‐2
Li ICPMS ppm 6.10 3.19 4.52 8.88
Sc ICPMS ppm 36.3 44.3 32.7 34.9
V ICPMS ppm 250 311 322 420
Cr ICPMS ppm 210 374 293 19
Co ICPMS ppm 23.4 51.50 44.96 37.72
Ni ICPMS ppm 39.2 166 119 12.1
Cu ICPMS ppm 56.4 125 134 20.3
Zn ICPMS ppm 57.6 70.2 104.15 133
Ga ICPMS ppm 19.2 16.0 22.40 23.4
Rb ICPMS ppm 8.88 0.23 9.32 48.5
Sr ICPMS ppm 376 107 387 339
Y ICPMS ppm 28.0 15.8 25.66 35.8
Zr ICPMS ppm 153 14.7 170 189
Nb ICPMS ppm 16.2 0.52 17.7 12.0
Cs ICPMS ppm 0.167 0.006 0.11 1.15
Ba ICPMS ppm 116 6.33 132 664
La ICPMS ppm 12.0 0.585 15.4 25.2
Ce ICPMS ppm 27.3 1.86 38.3 52.9
Pr ICPMS ppm 3.76 0.363 5.39 6.83
Nd ICPMS ppm 16.8 2.33 24.4 28.9
Sm ICPMS ppm 4.42 1.080 6.13 6.59
Eu ICPMS ppm 1.58 0.513 2.07 1.95
Gd ICPMS ppm 4.95 1.74 6.21 6.75
Tb ICPMS ppm 0.826 0.349 0.935 1.05
Dy ICPMS ppm 5.21 2.52 5.36 6.36
Ho ICPMS ppm 1.06 0.562 0.983 1.28
Er ICPMS ppm 2.89 1.61 2.44 3.48
Tm ICPMS ppm 0.424 0.244 0.328 0.519
Yb ICPMS ppm 2.74 1.62 2.00 3.36
(Continues)
CaO, Na2O, and K2O), subtracted from the measured bulk rock composition, and then the residual melt normalized to the initially measured total of 99.85 wt% to obtain a simulation of the erupted melt composition.
2.2. Geochronology—Sample Preparation
The groundmass samples were prepared following the methods of Koppers et al. (2012). The 200‐to 180‐μm samples measured at Oregon State were cleaned in a series of hour‐long acid baths, progressing from 1 N HCl to 6 N HCl to 1 N HNO3to 3 N HNO3, followed by afinal Milli‐Q water bath. Each separate was picked by hand under a binocular microscope to ensure the removal of alteration and to confirm the purity of the separate.
Groundmass samples were irradiated for 6 hr in the CLICIT (Cadmium‐Lined In‐Core Irradiation Tube) position at the Oregon State University TRIGA® reactor. Incremental heating experiments were conducted for each sample. Irradiated samples were loaded into copper planchettes for analysis using a Thermo Scientific ARGUS‐VI multicollector mass spectrometer at the Oregon State University Argon Geochronology Laboratory following the procedure described in Konrad et al. (2018). All ages are calculated relative to Fish Canyon Tuff sanidine with an age of 28.201 Ma (Kuiper et al., 2008) and using the decay con- stants after Min et al. (2000).
The correction factors for neutron interference reactions at the TRIGA® are (2.64 ± 0.02) × 10−4for (36Ar/
37Ar)Ca, (6.73 ± 0.04) × 10−4for (39Ar/37Ar)Ca, (1.21 ± 0.003) × 10−2for (38Ar/39Ar)K, and (8.6 ± 0.7) × 10−4for (40Ar/39Ar)K. Ages were calculated using the ArArCALC v2.7.052 software of Koppers (2002), with errors including uncertainties on the blank corrections, irradiation constants, J‐curve, collector calibrations, mass fractionation, and the decay of37Ar and39Ar.
2.3. Geochonology—Data Quality
40Ar/39Ar step‐heating experiments were assessed based on the following criteria: An acceptable age plateau (1) includes at least 50% of the gas released, (2) has a mean square weighted deviation of approximately 1.0 Table 1
(continued)
Method Unit
Sample ID Standards
PS72/472‐1 JA‐2 JB‐2 JB‐3 JR‐1
Lu ICPMS ppm 0.410 0.244 0.280 0.500
Hf ICPMS ppm 3.35 0.551 4.33 4.71
Ta ICPMS ppm 0.994 0.040 1.10 0.727
Pb ICPMS ppm 1.17 2.98 1.67 10.7
Th ICPMS ppm 1.05 0.029 1.19 5.67
U ICPMS ppm 0.452 0.012 0.409 1.61
Method
Sample ID Standards
2SD N 2SE
PS72‐472‐1 NBS981
206Pb/204Pb TIMS 18.3196 16.9413 0.0019 30 0.0018
207Pb/204Pb TIMS 15.5015 15.4995 0.0019 30 0.0016
208Pb/204Pb TIMS 37.9764 36.7241 0.0048 30 0.0040
207Pb/206Pb TIMS 0.84617 0.91489 0.00004 30 0.00001
208Pb/206Pb TIMS 2.07299 2.16772 0.00007 30 0.00005
NBS987
87Sr/86Sr TIMS 0.702942 0.710250 0.000012 12 0.000005
87Sr/86Sra 0.702939 0.000005
La Jolla
143Nd/144Nd TIMS 0.513044 0.511850 0.000008 12 0.000005
Epsilon Nd 7.93
a6 M HCl leached powder at 150 °C for 12 hr, All others are 2 M HCl leached chips at 70 °C for 1 hr for Sr‐Nd‐Pb isotope analysis.
and within the statistically allowed upper limit, (3) shows an inverse isochron with a40Ar/36Ar intercept of about 295.5 ± 2σ, and (4) has concordant plateau, isochron, and total fusion ages. See more details in the supporting information.
3. Results and Preliminary Inferences
3.1. Major Elements
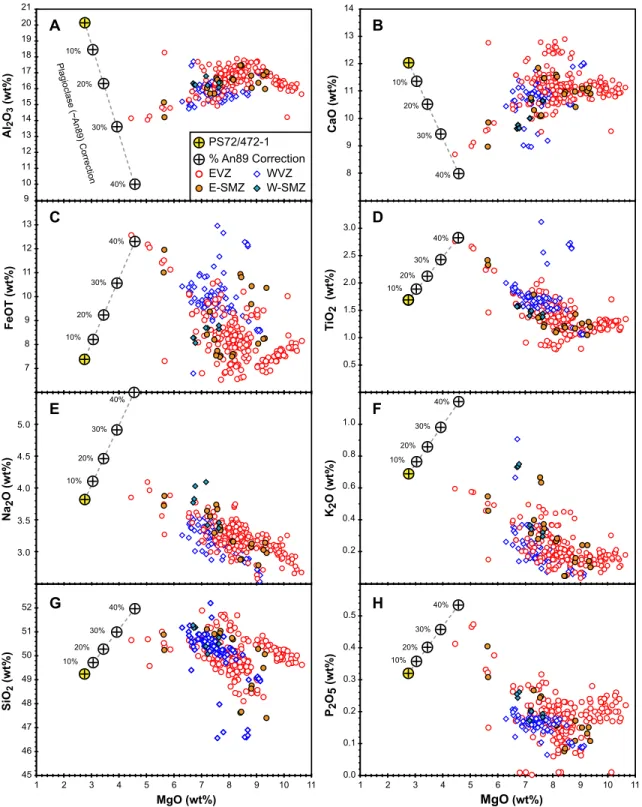
Bulk chemistry of PS72/471‐1 reveals a fairly fresh (H2O = 0.84 wt%, CO2= 0.02 wt%) but differentiated lava (MgO = 2.75 wt%; Mg# = ~40; 100 × Mg/(Mg + Fe)). Lavas with similarly low Mg# are rare along the Gakkel Ridge but occur subordinate in the EVZ and E‐SMZ (Mg# ~39 to 49 at MgO = 4.5 to 5.9 wt%). The total alkali‐silica diagram (Le Maitre et al., 2005) (Figure 2) reveals an alkali basaltic composition that occurs only occasionally throughout the Gakkel Ridge (glass compilation of Gale et al., 2013). Correction for plagioclase accumulation (see below), however, shifts the simulated melt into the trachy‐basaltfield (20–30% correction) and well into the basaltic trachy‐andesitefield (40% correction). Such high alkaline melts and differentiates thereof are unknown from the Gakkel Ridge. Major and minor element variations versus MgO show that Al2O3, CaO, FeOt, TiO2, and P2O5of the bulk GRD sample (Figure 3) has the least MgO concentration of all Gakkel glasses and plots away from the correlations defined by Gakkel Ridge glasses. Al and Ca are too high for the low Mg (Figures 3a and 3b), suggesting significant plagioclase (a Na‐Ca‐Al‐silicate) surplus that is likely caused by accumulation during eruption of this high‐viscosity lava as testified by the several meter‐sized pillow samples (Jokat, 2009). Incorporation of plagioclase xenocrysts from conduit/magma chamber walls may have further contributed to the plagioclase excess. Plagioclase correction shows that 30% subtraction lowers Al2O3to ~13.6 wt% at 3.9 wt% MgO and aligns the simulated GRD melt to differen- tiated glasses from the EVZ and E‐SMZ (Figure 3a). Similarly, a ~35% An89 correction lowers CaO to ~8.8 wt
% at 4.2 wt% MgO in line with the aforementioned EVZ and E‐SMZ glasses (Figure 3b). The FeOT and TiO2
trends of these EVZ and E‐SMZ glasses intersect the 40% An89 correction (Figures 3c and 3d), while 30% to 40% match P2O5(Figure 3h). For Na2O (Figure 3e) and K2O (Figure 3f) 30–40% An89 correction, as inferred from Al, Ca, Fe, Ti, and P, leads to compositions in the simulated melts that lie above the group of differen- tiated EVZ and E‐SMZ glasses. These discrepancies may either reflect uncertainties in the plagioclase com- position of PS72/471‐1 or indicate enrichment of Na2O and K2O in the erupted GRD melt compared to evolved EVZ and E‐SMZ glasses. If the projected high Na2O contents are real, then Na8(Na2O at MgO = 8 wt%) would lie above the common Na8range of the Gakkel Ridge (2.8–3.6 wt% Na2O) and indicate low degrees of mantle melting (Klein & Langmuir, 1987) formed the GRD melt. Confirmed insights on Na8in the erupted melt of PS72/471‐1, however, require availability of fresh glass, which is not the case.
Elevated K2O (0.65–0.95 wt%) is found in few lavas from the WVZ and both SMZ segments. Notably, the lat- ter are more mafic (MgO = 6.6 to 7.6 wt%) but have similarly elevated K2O/TiO2(0.46–0.58) to the GRD sam- ple (K2O/TiO2= 0.41). In summary 30% to 40% An89 correction simulates the erupted melt of PS72/471‐1 to 3.9–4.6 wt% MgO and align Al, Ca, Fe, Ti, and P to compositions displayed by similarly differentiated EVZ and E‐SMZ melts. Elevated Na2O and K2O contents in the simulated PS72/471‐1 melt at 30–40% An89 cor- rection are, however, higher than found in any other lava from the Gakkel Ridge but require confirmation by glass analysis of either chilled margins (not found) or melt inclusions.
3.2. Trace Elements
The incompatible trace element pattern of PS72/472‐1 (Figure 4a) displays enrichment of the highly incompatible elements (Rb, Ba, Th, U, Nb, and Ta) over the moderately incompatible elements (Ce through Eu) and the least incompatible elements (Gd through Lu). The pattern runs subparallel to refer- ence enriched mid‐ocean ridge basalt (E‐MORB; Sun & McDonough, 1989). Notably, depletions occur for Cs and Pb, which are typical of oceanic basalts (ocean island basalt [OIB], E‐MORB, and normal mid‐ ocean ridge basalt [N‐MORB]). Also, the depletion in Th is common in the vast majority of Gakkel lavas and reference E‐MORB. The Sr peak and absence of an Eu depletion is in concert with the supposed pla- gioclase accumulation/excess. Finally, the absence of Cs, Rb, Ba, and U peaks suggests that seawater alteration is insignificant in this rock and that thesefluid‐mobile elements can be used to derive petrolo- gical information. PS72/472‐1 defines the upper limit of highly to moderately incompatible elements throughout the Gakkel Ridge but falls well within the range of Gakkel Ridge glasses along the least incom- patible element spectrum. As expected, the rare earth element (REE) pattern of PS72/472‐1 (Figure 4b)
shows enrichment of the light REE (LREE) over the heavy REE (HREE) running subparallel to reference E‐MORB. Only a few Gakkel Ridge patterns (10 out of 201) are also LREE enriched, but their LREE falls below PS72/472‐1. They all testify to derivation from incompatible element‐enriched liquids.
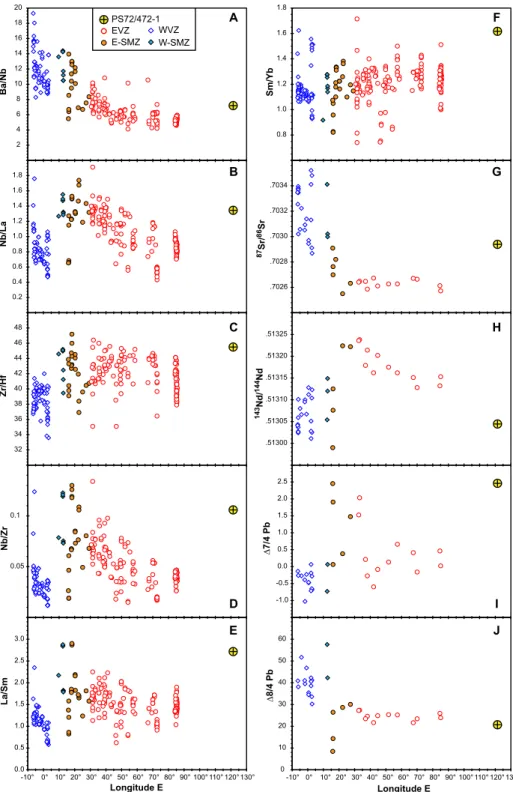
Ratios of incompatible elements with similar incompatibility such as Ba/Nb, Nb/La, and Zr/Hf visualize dif- ferences in source enrichment. Along‐axis variations show that Ba/Nb of PS72/472‐1 (Figure 5a) overlaps with EVZ west of 40°E and some E‐SMZ lavas but is lower than WVZ, W‐SMZ, and many E‐SMZ lavas.
Markedly, Ba/Nb is slightly higher than the restricted Ba/Nb of lavas and melt inclusions at 85°E, the nearest volcanic basement sampling in relation to the GRD. Nb/La (Figure 5b) of PS72/472‐1 is similar to a signifi- cant number of lavas between 55°E and 10°E (EVZ and both SMZs) but higher than all WVZ (except for two) and EVZ (85–55°E) glasses. Zr/Hf (Figure 5c) lies at the upper end of the variation evident for the EVZ through W‐SMZ and is distinctively higher than in the WVZ. Similar inferences are made for element ratios with a larger spread in incompatibility such as Nb/Zr (Figure 5d), La/Sm (Figure 5e), Sm/Yb (Figure 5f), La/Yb (not shown), and Zr/Y (not shown). These observations indicate low degrees of partial melting and/or melting of variably enriched sources and mixing/pooling of melts generated thereof.
In summary, key element ratios of Ba/Nb, Nb/La, and Zr/Hf of the GRD sample are distinct from WVZ and overlap with the enriched end of EVZ lavas west of 40°E and those of the SMZs. Remarkably, the aforemen- tioned ratios are always higher than those found in the nearest EVZ sampling location at 85°E, which sug- gests melting of a trace element‐enriched source beneath the GRD.
3.3. Radiogenic Isotopes
Radiogenic isotope ratios of Sr‐Nd‐Pb are not fractionated by magmatic processes and thus can help to more directly characterize the source(s) contributing to melt composition. Published Sr‐Nd‐Pb isotope data for the Gakkel Ridge (Goldstein et al., 2008) and the Lena Trough (Figure 1d; Nauret et al., 2011) used fresh glass chips and thereby avoided alteration effects that can apply to whole‐rock analysis. Namely, exchange with Figure 2.The total alkali versus silica diagram after Le Maitre et al. (2005) shows the bulk chemistry of PS72/471‐1 lies above the alkalic‐tholeiitic division line of MacDonald and Katsura (1964) plotting in thefield of alkali basalts. Since PS72/471‐1 is a highly plagioclase phyric lava, open circles with crosses display the composition of the erupted melt after correction for 10%, 20%, 30%, and 40% plagioclase (An89) accumulation. See text for details. For comparison,
published data of volcanic glasses (compilation of Gale et al., 2013) and melt inclusions (Shaw et al., 2010; Wanless et al., 2014) from all Gakkel ridge segments are also shown. The majority of Gakkel melts are tholeiitic, while alkaline melts are infrequent but occur in each segment. See Figure 1 for the definitions of the abbreviations.
Figure 3.(a–h) Variations of major and minor elements versus MgO as an index of melt differentiation. Bulk rock analysis of PS72/472‐1 displays the lowest MgO of all Gakkel samples (data sources same as in Figure 2). The general decrease of Ca and Al with decreasing MgO in the Gakkel samples points to olivine, plagioclase, and clinopyroxene as the principal fractionating mineral phases in the magma reservoirs, and the scatter clearly testifies that the lavas do not originate from a single liquid line of descent. The extreme offset to higher Al and Ca of PS72/472‐1 from the Gakkel array indicates accumulation of plagioclase and is consistent with the highly plagioclase phyric nature of this pillow lava. Due to the absence of fresh glass in PS72/472‐1, the composition of the erupted melt is simulated by subtraction of An89 plagioclase. See text for more details.
radiogenic seawater Sr (87Sr/86Sr = ~0.7092 at present and ~7 ppm Sr), addition of Rb and U to the rock causing elevated87Sr and206Pb ingrowth over longer geological timescales, and mobilization of Pb under hydrothermal conditions (e.g., Jacques et al., 2019). The absence of Rb and U peaks in the multielement pattern of PS72/472‐1 already hints at a fairly fresh sample. Moreover, Rb/Sr (0.024) is indistinguishable from the Gakkel glass average (0.026 ± 0.044 2SD,n= 190). Nb/U = 36.8 matches the lower end of the canonical Nb/U = 47 ± 10 for mid‐ocean ridge basalt (MORB) and OIB (Hofmann et al., 1986) and lies well within the range observed of published Gakkel glasses (Nb/U = 45.5 ± 14.9 2SD,n= 198). Similarly, Figure 4.(a) Incompatible element patterns normalized to primitive mantle (Hofmann, 1988). normal MORB, enriched MORB, and Ocean Island Basalt (OIB) from Sun and McDonough (1989) are shown for reference along with glass data from Gakkel Ridge (compilation of Gale et al., 2013, and references therein). The absence of Cs, Rb, Ba, and U peaks in the pattern of PS72/472‐1 suggests that seawater alteration is insignificant in this rock and that thesefluid‐mobile elements can be used to derive petrological information. The GRD sample shows an approximately eightfold enrichment of highly incompatible elements (Cs through Ta) over N‐MORB, demonstrating that the lava cannot be derived via melt differentiation from N‐MORB. PS72/472‐1 appears twofold enriched over reference E‐MORB and runs subparallel from Cs through Eu before convergence towards the heavy rare earth elements (HREEs). Gakkel melts display a large variability in incompatible element abundances ranging from sub‐N‐MORB to E‐MORB and beyond. Notably, PS72/472‐1 lies at the upper end of the Gakkelfield (data sources as in Figure 2) for the highly and moderately incompatible elements and crosses the Gakkelfield toward the least incompatible elements. (b) Chondrite‐normalized rare earth elements (REEs) after McDonough and Sun (1995) showing PS72/472‐1 and Gakkel samples along with reference N‐MORB, E‐MORB, and OIB (data sources same as in (a). PS72/472‐1 is one of the few Gakkel lavas (10 out of 200) with an enrichment of the light REE over the HREE. Except for one sample the GRD lava uniquely crosses the other
LREE‐enriched Gakkel patterns toward the HREE.
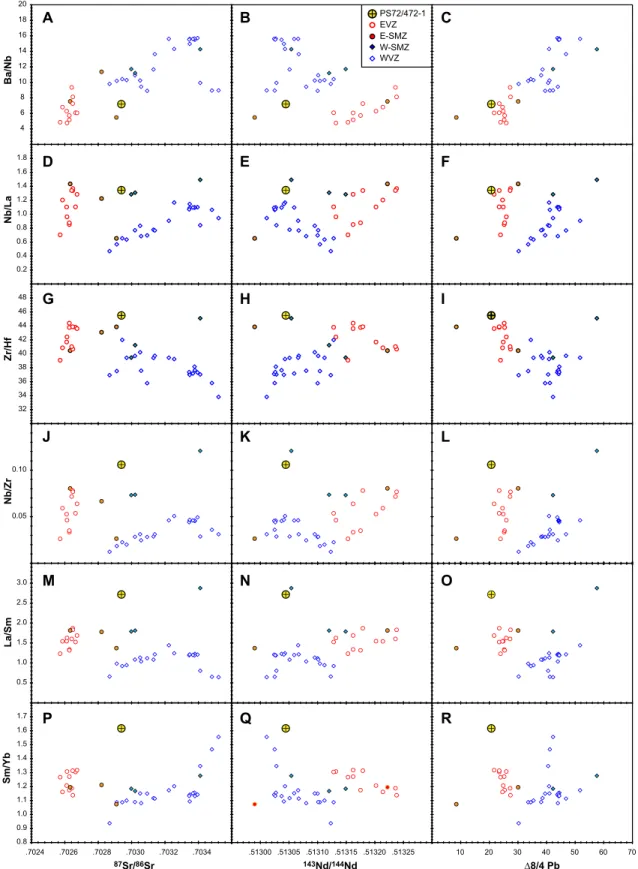
Figure 5.Along‐axis variations of incompatible element ratios of (a) Ba/Nb, (b) Nb/La, (c) Zr/Hf, (d) Nb/Zr, (e) La/Sm, and (f) Sm/Yb in Gakkel lavas (data sources as in Figure 2) and PS72/472‐1 trace differences and similarities in mantle source characteristics beneath the various segments of the Gakkel ridge (WVZ, SMZs, and EVZ; see Figure 1 for the definitions). Ba/Nb has been previously shown (Goldstein et al., 2008; Michael et al., 2003) to be consistently higher in WVZ and W‐SMZ than in EVZ, while that in E‐SMZ appears transitional. PS72/472‐1 has elevated (a) Ba/Nb, (b) Nb/La, and (c) Zr/Hf compared to the closest EVZ lavas and overlaps with EVZ west of 50°E and some E‐SMZ compositions. For element pairs with a larger spread in incompatibility such as (d) Nb/Zr, (e) La/Sm, and (f) Sm/Yb, sample PS72/472‐1 belongs to an infrequent group of similarly enriched samples that are present in all Gakkel segments. Most consistent overlap occurs for E‐SMZ and W‐SMZ except for the lack of similarly high Sm/Yb in E‐SMZ lavas. Along‐axis variations of (g)87Sr/86Sr, (h)143Nd/144Nd, and Pb isotopes expressed as (i) 7/4Pb and (j) 8/4. Other isotope data are from Goldstein et al. (2008) and Nauret et al. (2011).87Sr/86Sr of PS72/472‐1 is higher than that of the EVZ, lies at the low end of the WVZ array, and is matched by some E‐SMZ lavas.143Nd/144Nd of the GRD lava is lower than that found in the EVZ and overlaps with the ranges found in both SMZs and WVZ. The high 7/4Pb of PS72/472‐1 is solely matched by some E‐SMZ and EVZ at 30°E, whereas 8/4Pb groups with EVZ and E‐SMZ consistent with 8/4Pb = 30, marking an isotopic boundary at ~14°E (Goldstein et al., 2008).
Ce/Pb = 23.3 lies well within the MORB–OIB range (25 ± 5; Hofmann et al., 1986), while all Gakkel glasses have an average Ce/Pb = 22.4 ± 5.7 2SD,n= 192). Based on these observations, isotope analysis using whole rock of PS72/472‐1 is considered to compare equally well to other data (Goldstein et al., 2008; Nauret et al., 2011) obtained on glass. Finally, identical87Sr/86Sr = 0.702942 ± 5 (2SE) for the leached chips and87Sr/86Sr
= 0.702939 ± 5 (2SE) for leached powders further confirm that both leaching procedures removed any Sr sea- water (if present at all) equally well and that87Sr/86Sr of this rock can be considered to reflect a pristine magmatic signature.
Along‐axis comparison of the Sr‐Nd‐Pb isotope composition of PS72/472‐1 with the published Gakkel data set (Figure 5) shows that the GRD sample has more radiogenic87Sr/86Sr than EVZ and most E‐SMZ samples and that it straddles at the lower87Sr/86Sr range of the WVZ (Figure 5g).143Nd/144Nd of PS72/472‐1 is less radiogenic than all EVZ and also less radiogenic than many SMZ and WVZ lavas (Figure 5h). Pb isotopes expressed as 7/4Pb and 8/4Pb, denoting the vertical distance from the Northern Hemisphere Reference Line (Hart, 1984) at a given206Pb/204Pb, show that the GRD sample has significantly higher 7/4Pb (=
+2.5) than that of the majority of Gakkel Ridge lavas (7/4Pb =−1.0 to +0.7), but falls in the range of EVZ lavas at 33°E and certain E‐SMZ (7/4Pb = +1.5 to +2.5; Figure 5i). In terms of 8/4Pb, PS72/471‐1 is similar to values of the EVZ and some E‐SMZ (Figure 5j). In summary, the Sr‐Nd isotopic compositions of PS72/471‐1 are consistently more enriched than those found along the EVZ but overlap with SMZ and WVZ lavas. Notably, the high 7/4Pb of PS72/471‐1 is similar to selected E‐SMZ and the westernmost EVZ lavas, while 8/4Pb is alike to EVZ and some E‐SMZ lavas. Atfirst glance, the ambiguity of Sr‐Nd‐Pb isotope signals compared to other Gakkel segments indicates that the GRD sample may have a somewhat unique iso- topicflavor among the Gakkel lavas. The closest match seems with the Sr‐Nd‐Pb isotope ratios displayed by selected E‐SMZ and two westernmost EVZ lavas. These all have concordantly high 7/4Pb that is absent in all other Gakkel lavas.
3.4. 40Ar‐39Ar Age Dating
To provide afirst reliable date for spreading rates at the easternmost end of the Gakkel Ridge, a state‐of‐the‐ art age dating was performed.40Ar/39Ar incremental heating ages on acid‐leached groundmass separates of sample PS72/472‐1 are summarized in Table 2 and show that this basalt erupted 3.65 ± 0.01 Ma (2σ). Full
40Ar/39Ar results, plateau ages, and K/Ca spectra are available as supporting information. We estimate that the 3.7 Ma seamount sample is located approximately 13 km from the axis of spreading, as defined by the projection of the axis of the trough. This implies a full spreading rate of ~7 mm/year.
4. Discussion
4.1. Inferences on Depth and Degree of Mantle Melting at the Gakkel Ridge Deep
The large variations of REE ratios such as La/Sm, Sm/Yb, and La/Yb in glasses (compilation of Gale et al., 2013) and melt inclusions (Shaw et al., 2010; Wanless et al., 2014) throughout the Gakkel Ridge cannot result from variable degrees of partial melting of a single, homogeneous source, especially when considering the high variability of these ratios on a local, presumably zero age scale (Figure 5). Possible exception are the more limited variations at 85°E and 72°E of the EVZ (Wanless et al., 2014). Combined with systematic spatial variations of highly incompatible element ratios and radiogenic Sr‐Nd‐Pb isotope signatures (Figure 5), it is now well established that the mantle beneath the Gakkel Ridge is heterogeneous on local and regional scales, causing the composition of Gakkel melts to reflect a complex interplay of discrete melts from variably enriched sources and their eventual mixing and pooling within the melt column and magma reservoirs (Wanless et al., 2014, and references therein). These authors have carried out a highly detailed study of melt inclusions in olivine and associated volcanic glass at discrete EVZ centers (72°E, 57°E, 39°E, and 31°E, and including the 85°E data from Shaw et al., 2010) that allows them to model melting systematics at high resolu- tion. Their model involves one‐and two‐component systems with permutations of four parent components that include depleted MORB mantle (DMM), previously DMM, pyroxenite veins, and metasomatized DMM. The bestfit model that derives the measured geochemistry is achieved by melting a mix of DMM and metasomatized mantle. Moreover, their modeling indicates an overall decrease in the degree of partial melt from 9–15% at 31°E to 1–6% at 85°E, which correlates positively with the slight decrease of the predicted full spreading rate from 11.09 to 9.93 mm/year (compilation of Gale et al., 2013). Finally, Wanless et al. (2014) also model the average depth of melting in the EVZ mainly in the spinel stabilityfield (approximately 80‐to
40‐km mantle depth for spinel peridotite) with minor (3%) melt contributions in the garnet stabilityfield (>80 km for garnet peridotite) at 31°E, 39°E, and 72°E. Such detailed evaluations are, however, not possible for the GRD based on a single sample of differentiated lava and lack of a representative regional sampling of the magmatic basement. Nevertheless, the alkalinity of the sample basically implies low degrees of partial melt- ing and/or tapping of an enriched source. But the modeled 1–6% partial melting of clean DMM at 85°E (Wanless et al., 2014) cannot generate the element enrichment observed in PS72/472‐1 and thus requires melting of an incompatible element‐enriched source at the GRD. Inversely, the predicted and confirmed full spreading rate at the GRD is approximately 6–7 mm/year, which could ultimately lead to even lower degrees of partial melting predicted by extrapolating the 1–6% DMM melting at 85°E (Wanless et al., 2014). At lower spreading rates the thickness of the lithosphere is expected to be thicker and, thus, to truncate the top of the melt column at greater depth and consequently lower the extents of mantle melting (Reid & Jackson, 1981).
In summary, even at the lowest possible degree of melting, DMM melting cannot yield the enriched geochem- istry of PS72/472‐1, thus requiring melting of a geochemically enriched source at the GRD.
4.2. Implications of Mantle Source Signals Along the Gakkel Ridge and GRD
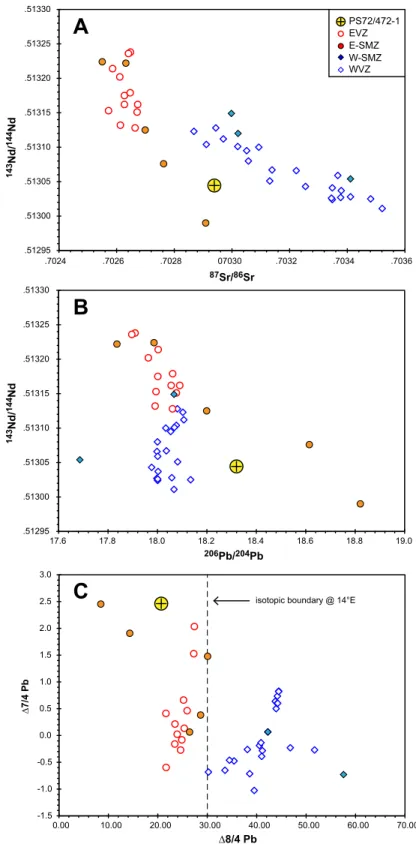
Based on Sr‐Nd‐Pb isotope (and trace element) ratios, Goldstein et al. (2008) show that the SMZ houses an abrupt mantle compositional boundary around 14°E (Figure 5). Basalts to the west of it (WVZ) feature DUPAL‐like (Hart, 1984) source characteristics attributed to shallow recycling of delaminated subcontinen- tal lithospheric mantle during the opening of the Arctic Basin (Goldstein et al., 2008). Counterintuitively, basalts to the east (EVZ) are closest to the Eurasian continent, and generated at the slowest spreading rates, they display isotopic affinities to depleted upper oceanic mantle (DMM), the common source of MORB with incompatible element ratios close to E‐MORB. The Sr‐Nd‐Pb isotopic composition of PS72/472‐1 consis- tently plots with three isotopically enriched samples of the E‐SMZ and two of the EVZ in Pb space and lies within or close to the combinedfield of EVZ and E‐SMZ in multi‐isotope space (Figures 6a–6c). These rela- tions imply that volcanism at the GRD taps a roughly similar isotopic source as for volcanism in the E‐SMZ.
Ratios of elements with similar incompatibility such as Ba/Nb, Nb/La, and Zr/Hf versus Sr‐Pb isotope ratios (Figures 7a–7i) confirm a compositional association between PS72/472‐1 and E‐SMZ and EVZ lavas with respect to87Sr/86Sr and 8/4Pb, but for143Nd/144Nd this relation is ambiguous. For element pairs with a lar- ger spread in incompatibility such as Nb/Zr, La/Sm, and Sm/Yb (Figures 7i–7r) the GRD sample plots above the combined E‐SMZ–EVZfield. These offsets suggest that the GRD source despite being isotopically similar to some E‐SMZ and EVZ lavas has elevated Nb/Zr, La/Sm, and Sm/Yb. Since the number of samples with fully characterized element and isotope data is limited (~40 with Sr‐Nd‐Pb isotope data versus ~200 with major and trace element data), the discrepancy could reflect analytical bias and/or relate to variable portions of source heterogeneities contributing to the melt process.
The large variations in trace element ratios in E‐SMZ and EVZ west of 55°E (Figure 5) indicates melting of a heterogenous mantle (Wanless et al., 2014, and references therein). According to Wanless et al. (2014), EVZ volcanism is best explained by melting of DMM mixed with metasomatized mantle together with a spatially systematic increase in metasomatized mantle in the EVZ source from 10% at 57°E to a 60% peak in the E‐
SMZ at 31°E. Thesefindings imply that the volume of metasomatized mantle is not homogeneously distrib- uted within the upper mantle beneath the Gakkel Ridge and can be even absent as suggested for the 72°E and 85°E centers (Wanless et al., 2014). In these areas the degree of melting is modeled, respectively, at 3–
9% and 1–6% of a homogeneous DMM source. Importantly, the presence of any, more fusible metasomatized mantle leads to a mismatch between the modeled and observed chemistry of erupted glasses and melt inclu- sions in olivine (Wanless et al., 2014).
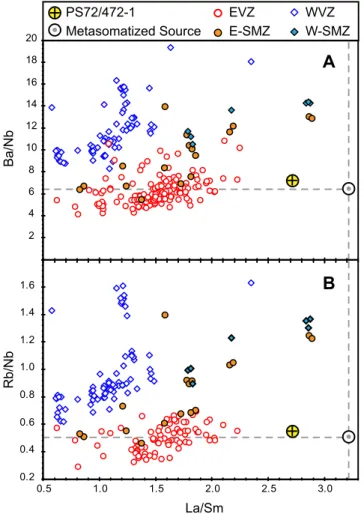
The GRD is located more than 650 km from the nearest sampled site of volcanism at 85°E, where mantle melting exclusively taps DMM (Wanless et al., 2014), and 900 km from the nearest sampling of metasoma- tized mantle at 57°E. Correlations of La/Sm as an indicator of enrichment versus Ba/Nb and Rb/Nb as an approximation of source‐specificfinger prints (Figures 8a and 8b) show that PS72/471‐1 lies at the extension of the EVZ array and below E‐SMZ samples with similarly elevated La/Sm. Notably, PS72/471‐1 lies close to the composition of the metasomatized source (Laubier et al., 2012) used by Wanless et al. (2014). These observations confirm that the GRD probes an enriched, most likely metasomatized portion of EVZ (–E‐ SMZ)‐type mantle.
Table2 40 Ar/39 ArGroundmassIncrementalHeatingExperimentsforGakkelRidgeSamplePS72/472‐1. SampleinformationPlateauNormalisochronInverseisochronTotalfusion ExperimentSampleAge±2σ(i)39 Ar(%)K/CaMSWDnNAge±2σ(i) 40 Ar/36 Ar intercept±2σMSWDAge±2σ(i)
40 Ar/36 Ar intercept±2σMSWDAge±2σ(i)K/Ca 17D20242PS72‐472‐1a3.66±0.01Ma680.1841.0412243.66±0.02Ma299.66±4.561.593.66±0.02Ma299.54±4.621.613.63±0.01Ma0.197 17D30201PS72‐472‐1c3.65±0.01Ma1000.070.9424243.65±0.02Ma294.92±2.8013.65±0.02Ma295.25±2.810.983.65±0.01Ma0.13 Note.aandcdenotesubsamplesfromdifferentpartsofthePS72‐472‐1pillowbasalt.200‐180μm;1NHCl(60min);6NHCl(60min);1NHNO3(60min);3NHNO3(60min);Mill‐Q(60min).
There are several potential explanations for the presence of such a mantle source almost 900 km from the nearest demonstrated occurrence of this material. In the absence of basement sampling between 85°E and the GRD at 121°E, no inference can be made about whether the volume of metasomatized mantle gradually increases eastward in a similar, spatially systematic fashion as is the case in the EVZ to E‐SMZ or if such material occurs as irregularly sized domains along the easternmost Gakkel Ridge. The ultraslow spreading at the GRD (6–7 mm/year) limits passive mantle upwelling. Along regular mantle adiabats only the most fusible material is then likely to melt under such conditions, leading to extraction of the purest possible melt from metasomatized mantle, because DMM will not melt, or if it did, only to a very limited extent. This idea is consistent with the more elevated Nb/Zr, La/Sm, and Sm/Yb in the GRD lava compared to the E‐SMZ where the DMM contribution is modeled to 40%. In summary, GRD volcanism appears to be fed from a metasomatized mantle similar to mantle found in the E‐SMZ and the western part of the EVZ. The ultraslow spreading at the GRD drives mantle upwelling to such low rates that only the most fusible material melts.
The distribution pattern of metasomatized mantle beneath the easternmost Gakkel Ridge can only be resolved by further sampling. Similarly, the melting systematics beneath the GRD can only be more fully understood if samples cover a larger compositional and age range. So far, PS72/472‐1 provides only a glimpse into an alkaline melting event 3.65 Ma. Whether this was a single event, pulsating or even continuous, and whether other GRD melts include contributions from DMM must remain unresolved without further sampling.
4.3. Formation and Causes of the GRD
The infrequent volcanism of the SMZ is likely to reflect relatively low degrees of mantle melting in localized zones that are prone to less frequent sampling of compositionally more extreme part of a heterogeneous mantle source region. In this regard, it is interesting that Cochran (2008) note that magmas erupted between the SMZ and EVZ magmatic centers appear to have ascended along faults.
Assuming that the GRD is bounded to the north and south by volcanic centers/ridges, the long‐lived nature of GRD magmatism (≥3.7 Ma) supports the notion that once established, volcanic centers will tend to main- tain themselves as low‐viscosity conduits for melts to the surface even in this end‐member scenario (Cochran et al., 2003; Dick et al., 2003). Magmatism might be focused initially into discrete centers along the easternmost part of Gakkel Ridge and was linked to a source region that has undergone prior geochemical enrichment.
Another characteristic feature of ultraslow spreading ridges are unusual deep earthquakes in the upper man- tle (Jokat et al., 2012; Schlindwein et al., 2013; Schlindwein & Schmidt, 2016), which is very rarely observed at slow and faster mid‐ocean ridges. In general, the distribution of the earthquakes down to 40 km along the Knipovich and Southwest Indian ridges and likely also the Gakkel Ridge (Schlindwein et al., 2005) indicate that the uppermost mantle between focused magmatic centres/ridges behaves in a brittle manner. In strong contrast, areas with focused magmatism along the investigated ultraslow spreading ridges show only few earthquakes in the warmer, upper mantle.
The unusual deepness of the GRD in conjunction with limited sediment infill is unique in comparison to the adjacent basins, and thus, the formation of the GRD is enigmatic. Two models exist to explain the feature.
Piskarev and Elkina (2017) propose that the GRD is a caldera formed by a large‐scale, explosive volcanic eruption around 1 million years ago and that this system operated on a similar scale as did“supervolcanoes” such as Yellowstone. This view is not supported by ourfindings since the alkaline nature of PS72/472‐1 points to a low‐volume magmatic system rather than to a large silicic magma reservoir typical of a supervol- cano. Systematic GRD basement sampling and geochemical characterization of the volcanic material in the reference sedimentary core located about 1,000 km from the Gakkel Ridge (Piskarev & Elkina, 2017) are required to link the GRD with a large‐scale, explosive volcanic event. Nevertheless, explosive release of vola- tiles on the Gakkel Ridge is evident from unconsolidated pyroclastic deposits blanketing the rift valley at 85°
E, which seems to be linked to the discharge of CO2that accumulated in (possibly deep) crustal melt reser- voirs (Pontbriand et al., 2012; Sohn et al., 2008). Thus, the subsequent buildup and explosive discharge of volatile‐rich magmatic foams together with the fact that the GRD is rimmed by several volcanoes that acted as a dam might have played a role in keeping the GRD devoid of sediments. Thus, in our model the GRD is a consequence of focused magmatism along transverse basement ridges. In the western part of Gakkel Ridge a
Figure 6.Isotope correlation diagrams of (a)87Sr/86Sr versus143Nd/144Nd, (b)206Pb/204Pb versus143Nd/144Nd, and (c) 8/4Pb versus 7/4Pb. The Delta () notation translates to the vertical deviation from the Northern Hemisphere Reference Line after Hart (1984). Note that the Pb isotope data of Goldstein et al. (2008) and Nauret et al. (2011) are renormalized to the GEOMAR NBS981 values to adjust for small‐scale analytical differences between these high‐precision data sets. In Sr‐Nd isotope space (a), WVZ and EVZ separate reasonably well into distinct arrays. The GRD lava broadly aligns with the steep correlation displayed by the
combined EVZ and E‐SMZ data and lies below the WVZ Sr‐Ndfield. Although143Nd/144Nd are differential in EVZ and WVZ, they broadly overlap in206Pb/204Pb (b). In this respect, the GRD lava aligns vaguely with the broad, correlatedfield of EVZ and E‐SMZ lavas and groups with the few data from E‐SMZ. In 7/4Pb versus 8/4Pb space, the GRD lava aligns with a subgroup of similar high‐7/4Pb EVZ and E‐SMZ lavas. After Goldstein et al. (2008), 8/4 = 30 marks a distinct
compositional boundary between WVZ + W‐SMZ (≥30) and EVZ + E‐SMZ (≤30).
Figure 7.(a–r) Correlation diagrams of87Sr/86Sr,143Nd/144Nd and 8/4Pb versus Ba/Nb, Nb/La, Zr/Hf, Nb/Zr La/Sm, and Sm/Yb. For element pairs with similar incompatibility (Ba/Nb, Nb/La, and Zr/Hf) the GRD lava aligns with the EVZ–E‐SVZ array in87Sr/86Sr and 8/4 space but falls short for143Nd/144Nd. For element ratios with a larger spread in incompatibility such as Nb/Zr, La/Sm, and Sm/Yb, PS72/472‐1 lies clearly above the EVZ and WVZ arrays. Again, a tentative grouping to the EVZ–E‐SMZfield can only be made for87Sr/86Sr and 8/4Pb. The apparent contradiction to Figure 5 where the enrichment of PS72/472‐1 is consistently in agreement with a few W‐SMZ and E‐SMZ lavas reflects the lack of complementary Sr‐Nd‐Pb isotope data and/or the GRD lava being dominated by contributions from an enriched source.
total of six volcanic transverse ridges (Figure 1d, blue dashed lines) are observed, which indicate the locations of focused magmatism. Such ridges are difficult to identify in the eastern part, since they are almost covered by thick sediments. The most recent bathymetric data, however, show indications that such ridges also exist between the EVZ and the GRD.
We speculate that at least four more volcanic ridges (Figure 1d, dashed yellow lines) exist, and the GRD is part of this segmentation. Finally, while our conclusions cast no doubt on the principal findings of Piskarev and Elkina (2017), we suggest that the source area for the unu- sual sediment composition in their reference core was located somewhere in the Arctic, but not in the vicinity of the GRD.
Estimations of spreading rates along ultraslow spreading ridges are diffi- cult, since a magnetic anomaly might contain several different magnetic reversals. They cannot be discriminated by shipborne or aeromagnetic surveys because of the large distance of several kilometers between the magnetic source and the sensors. Thefirst published spreading rates from Karasik (1968) and Vogt et al. (1979) had since then a profound influence on the tectonic interpretation of the Gakkel Ridge. Global studies of plate movements (NUVEL‐1A; DeMets et al., 1994) also suggested that the full Gakkel Ridge spreading rate decreases from 13 mm/year along the wes- tern part of the ridge to 6 mm/year close to the Laptev Sea (Jokat &
Schmidt‐Aursch, 2007; Karasik, 1968; Vogt et al., 1979). Since then, no rock age dating from the Gakkel Ridge rift valley was available to confirm or withdraw their interpretation. Our40Ar/39Ar age of the rock sample from the GRD is in excellent agreement with these studies. Our calculated full spreading rate of 7 mm/year is thefirst direct age dating confirming the presence of extreme ultraslow spreading rates close to the Laptev Sea.
5. Conclusions
Our observations suggest that the almost sediment‐free GRD is the result of interplay between the active Gakkel rift zone, mantle heterogeneities, focused magmatism, rimming volcanoes, and possibly the episodic removal of sediment cover by a volatile buildup and release. The deep rift valley bounded to the north and south by large volcanoes/ridges (?) and distinct mantle source geochemistry allow us to interpret the GRD as the easternmost SMZ. If true, this would indicate that the geometry and geochemistry of the SMZ represent the end‐member of seafloor spreading models. The presented petrological/geophysical data strongly suggest that focused magmatism remains the controlling process for seafloor spreading even at the extreme end of ultraslow spreading rates. The age dat- ing of a single rock sample confirms an ultraslow full spreading rate of ~7 mm/year as suggested from aero- magnetic and global GPS data.
References
Brozena, J. M., Childers, V. A., Lawver, L. A., Gahagan, L. M., Forsberg, R., Faleide, J. I., & Eldholm, O. (2003). New aerogeophysical study of the Eurasia Basin and Lomonosov Ridge: Implications for basin development.Geology,31, 825–828.
Cochran, J. R. (2008). Seamount volcanism along the Gakkel Ridge, Arctic Ocean.Geophysics Journal International,174, 1153–1173.
https://doi.org/10.1111/j.1365‐246X.2008.03860.x
Cochran, J. R., Kurras, G. J., Edwards, H., & Coakley, B. J. (2003). The Gakkel Ridge: Bathymetry, gravity anomalies, andcrustal accretion at extremely slow spreading rates.Journal of Geophysical Research,108(B2), 2116. https://doi.org/10.1029/2002JB001830
DeMets, C., Gordon, R. G., Argus, D. F., & Stein, S. (1994). Effect of recent revisions to the geomagnetic reversal time scale on estimates of current plate motions.Geophysical Research Letters,21(20), 2191–2194.
Dick, H. J. B., Lin, J., & Schouten, H. (2003). An ultraslow‐spreading class of ocean ridge.Nature,426(6965), 405–412. https://doi.org/
10.1038/nature02128
Gale, A., Dalton, C. A., Langmuir, C. H., Su, Y., & Schilling, J.‐G. (2013). The mean composition of ocean ridge basalts.Geochemistry, Geophysics, Geosystems,14, 489–518. https://doi.org/10.1029/2012GC004334
Figure 8.Correlation diagrams of La/Sm versus (a) Ba/Nb and (b) Rb/Nb showing the GRD lava to lie at the extension of EVZfield, suggesting that PS72/471‐1 samples an enriched EVZ component that is unsampled in EVZ.
At similarly high La/Sm, SVZ lavas display significantly higher Ba/Nb and Rb/Nb than does the GRD lava, indicating that the GRD component is unique in at least these ratios. Notably, PS72/471‐1 plots near the metaso- matized source of Laubier et al. (2012) (large circle and dashed lines) used by Wanless et al. (2014) to model trace element variability along the EVZ. See text for details.
Acknowledgments
We thank the captain and crew of RV Polarsternas well as the geophysical team for their excellent support during cruise ARK‐XXVIII/4. We are grateful to Laura Jensen and Boris Dorschel, who provided us with bathymetric maps. These swath bathymetric data are available from Pangaea (https://doi.
pangaea.de/10.1594/
PANGAEA.908277). All datafiles for the40Ar/39Ar dating can be found in the supporting information. We thank Peter Michael, Marcel Regelous, and an anonymous reviewer for their comments, which greatly enhanced the paper.