Behavioural reactions of cod (Gadus morhua) and plaice (Pleuronectes platessa) to sound
resembling offshore wind turbine noise
Dissertation
zur Erlangung des akademischen Grades d o c t o r r e r u m n a t u r a l i u m
(Dr. rer. nat.) im Fach Biologie eingereicht an der
Mathematisch-Naturwissenschaftlichen Fakultät I der Humboldt-Universität zu Berlin
von
Diplom-BiologinChristina Müller geb. 31. Dezember 1966 in Berlin
Präsident der Humboldt-Universität zu Berlin Prof. Dr. Christoph Markschies
Dekan der Mathematisch-Naturwissenschaftlichen Fakultät I Prof. Dr. Christian Limberg
Gutachter: 1. Prof. Andreas Elepfandt 2. Prof. Werner Kloas
3. Prof. Per Stockfleth Enger eingereicht am: 1. August 2007 Datum der Promotion: 20. Dezember 2007
Table of content
SUMMARY...7
DEUTSCHE ZUSAMMENFASSUNG ...9
1 INTRODUCTION...11
1.1 Project overview ...11
1.2 General background and state of research ...12
1.2.1 Offshore wind technology in Europe ...12
1.2.2 Acoustic field in offshore wind farms ...13
1.2.3 Hydroacoustics...15
1.2.3.1 Sound in water and in air ...15
1.2.3.2 The acoustical near and far field ...16
1.2.3.3 Acoustic in tanks ...18
1.2.3.4 Interferences ...18
1.2.4 Fish and sound...19
1.2.4.1 Hearing ability in fish ...19
1.2.4.2 Hearing in cod and plaice...22
1.2.4.3 Reaction of fish to anthropogenic noise ...26
1.2.4.4 Results from offshore wind farm research ...29
1.2.4.5 Hearing threshold shift and inner ear damage ...32
1.2.5 Biology of plaice and cod ...33
1.2.5.1 Biology of cod...33
1.2.5.2 Biology of plaice ...34
1.2.5.3 Stocks of cod and plaice in the North Sea ...36
2 ISSUE OF THE INVESTIGATION ...37
3 MATERIAL AND METHODS...39
3.1 Experimental fish...39
3.1.1 Cod (Gadus morhua)...39
3.1.2 Plaice (Pleuronectes platessa)...40
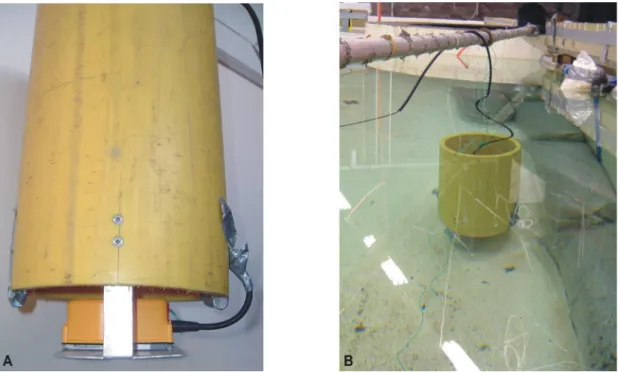
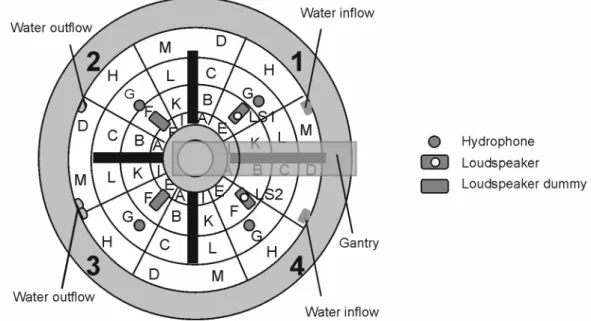
3.2 Experimental tank...41
3.3 Experimental settings ...42
3.3.1 Sound barriers...44
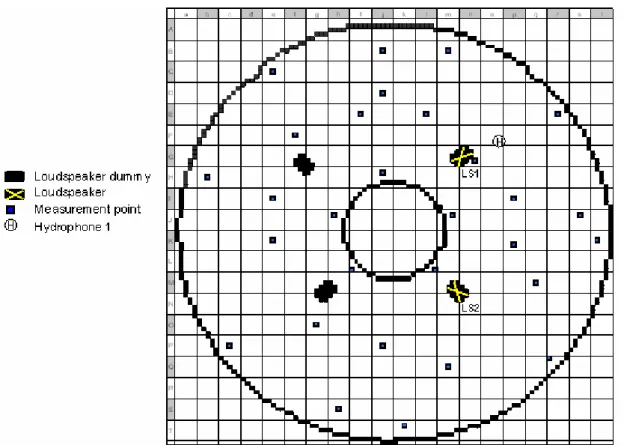
3.3.2 Sound production and measurement ...45
3.3.5 Hydrodynamic measurements...49
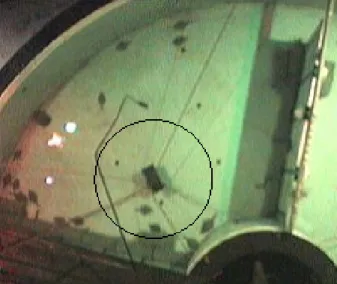
3.4 Video surveillance equipment...52
3.5 Experimental set up ...52
3.5.1 Sound experiments ...52
3.5.2 Habituation in plaice ...53
3.6 Evaluation of videos...53
3.6.1 Distribution and behaviour...53
3.6.2 Loudspeaker vicinity analysis...55
4 RESULTS ...57
4.1 Acoustic field in the experimental tank...57
4.1.1 Acoustic field with sound barriers...57
4.1.1.1 Sound field using a sound source in quarter 4...62
4.1.1.2 Background noise ...63
4.1.2 Acoustic field without sound barriers...65
4.2 Behavioural experiments...71
4.2.1 Experiments using cod ...71
4.2.1.1 Observations without sound production ...71
4.2.1.1.1 General behavioural ...71
4.2.1.1.2 Distribution of cod in the tank ...71
4.2.1.1.3 Diel rhythm in cod...72
4.2.1.1.4 Feeding...73
4.2.1.2 Behaviour of cod during sound production...74
4.2.1.2.1 Tested frequency of 25 Hz ...74
4.2.1.2.2 Tested frequency of 60 Hz ...76
4.2.1.2.3 Tested frequency of 90 Hz ...78
4.2.1.2.4 Tested frequency of 125 Hz ...80
4.2.1.2.5 Tested frequency of 250 Hz ...82
4.2.1.2.6 Loudspeaker vicinity evaluation...83
4.2.1.3 Recapitulation of cod results ...86
4.2.2 Experiments using plaice ...87
4.2.2.1.2 Distribution of plaice in the tank...87
4.2.2.1.3 Diel rhythm in plaice ...88
4.2.2.1.4 Feeding...93
4.2.2.2 Behaviour of plaice during sound production ...94
4.2.2.2.1 Tested frequency of 25 Hz ...94
4.2.2.2.2 Tested frequency of 60 Hz ...96
4.2.2.2.3 Tested frequency of 90 Hz ...98
4.2.2.2.4 Tested frequency of 125 Hz ...100
4.2.2.2.5 Tested frequency of 250 Hz ...102
4.2.2.2.6 Loudspeaker vicinity evaluation...104
4.2.2.2.7 Habituation of plaice to sound ...105
4.2.2.3 Recapitulation of plaice results ...109
5 DISCUSSION...111
5.1 Experimental results ...111
5.1.1 Hydroacoustic field in the tank ...111
5.1.1.1 Effect of boundaries on the sound field...111
5.1.1.2 Resonant frequency of the tank ...112
5.1.1.3 Comparison of sound level decrease in the tank with field conditions ...112
5.1.1.4 Hydrodynamic field...112
5.1.2 Behavioural experiments...113
5.1.2.1 Cod...113
5.1.2.1.1 Behaviour of cod in the tank ...114
5.1.2.1.2 Reaction of cod to sound...115
5.1.2.2 Plaice ...117
5.1.2.2.1 Behaviour of plaice in the tank...118
5.1.2.2.2 Reaction of plaice to sound ...119
5.1.2.2.3 Habituation of plaice to sound ...120
5.2 Potential effects of offshore wind farms on fish ...120
LITERATURE...125 APPENDIX ...I
Abbreviations and Acronyms used in the Thesis
BEOFINO Ökologische Begleitforschung zur Windenergienutzung im Offshore-Bereich auf Forschungsplattformen in der Nord- und Ostsee (Ecological research on the impact of Offshore Wind farms based on research platforms in the North and Baltic Sea)
BfN Bundesamt für Naturschutz (Federal Agency for Nature Conservation)
Blim limit biomass
Bpa precautionary biomass
cacodylate buffer sodium cacodylate trihydrate buffer dB decibel
dB re 1 µPa decibel relative to a reference of 1 micro Pascal e.g. for example (Latin exempli gratia)
et al. and others (Latin et alii)
FRS Marlab Fisheries Research Services Marine Laboratory
GW Gigawatt (1,000,000,000 Watt)
h hour
H hydrophone Hz Hertz
IfaF Institut für angewandte Fischbiologie (Institute for applied fish biology)
IfaÖ Institut für angewandte Ökologie (Institute for applied Ecology) ITC International Transducer Corporation
KHz Kilohertz kW Kilowatt lg logarithm LS loudspeaker
MINOS Forschungsprojekt Marine Warmblüter in Nord- und Ostsee (Research project Marine warm-blooded animals in the North and Baltic Seas)
MW Megawatt (1,000,000 Watt)
pers. personal
rms root mean square
S.D. standard deviation
SSB spawning stock biomass
TL total length
UK United Kingdom
USRL Underwater Sound Reference Laboratory, US Navy UV ultraviolet
Summary
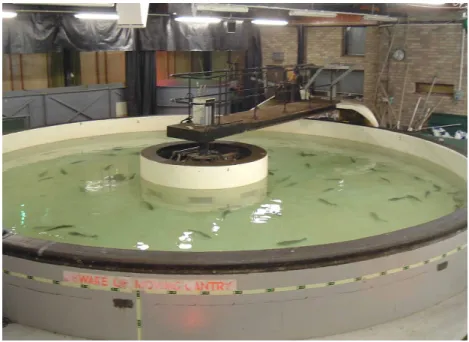
Effects of low frequency sound such as emitted by offshore wind turbines on fish were investigated in an annular tank with 10 m diameter filled with sea water 1.26 m deep. The tank was divided in neighbouring quarters by sound barriers, so that sound pressure differences of 32 to 52 dB were achieved. The experimental fish were free to move around in the tank and therefore could avoid high sound levels. Spontaneously, the fish preferred one of the quarters. Therefore the experimental sound was produced in that quarter by an under- water loudspeaker to test whether the fish would leave that quarter during sound production.
For the investigations, cod and plaice were chosen as two important North and Baltic Sea species with differently pronounced hearing abilities. In both species, juveniles and adults were tested. With every group of fish, 9 to 10 experiments were done, consisting of 24 hours continuous pure tone production followed by 5 days of recovery. Five frequencies between 25 and 250 Hz and sound levels of 130 and 140 dB re 1 µPa were chosen.
The 24 hour periods before, during, and after sound production were evaluated by registering the fish number, their distribution and their behaviour in the tank quarter containing the sound source, using continuous video surveillance with overhead cameras.
Cod
15 juvenile (32 - 53 cm TL) and 13 adult (56 - 72 cm TL) cod were tested. Activity was higher in daytime, which was more pronounced in juvenile cod. Except for 250 Hz, in most experiments significantly less fish were observed in the preferred quarter during sound production, than in the periods before and after, but the quarter was not left completely.
Reactions were most pronounced at 60 Hz and 90 Hz.
From these results escape in some measure of cod from sound in the vicinity of offshore wind farms would be expected. The one day duration of the sound does not allow conclusions, however, whether the escape would be permanent.
Plaice
20 juvenile (24 - 32 cm TL) and 20 adult (26 - 43 cm TL) plaice were tested. Without sound, the preference for one tank quarter was very strong in adults and less pronounced in juveniles. The fish showed a diel rhythm with higher activity in daytime, which was more obvious in adults than in juveniles. During sound production reactions were inconsistent in that both avoidance or attraction were found. Dependence on frequency or sound level was not found, nor was complete avoidance of the preferred quarter.
When specimens were added to the tank while the sound was being played in the preferred quarter settlement was delayed.
The results indicate that plaice detected the sound but the type of reaction was variable.
They suggest that permanent avoidance of offshore wind farm areas would not be expected.
Reaction thresholds
Behavioural reactions could be observed at sound levels of less than 30 dB above the detection threshold. The results are discussed in connection with different thresholds presented by other authors indicating the urgent need for further research to define reliable reaction thresholds.
Deutsche Zusammenfassung
Die Auswirkungen von tieffrequentem, den Emissionen von Windfarmen ähnelndem Schall auf Fische wurden in einem ringförmigen Versuchsbecken mit 10 m Durchmesser und 1,26 m Tiefe untersucht. Das Versuchbecken war mit schallisolierenden Wänden in verbundene Viertel unterteilt, was zu Schalldruckdifferenzen von 32 bis 52 dB im Becken führte. Die Versuchsfische konnten sich frei im Becken bewegen und so hohen Schalldruckpegeln ausweichen. Aufgrund einer Präferenz der Fische für ein bestimmtes Beckenviertel erfolgte die Schallproduktion in diesem Viertel.
Die Experimente wurden mit Scholle und Kabeljau als zwei wichtigen Nord- und Ostseearten mit unterschiedlich ausgeprägtem Hörvermögen in zwei verschiedenen Altersklassen (juvenil und adult) durchgeführt. Jede Versuchsfischgruppe durchlief eine Reihe von 9 bis 10 Einzelversuchen, die jeweils aus einer 24-stündigen Beschallung und fünf Tagen Erholungsphase bestanden. Schall wurde in fünf Frequenzen zwischen 25 und 250 Hz mit Schalldruckpegeln von 130 und 140 dB re 1µPa produziert.
Mit Hilfe von Videokameras über dem Versuchsbecken wurden die Fische im Becken überwacht. Ausgewertet wurde die Anzahl, Verteilung und das Verhalten der Fische im bevorzugten Beckenviertel in den 24 Stunden vor, während und nach Schallproduktion.
Kabeljau
Es wurden 15 juvenile (32 - 53 cm TL) und 13 adulte (56 - 72 cm TL) Kabeljau getestet. Die Aktivität war am Tag höher, was bei juvenilen Kabeljau stärker ausgeprägt war. Außer bei der Frequenz 250 Hz zeigten sich in vielen der Versuche deutliche Reaktionen auf den Schall mit signifikant weniger Fischen im bevorzugten Beckenviertel im Vergleich zu den Phasen ohne Beschallung. Jedoch verließen nicht alle Tiere das beschallte Beckenviertel.
Am stärksten waren die Reaktionen in den Versuchen mit 60 und 90 Hz.
Die Ergebnisse lassen schallbedingte Vermeidung von Gebieten in und um Windparks durch Kabeljau erwarten. Eine Einschätzung über mögliche Gewöhnung an den Schall kann aus den vorliegenden Ergebnissen nicht abgeleitet werden.
Scholle
Es wurden 20 juvenile (24 - 32 cm TL) und 20 adulte (26 - 43 cm TL) Schollen getestet.
Ohne Beschallung zeigten besonders die adulten aber auch die juvenilen Schollen eine stark ausgeprägte Präferenz für ein Beckenviertel. Schollen zeigten einen Tag-Nacht-Rhythmus mit höherer Aktivität am Tag, der bei den Adulten stärker ausgeprägt war als bei den Juvenilen. Auf den Schall reagierten die Schollen uneinheitlich mit sowohl Vermeidung als auch Attraktion. Es zeigte sich keine klare Abhängigkeit des Verhaltens, weder von Frequenzen noch von Schalldruckpegeln, und auch keine vollständige Meidung des bevorzugten Beckenviertels.
Wurden Schollen während Schallproduktion ins Versuchsbecken eingesetzt, zeigte sich eine verzögerte Ansiedlung im bevorzugten Beckenviertel.
Die Ergebnisse deuten darauf hin, dass Schollen den Schall wahrnehmen können, ihn aber nicht durchgängig meiden.
Reaktionsgrenzen
Es konnten Verhaltensänderungen auf Schall, der weniger als 30 dB oberhalb der Wahrnehmungsgrenze lag, nachgewiesen werden. Im Vergleich mit den von anderen Autoren angegebenen Reaktionsgrenzen ergibt sich dringender Forschungsbedarf um verlässliche Grenzwerte definieren zu können.
1 Introduction
1.1 Project overview
While the increased use of offshore wind energy is desirable for climate protection, offshore wind farms will have an impact on the marine life in the vicinity of the turbines as artificial structures may attract different species and will influence sediment movements, noise will be emitted and electro magnetic field changes will appear in the direct vicinity of the cables (ELSAM ENGINEERING &ENERGI E2 A/S 2005). For this reason studies on the influence of offshore wind farms on marine life are necessary to identify potential disturbance of marine organism and birds in order to minimize these effects. A number of studies have investigated the influence of offshore wind farms on the marine environment such as MINOS (marine mammals and birds) and BEOFINO (benthos) funded by the German Government (MÜNTER 2004).
Awareness of the vulnerability of marine mammals to man-made noise is relatively high in science, public, industry and government agencies and is the subject of a number of research projects and publications (e.g. RICHARDSON et al. 1995, ERBE & FARMER 2000, SOUTHALLETAL. 2000, TEILMANN ET AL. 2002, HAMMOND ET AL. 2002, KOSCHINSKI ET AL. 2003).
Interest in the influence of anthropogenic sound on fish has mainly been restricted to the scientific community and hardly discussed in public. A number of studies have been carried out, some of which have included wind farm noise specifically (see section 1.2.4.4).
Research on potential disturbance of fish is important for fisheries that already suffer from low catch rates caused by decreasing fish stocks in Atlantic, North and Baltic Sea (ZIMMERMANN &GRÖHSLER 2004). But especially in fish populations it is difficult to examine disturbing factors in the open sea. Reactions in the wild are a combined effect of a number of variable factors and the size of fish stocks is varying largely with time (ICES 2006, HOFFMANN
et al. 2000, KARASIOVA &ZEZERA 2005).
One subject of concern is low frequency sound emitted by the offshore turbine pile during operation. Noise emitted by offshore wind farms could stress animals or might disturb communication. Sound is an important means of orientation and communication for many marine animals especially in low light levels and impaired vision (TAVOLGA 1974, KRAAN &
VAN ETTEN 1995). Sound can be transferred fast and far underwater (HAWKINS &MYRBERG
JR 1983) and low frequencies can travel over extremely long distances (WILLE 1986).
In the open sea it is difficult to examine whether sound emissions have an impact on the behaviour of fish for a number of reasons:
Ö
the sound cannot be isolated from other biotic and abiotic factors influencing behaviourÖ
Offshore wind farms with turbine sizes like those planned in the North and Baltic Seas are not yet built.Ö
Offshore field experiments are logistically difficult and expensive to carry outTherefore, fish were tested in tank-based experiments where a controlled sound pressure difference in defined sound fields could be created. As model species plaice and cod were chosen as representatives for North and Baltic Seas species with differently pronounced hearing abilities.
1.2 General background and state of research
1.2.1 Offshore wind technology in EuropeThe number of offshore wind farms planned or already built in European waters has been increasing rapidly over the last ten years (SUNBEAM 2006). At the end of 2004 offshore wind farms totalling approximately 700 MW were installed in Europe, mainly in Danish and UK waters (SUNBEAM 2006). At the same time more than 43,000 MW offshore wind farm capacity was planned for European waters. Existing large scale wind farms as Horns Rev (Denmark, 80 turbines) and North Hoyle (UK, 30 turbines) contain turbines of 2 MW. A few larger turbines of up to 4.5 MW have been tested but are not ready for large scale wind farms yet. Information about the mentioned wind farms are given in Table A 1 (appendix).
The capacity of wind energy worldwide reached a total of more than 58,500 MW by the end of 2005, of which nearly 70% was from Europe (DEWI 2006). Worldwide, wind energy currently delivers 1% of electricity. It is expected that an overall capacity of 132,000 MW will be in place by 2010 (DEWI 2006) and the European Wind Energy Association has set a target of 70 GW wind energy installed offshore by 2020 (GREENPEACE 2005). Wind farms need to be located in areas with suitably high amounts of wind. Their construction can be contentious due to issues of noise emission and impact of the turbines on the landscape.
Being densely populated, the capacity for onshore wind farms in Europe is restricted. At sea, wind speeds are considerably higher and more predictable than onshore. At most of the suit- able offshore sites in northern European waters, the wind is expected to deliver between
hand the construction of offshore wind farms and the connection to the onshore cable grid is more expensive.
1.2.2 Acoustic field in offshore wind farms
Not many sound measurements have been carried out at offshore wind turbines and those that exist are mostly confined to single turbines (e.g. WESTERBERG 2000, DEGN 2000, ENGELL-SØRENSEN 2002). The sound spectrum close to a sound source differs from the spectra at greater distances since different frequencies are emitted at different sound levels.
Therefore, not only the wavelength but also the sound level of single frequencies alters the frequency spectrum of the sound with the distance. The sound field produced by a single turbine will differ from the sound field produced by multiple turbines. With distances of some hundred meters (e.g. Robin Rigg/Scotland, 450 m, Nysted (Rødsand)/ Denmark, 850 m) to each other and a large number of turbines, wind farms become a large-scale sound source influencing not only the wind farm area but also the surroundings. Sound waves of single turbines can join together and interferences can occur with local sound pressure peaks and dips. Sound levels and frequency spectra of offshore wind turbine emissions will depend on the turbine type, the foundation, water depth and seabed conditions. DEGN (2000) predicted sound emissions for 2-MW turbines with concrete or monopile foundations (Fig. A 1 and Fig. A 2, appendix) and expected higher sound levels in frequencies below 50 Hz using concrete compared with the monopile foundations. Measurements of sound emissions of offshore wind turbines exist for smaller turbines such as the 1.5-MW turbines in Utgrunden (Sweden) (INGEMANSSON 2003, Fig. A 3, appendix). The sound spectrum of a 4.5-MW offshore turbine with monopile foundation has been predicted (DEWI 2004) to give sound levels with a maximum of about 140 dB re 1µPa at 130 Hz and 200 Hz.
Apart from turbine and location characteristics, the sound varies with the wind speed causing increasing sound levels and higher emission in higher frequencies due to increased turbine rotational speed (INGEMANSSON 2003). At the same time, higher wind speeds result in similar increases in background sound levels (WESTERBERG 1994 in ENGELL-SØRENSEN 2002).
Therefore offshore wind turbines sound emissions will vary depending on local conditions and this might cause additional reactions of fish.
Acoustic measurements are time consuming and costly, especially when they are carried out offshore and it is more likely that predicted sound fields in and around offshore wind farms will be calculated. Complex modelling including sound levels, frequency spectra, background noise at different wind speeds, environmental factors such as water depth and sediment type and information about hearing abilities of fish species will be necessary to predict detection and reaction distances for fish. First steps have been taken (DEWI 2004). From the
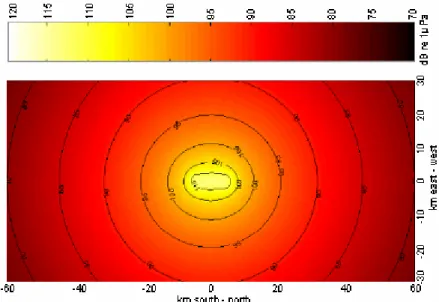
measurement of single turbines (Fig. 1) the sound field of a wind farm and its surroundings was calculated showing the sound levels of different frequency ranges in the surroundings of the wind farm (DEWI 2004). As an example the predicted sound field at an 1/3 octave band of 63 Hz is given in (Fig. 2).
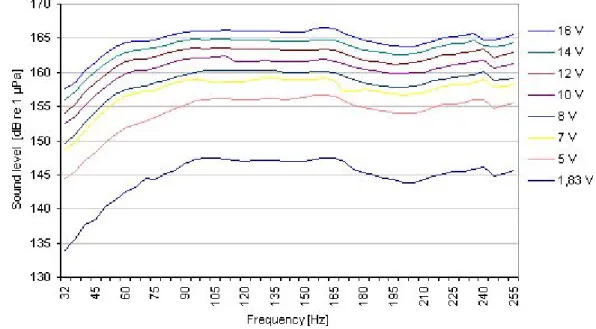
Fig. 1: Underwater sound pressure levels (1/3rd octave spectra) recorded at 110 m distance from the turbine for different turbine states. Wind speeds refer to hub height (nacelle anemo- meter). The grey line marks the background sound level measured at low wind speeds while the wind turbines were turned off. Figure from DEWI (2004).
Fig. 2: Underwater sound emission of a hypothetical wind farm containing 70 turbines (5 rows of 14 turbines with a distance of 800 m to each other) calculated on the basis of measure- ments of a 1.5-MW wind turbine at a medium wind speed. The sound levels are given for an 1/3rd octave band of 63 Hz. Figure from DEWI (2004).
Depending on the background sound level in the sea and other factors such as the foundation material and sediment type, the area in which the sound can be detected varies.
And depending on the location of the wind farms the background sound level will not only be influenced by natural conditions such as wind and waves but also by ship traffic and other anthropogenic sound sources. To produce reliable predictions, a strong data base of these factors needs to be build up and more research is necessary.
1.2.3 Hydroacoustics
1.2.3.1 Sound in water and in air
A direct comparison of sound pressure in air and in water in decibels is not possible since, for the same intensity of produced sound, the sound pressure in water is more than 60 dB higher than it is in air. This difference is caused by different sound characteristics in water and air and by different references used for the calculation of decibel in both cases.
The difference in the density of water and air is very large, which causes differences in the speed of sound. The density of air is 1.3 kg m-3 the density of water 1030 kg m-3. Sound in air travels with a speed of 340 ms-1 while the speed of sound in water reaches 1450 to 1550 ms-1 dependent on temperature and salinity (MACLENNAN & SIMMONDS 1992). Caused by the different density and speed of sound in water and air, the sound pressures in air and water differ for sound of equal intensities. The relation between sound pressure in water and air can be calculated from the characteristic acoustic impedance (Z) as followed (VEIT 1979):
Air Water
Z
= Z
Air Water
P
P
The characteristic acoustic impedance can be calculated from the density and speed of sound of the medium.
3495.5 m
kg 1.3 ms 340
m kg 1030 ms
1500 P
P
3 - 1
-
3 - 1
- Air
Water =
×
= ×
1 . P 59
P
Air Water =
Transforming this relation into decibel a pressure difference of 20 log 59.1 = 35.43 dB results between sound of equal intensity in water and air.
Additionally the reference for sound pressure in air is 20 μPascal while it is 1 μPascal in water. For this reason the same objective sound pressure in water gives a 26 dB higher sound pressure indication than in air.
20 lg ( 1
20 ) = 26.02 dB
Therefore the same sound intensity in water yields formally 61.5 dB more sound pressure than in air.
In water, sound waves travel over long distances due to low attenuation. The attenuation increases with frequency and distance.
The wavelength λ depends on the speed of sound and the frequency. In saltwater it can be calculated:
Frequency ms
= 1440 λ
Thus, the length of a 100 Hz wave is 14.4 m in the sea.
1.2.3.2 The acoustical near and far field
An acoustic field can be described in terms of sound pressure and hydrodynamic compo- nents such as particle velocity, particle displacement and particle acceleration (VEIT 1979, HAWKINS & MYRBERG JR 1983). In hydroacoustic experiments it is necessary to distinguish between the near and the far field, because of their different acoustic properties. The acoustic situation in a free acoustic field (far field) not restricted by any boundaries is relatively simple. The sound travels in a quasi plane wave and sound pressure p and velocity v are in phase in a ratio of 90°. A sound wave can only be plane in the absence of discontinuities causing refraction and reflection. The hydroacoustic and hydrodynamic components are related to each other and can be easily calculated.
In acoustic near fields such as shallow waters or tanks sound pressure and velocity are out of phase and in the direct vicinity of the sound source the displacement of water causes hydrodynamic effects (VEIT 1979). The hydrodynamic components are of great importance to describe the acoustic field but cannot be calculated from the sound pressure due to compli- cated reflections and border effects. For this reason the particle movements in near fields need to be measured directly. Measurements of particle movements in water are difficult to carry out (WAHLBERG & WESTERBERG 2005) and are rarely done. Hydrodynamics are of special interest since some fish groups lacking a swimbladder are sensitive to hydro- dynamics while most other fish groups with swimbladder can detect sound pressure.
From a monopole sound source the sound waves propagates spherically in all directions. A approximate plane sound wave can only begin at some distance from the sound source because of the growing radius (VEIT 1979). The stronger the spherical wave is curved the
pressure (PARVULESCU 1964). The extension of the near field depends on the wavelength of the sound and is larger at lower frequencies. In the direct vicinity of the sound source the particle velocity is high compared with the particle velocity for the same sound pressure in the far field. In the near field the particle velocity decreases with distance as
r2
1
(r = distance from the centre of the monopole sound source.) while in the acoustical far field it decreases with
r 1
This latter decrease also holds for the decrease of sound pressure both in near and far fields.
The acoustic far field can be defined by the phase equality of velocity and sound pressure (VEIT 1979). But a true far field is an idealized concept (SCHUIJF 1975). Different authors accept different deviations from the ideal far field, which leads to variations in the assumed beginning of the far field. VEIT (1979) defines the far field for distances greater than two wavelengths from the sound source while the figure from HAWKINS (1973) (Fig. 3) gives smaller radii for different frequencies. Conventionally the border between near and far field is considered to be between 1-2 wavelength.
Fig. 3: The “near field” effect, illustrating the decline in the amplitude of particle displacement with distance from a monopole sound source; plotted for a number of different frequencies for a sound pressure of 1 µbar. Figure and legend from HAWKINS (1973).
1.2.3.3 Acoustic in tanks
The acoustic field in experimental tanks is very complicated due to reflections from walls, bottom and water surface. Although the situation in a tank is rather comparable with the conditions of a near field, the near field equations are of only limited use to describe the acoustic field in aquaria.
A number of studies have attempted to minimise reflections at the tank walls by using absorbent materials, such as rubberised hair (TAVOLGA & WODINSKY 1963, BUERKLE 1967).
However, at low frequencies relevant to fish, this is very difficult. The material would need to be as thick as about a quarter of the wavelength (FREYTAG 1967), e.g. 3,75 m for sound at 100 Hz.
Due to these complications, research has often been done in special apparatuses, where fish could be placed in well-defined acoustic fields. HAWKINS &MACLENNAN (1975) used a steel tube with sound projectors at each end. Depending on the phase of sound production at the sound projectors the particle motion and sound pressure inside the tube could be varied. The fish were exposed to the sound field in a small cage inside the tube. Another way was to generate the sound in the air surrounding a small thin walled aquarium (FAY 1969). The sound field in air compresses the boundary surfaces of the water mass and sound pressure changes in air lead to sound pressure changes in water with only small particle motion. But this setting is only suitable for small tanks and very low frequencies (HAWKINS &MACLENNAN
1975). Experiments in the wild were done with caged fish that again were confined to a certain sound field (e.g. MCCAULEY et al. 2000).
In contrast, in the present experiments fish were exposed to an inhomogeneous sound field with an obvious sound pressure difference in the tank allowing the fish to avoid highest sound pressure levels.
1.2.3.4 Interferences
In self-contained systems, such as experimental tanks, sound is reflected in different directions and degrees from the walls, bottom and surface. Two sound wave maximum peaks joining will cause an accumulation of sound pressure. If a minimum and a maximum peak join the peaks are levelled out (ATKINS 1973). The sound field in a tank can contain large variations in sound level caused by interferences.
Even under free field conditions, variations in salinity, temperature and pressure can cause reflections and refractions of sound waves, which produce acoustic shadow zones in the sea.
Sound travelling over long distances can be changed due to reflections from the surface or
almost perfect reflector due to the impedance differences between the media water and air (HAWKINS &MYRBERG JR 1983).
1.2.4 Fish and sound
1.2.4.1 Hearing ability in fish
Hearing in fish does not generally differ from hearing of terrestrial vertebrates (POPPER 2003). Like other vertebrates fish can discriminate between sounds, determine the direction of a sound source and detect biologically important sounds from background noise (POPPER 2003).
Knowledge of hearing in fish is restricted to about 100 species (HASTINGS &POPPER 2005).
The majority of fish are generalists, without specialized hearing abilities and can detect sound up to 500 to 1000 Hz (POPPER 2003). Their best hearing is at frequencies between 100 and 400 Hz, which is also the range of many anthropogenic sounds (POPPER 2003).
Hearing specialist can detect frequencies up to 3000 Hz or more with the best hearing ability between 300 Hz and 1000 Hz (POPPER 2003). Some species even detect ultrasound (ASTRUP &MØHL 1993, MANN et al. 2001, GREGORY &CLABBURN 2003).
The inner ear of bony fishes generally consists of three chambers with sensory maculae, the saccule, utricule and lagena, three mechanoreceptor organs connected by semicircular canals (Fig. 4). The macula utriculi is in a mostly horizontal position while macula saccule and macula lagena are vertically postured (HAWKINS &MYRBERG JR 1983).
Every mechanoreceptor organ contains an otolith that covers the epithelial macula, which contains a field of hair cells (Fig. 5). The hair cells in fish have a long kinocilium at the apical end and 40 to 60 shorter stereocilia (depending on species) (POPPER 1978). There are three different types of hair cells that can be found in different areas of the epithelial macula specific to every species. They can be distinguished by the length of kinocilium and stereo- cilia but the types grade into one another (POPPER 1978).
The otolith is of great importance for the hearing of fish (POPPER 1978). The specific density of a fish is nearly equal to the specific density of water. Sound waves pass through a fish body moving the fish in the same way as the particles of the surrounding water (HAWKINS &
MACLENNAN 1975). The higher density of the otoliths compared to fish tissue results in a time delay in their movement, causing shearing forces in the hair cells lying beneath (Hastings &
Popper 2005).
Fig. 4: Left labyrinthine mechanoreceptor organ of cod. (Figure from Dale 1976).
Fig. 5: A: Schematic cross section through the utricule of a cod, showing the otolith mounted above the hair cells and separated from them by an otolithic membrane. Figure from HAWKINS (1985). B: Hair cell with stereocilia (S), kinocilium (K), afferent (A) and efferent (E) nerve fibres surrounded by supporting cells. Figure after FLOCK &RUSSELL (1973).
The reaction of the hair cells depends on the direction of the otolith movement. Shearing forces towards the kinocilium will cause depolarisation of the cell and stimulation of the
inhibitation of the afferent nerve (HAWKINS & MYRBERG JR 1983). The necessary particle displacement to stimulate the hair cells is small and has been determined in cod and two species of pleuronectidae as being from about 0.04 to 0.1 nanometre (CHAPMAN &HAWKINS
1973,CHAPMAN &SAND 1974).
The saccule and lagena are mainly involved in hearing in many teleost fish whilst the utricule is thought to have an equilibrium function (POPPER 1978). However, in some fish species, including clupeids, the utricule also plays a part in hearing, as can sometimes do the lateral line system (HAWKING &MYRBERG JR. 1983).
The hearing threshold of fish can be displayed as an audiogram. It is common practice to produce an audiogram relating to sound pressure or particle displacement. But the important stimulus for the hair cells in the inner ear of fish is the particle acceleration, which is one component of the acoustic wave (SAND & KARLSEN 1986, KARLSEN 1992b, ENGER et al.
1993). Audiograms recalculated from displacement to acceleration show a different picture of the hearing abilities of fish (KARLSEN 1992b). ENGER et al. (1993) calculated hypothetical audiograms relating to sound pressure, particle displacement and particle acceleration that show a clear difference at low frequencies (Fig. 6).
Fig. 6: Hypothetical fish audiograms related to particle displacement (D), sound pressure (P), or particle acceleration (A). Figure from ENGER et al. (1993). In the far field particle displace- ment, particle acceleration, particle velocity and sound pressure can be calculated using v = d(2 π f): a = d(2 π f)². Sound pressure is proportional to v (ENGER et al. 1993).
From the sound pressure and particle displacement audiograms it seems unlikely that fish can detect infrasound, while the acceleration audiogram hints to a good hearing ability for infrasound frequencies. Infrasound may play an important role in hearing in fish since it could enable fish to detect swimming movement of prey and predators that produce predominantly
low frequency hydrodynamic noise below 10 Hz (ENGER et al. 1989). KARLSEN (1992b) pointed out that important components of ambient noise are in the infrasound range and SAND & KARLSEN (1986) suggested that detection of infrasound might be utilized for orientation in migrating fish.
The inner ear of fish is sensitive to the particle acceleration of a sound wave. Additionally the sound pressure component of the sound wave can be detected by fish possessing a swim- bladder. The swimbladder acts as a pressure-to-displacement transformer (ENGER et al.
1993) converting the sound pressure into particle motion that can be detected by the inner ear. The benefit of the swimbladder as an amplifier does not apply for frequencies below 100 Hz (POPPER 1978, SAND &ENGER 1973). The amount of air in a swimbladder influences the effect on the hearing ability of fish (SAND & ENGER 1973). WAHLBERG & WESTERBERG
(2005) pointed out that in fish with small swimbladders that contain only a small amount of air, such as salmonids, the hearing ability is not substantially improved.
The improvement in hearing by the swimbladder also depends on the way the particle displacement is transmitted to the inner ear. In hearing generalists it is transmitted through the surrounding tissue causing attenuation of energy. Therefore, the closer the swimbladder is to the inner ear the better is the hearing ability (POPPER &CARLSON 1998). Hearing ability is enhanced in hearing specialists with different adaptations that improve the coupling between swimbladder and ear (FAY &POPPER 1980). The adaptations in hearing specialists range from extensions of the swimbladder that are very close to the ear (e.g. clupeidae) to direct mechanical connections between the swimbladder and the inner ear as found in ostariophysan fish such as the carp (HASTING &POPPER 2005) that minimizes transmission loss. The sensitivity of hearing specialists extends to a wider frequency range up to 3000-4000 Hz and a hearing threshold that is up to 20 dB lower than the threshold in hearing generalists (HASTINGS &POPPER 2005).
1.2.4.2 Hearing in cod and plaice Hearing in cod
Cod can detect sound pressure that is converted into particle velocity in the swimbladder.
Compared with other hearing generalist cod seems to have a rather narrow hearing range from infrasound as low as 0.1 Hz (SAND & KARLSEN 1986) to about 470 Hz (CHAPMAN &
HAWKINS 1973). The upper hearing limit of cod is lower than in most other fish studied.
However, while most other teleosts react to a wider frequency range, the hearing ability of cod in its most sensitive range from 60 to 380 Hz is acute and in many cases only limited by ambient noise (S & H 1973). A reason for low hearing thresholds at the most
cranium close to the foramen of the ninth and tenth nerves (OFFUT 1974). The labyrinth is located on the other side of this foramen and acoustic stimuli could be transmitted without much loss. These projections are small in juvenile cod but well developed in adults (SAND &
HAWKINS 1973) and can also be found in other gadoids (HAGMAN 1921). However in some specimens the projections does not reach the foramen but are tangled next to the swim- bladder (OFFUT 1974, SAND &HAWKINS 1973).
The hearing threshold of cod was determined by various authors (e.g. OFFUT 1974,CHAPMAN
& HAWKINS 1973, BUERKLE 1967, 1968) which obtained different results. BUERKLE (1967) estimated a relatively high hearing threshold of about 95 and 100 dB re 1µPa at a frequency range from 20 to 300 Hz which was probably caused by masking of background noise (BUERKLE 1968). CHAPMAN &HAWKINS (1973) found lower hearing thresholds of about 74 to 90 dB re 1µPa and the authors presumed that the threshold have also been masked and should be about 2 dB lower than measured. OFFUT (1974) determined the hearing threshold in a range from 64 to 84 dB re 1µPa. While CHAPMAN & HAWKINS (1973) carried out their experiments in shallow open water, which, it could be argued, provided a better acoustic field and a more natural situation, OFFUT (1974) used an experimental tank. Due to effects of the tank walls, the particle motion might have been higher, which would have caused a stronger stimulus and lower hearing thresholds, since at low frequencies the particle motion is the relevant stimulus for detecting a sound wave with increasing sensitivity at decreasing frequencies (SAND & KARLSEN 1986). Additionally the lateral line can detect particle movement at low frequencies up to a distance of some body length of the fish (SAND &
KARLSEN 1986).
OFFUT (1974) did not give any details about the duration and rising speed of the sound stimulus. Quickly rising sounds cause stronger reactions than sound that increases slowly.
IVERSEN (1969 in SCHWARZ 1985) pointed out that changes in sound cause stronger behavioural reactions than the maximum sound level and that sudden sounds caused the strongest avoidance.
CHAPMAN &HAWKINS (1973) found a steep rise in the hearing threshold above 400 Hz in cod and conditioning to sound was not possible at frequencies of 520 Hz and above. They concluded that cod is insensitive to high frequency sound. In a range from 60 to 360 Hz the hearing threshold was closely related to the background sound level with a signal to noise ratio of about 16 dB (CHAPMAN &HAWKINS 1973). At frequencies between 60 Hz and 160 Hz the distance from the sound source did not influence the hearing threshold while at the lower frequencies the threshold decreased in the vicinity of the sound source indicating a change of the relevant stimulus from sound pressure to particle displacement (CHAPMAN &
HAWKINS 1973). At a frequency range from 60 Hz to 160 Hz (higher frequencies could not be
tested) the auditory system of cod seems to be sensitive to sound pressure and the authors expect this to be valid for the higher frequencies in the hearing range too (CHAPMAN &
HAWKINS 1973).
Signals of a given frequency are most effectively masked by noise of the same and adjacent frequencies (HAWKINS 1993). To improve the ability to distinguish between a signal and the background noise, cod, like many fish and other vertebrates including humans, possess auditory filters that can be tuned to frequencies of interest (HAWKINS 1993). Inside the frequency range of the filter the hearing threshold is lower than outside the filter range and the bandwidth of a filter varies with frequency (HAWKINS & CHAPMAN 1975).
Cod is capable of distinguishing between the directions of different sound sources (horizontal and vertical direction) (BUWALDA et al. 1983) and between sound sources of different distances (SCHUIJF &HAWKINS 1983). ASTRUP &MØHL (1993) discovered that cod can detect ultrasound of a frequency of 38 kHz and presumed this would enable the fish to detect the echolocating of odontocetes in a range between 10 and 30 meters.
The hearing ability of cod might be different in juvenile and adult fish. ENGÅS et al. (1993) investigated the catch rates of cod and haddock (Melanogrammus aeglefinus) before and after seismic shooting, with up to 249 dB re 1 µPa at 1 m distance, and found that the reduction in catches in larger fish was stronger than in smaller fish. This may be related to better hearing ability in adult cod, although another explanation given by the authors was the higher swimming speed of adult cod that allows larger fish to depart the area more quickly whilst smaller fish might habituate to the sound before they are able to leave the affected area.
Sound production in cod
Sound production is widespread in fish and the mechanisms of sound production have evolved independently in different fish group (HAWKINS &MYRBERG Jr 1983). Some gadoids such as the cod produce low frequency grunts using muscles attached to the swimbladder (HAWKINS & RASMUSSEN 1978). BRAWN (1961) looked at Gadus callarias and found it to possess similar sound production behaviour. Both sexes produce the same grunts during defensive and aggressive behaviour and when startled, independently from context (BRAWN
1961, HAWKINS & RASMUSSEN 1978). Sound production is more frequent from the end of September to the end of November, due to aggressive behaviour and again in February and March during the spawning season (BRAWN 1961). During spawning season only the male is vocal, using grunts to attract ripe females and to scare away competitors (BRAWN 1961, HAWKINS &RASMUSSEN 1978). The majority of sounds produced by cod are single grunts that
to the start of the next (HAWKINS &RASMUSSEN 1978). However, cod have also been shown to produce sonic clicks of about 6 kHz at a sound level of 150 dB re 1µPa at 1 m in the presence of two species of seals or human divers (VESTER et al. 2004). The authors supposed the sound to be used as a deterrent against predators. While cod uses a simple repertoire of grunts, haddock uses different grunts and knocks in different social contexts (HAWKINS &RASMUSSEN 1978).
Masking
Masking of biologically relevant sounds by anthropogenic noise is an important issue. Many fish use sound for intraspecific communication in different social contexts. Masking of mating calls could cause serious problems in reproduction. Haddock mating calls were measured at a sound level of 120 dB re 1µPa (A.D.HAWKINS pers. communication) and on the same basis WAHLBERG &WESTERBERG (2005) calculated a detection distance for intraspecific communi- cation of 4 m at a given wind speed of 13 ms-1, although this was based on sound pressure alone and might contain inaccuracies and variations (WAHLBERG &WESTERBERG 2005). This calculation is based on solitary male display sounds but other mating calls are much weaker and more prone to masking (A.D.HAWKINS pers. communication). Spawning in gadoids takes place in the Baltic Sea mainly from February to April (BAGGE et al. in ICES 2005b) and in the North Sea from January to April (BRANDER 1994 in ICES 2005b). It occurs in deeper offshore waters (HAWKINS &AMORIM 2000) under low light conditions that make other senses such as hearing more important. Offshore wind farms are currently restricted to more shallow waters of up to about 25 m and therefore it is unlikely that they would be sited in spawning areas but the sound levels could carry over some kilometres (see chapter 1.2.2) and could mask low level communication. In particular this should be taken into account during the construction phase, which will influence a wider area and should therefore be timed to avoid the spawning season if known spawning grounds are close by.
Hearing in plaice
Plaice is restricted to detection of hydrodynamic components of the sound wave (HAWKINS &
MYRBERG JR 1983) due to its lack of a swimbladder. For this reason the hearing ability of plaice is rather poor with a narrow frequency range up to 250 Hz and high hearing thresholds between about 90 and 105 dB re 1µPa (CHAPMAN & SAND 1974). HAWKINS & MACLENNAN
(1975) recorded saccular microphonic potentials of plaice in a frequency range from 10 to 250 Hz with highest amplitudes around 90 Hz. They also found that particle velocity, not sound pressure was the stimulus, since changes in sound level did not lead to potential differences but changes in particle velocity did. CHAPMAN & SAND (1974) did experiments on two species of pleuronectidae and obtained comparable results with highest sensitivity in the
range between 110 Hz and 160 Hz. KARLSEN (1992a) measured a sensitivity of plaice to infrasound as low as 0.1 Hz using a cardiac conditioning technique. The audiogram of plaice showing the results of KARLSEN (1992a) and the recalculated results of CHAPMAN & SAND
(1974) is displayed in Fig. 7. This audiogram gives a sensitivity of plaice to frequencies from infrasound to a frequency of about 200 Hz.
Fig. 7: Auditory thresholds obtained in six plaice for the frequency range 0.1-30 Hz, presented as mean values + S.D. The dotted curve give the acceleration thresholds found in plaice by CHAPMAN &SAND (1974). Figure and legend from KARLSEN (1992a). Elevated thresholds at 1 Hz and 3 Hz might be caused by masking.
1.2.4.3 Reaction of fish to anthropogenic noise
It is well established that fish can hear, but knowledge of the influence of man-made noise on fish is still small (e.g. MCCAULEY et al. 2003, POPPER 2003, AMOSER et al. 2004, POPPER et al. 2005, WAHLBERG & WESTERBERG 2005). Many fish are sensitive to a wide range of frequencies and sound production for communication is widespread (HAWKINS 1973, SAND &
KARLSEN 1986, ASTRUP & MØHL 1993, POPPER 2003). The acoustic environment can be defined as the portion of the sound spectrum in water to which a fish is sensitive (MOULTON
1963). Most anthropogenic noise is within the hearing range of fish, and may affect behaviour and/or physiology and might cause either temporary or permanent effects (POPPER 2003). Anthropogenic noise may impair fish hearing leading to difficulties in orientating in the acoustic environment, finding prey, avoiding predators and communication (MCCAULEY et al. 2003, POPPER 2003). Anthropogenic sound can be caused by stationary
sources such as ships (e.g. AMOSER et al. 2004, VABØ et al. 2002), seismic surveys (e.g.
MCCAULEY et al. 2003) and pile driving (e.g. NEDWELL et al. 2003b) that can cause high sound level peaks.
To evaluate the effects of anthropogenic noise on fish it is necessary to know how fish react to sound and to determine thresholds that lead to temporary or permanent hearing loss or other effects that can impact the survival of individual fish or fish stocks (POPPER 2003).
One problem is masking of important sounds by anthropogenic noise (POPPER 2003).
Masking is the inability to separate a signal from background noise (HAWKINS & CHAPMAN
1975). Fish with low hearing thresholds are particularly affected by noise masking signals.
Signal detection depends not only on the sound level of the signal and the hearing ability of the fish but on the relation between signal and background noise (signal-noise-ratio) and in a noisy environment like the sea, the ability to discriminate between a signal and the back- ground noise is more important than the absolute hearing threshold (HAWKINS & CHAPMAN
1975). CHAPMAN & HAWKINS (1973) suggested that ambient noise in the sea limits the hearing abilities of the majority of marine fish especially under adverse sea conditions. LEIS
et al. (2003) revealed that the larvae of some reef fish species use reef sounds for orientation during settlement. Masking of reef sound by noise from offshore could cause confusion leading the larvae away from the reef and preventing their settlement in the reef (POPPER
2003). WESTERBERG (2000) mentioned possible masking of communication sounds by offshore wind farm noise during spawning as an important subject that needs to be investi- gated. Some schooling fish, such as herring (Clupea harengus) and sprat (Sprattus sprattus) use low frequency sound detected by the lateral line organ to maintain their school structure and could be affected by masking of this sound (KRAAN & VAN ETTEN 1995).
Fish can react to noise in different ways and the response might depend on life stage, physiological state (POPPER 2003) as well as diel rhythms, temperature and season (NEPROSHIN 1979). MISUND & AGLEN (1992) described avoidance behaviour of herring and sprat to low frequency vessel noise and presumed that the strength of the reaction depended on the distance of the sound source when first detected by the fish. Noise approaching slowly from greater distance would cause smaller reactions than noise appearing suddenly at short distance. SCHWARZ (1985) presumed that most fish would ignore even high level continuous sound if it is not combined with other stimuli or connected with danger or a reward. This was based on observations such as IVERSEN’S (1969 in SCHWARZ 1985) that skipjack tuna (Katsuwonus pelamis) swam next to a noisy ship until the speed and therefore the sound level suddenly changed. After the sound stabilized on the new level the fish returned to the boat. The same effect was observed in Atlantic herring (Clupea harengus harengus) (HERING 1968, OLSEN 1970 in SCHWARZ 1985).
NEPROSHIN (1979) found a diel rhythm in the reaction distance of pacific mackerel to vessel noise depending not only on the noise but on light, temperature, feeding activity and season.
ENGÅS et al. (1996) described significantly lower catch rates of cod and haddock during and after the use of seismic guns but it is not known whether the fish were scared away, injured or even killed and whether increasing fish numbers afterwards were caused by the same fish returning or by other fish replacing the reduced stock. Startle and alarm responses in rockfish during exposure to air-gun sound were revealed by PEARSON et al. (1992). WARDLE et al.
(2001) observed startle response to single air gun shots but the fish would only move away from the sound source when an additional visual clue indicated the direction of the sound source. The authors therefore presumed that the single shot of an air gun was too short or too complicated in its composition to provide directional information to the fish. Additionally loud noise might cause fish to “freeze on the spot“, exposing it to high sound levels that might cause physiological damage (POPPER 2003).
MCCAULEY et al. (2000) observed the behaviour of pink snapper (Chrysophrys auratus) in a net cage during air-gun shots. While the fish disappeared from view and dived to the bottom of the cage after the first shot they stayed closer to the camera at the second shot although moving to lower areas of the cage. The same fish were exposed to three more air gun shots after recovery time of 58 days but did not show any obvious reaction to the sound. Whether the lack of behavioural reaction was caused by habituation to the sound or deafness of the fish is not known but damage to the hair cells was evident (MCCAULEY et al. 2000). Sound might cause slight short-term effects but it might also cause flight reactions scaring fish from feeding grounds or spawning areas, which could have permanent effects on fish stocks (POPPER 2003). HANDEGARD et al. (2003) measured individual responses of fish using an acoustic target tracking method. The authors showed vertical and horizontal movements of individual cod when approached by a trawling vessel. This work was extended to investigate the reactions to different types of sounds related to trawling (HANDEGARD &TJØSTHEIM 2005).
CHAPMAN et al. (1974) described attraction of some fish species including cod to low frequency sound produced by breathing divers. In this experiment fish showed avoidance behaviour to the divers but became used to the sound probably while taking advantage of additional food from the disturbed sea bed during diving activity. In later playback experi- ments the fish were attracted to the sound of the divers. CHAPMAN (1976) observed attraction of juvenile gadoids to pulsed low frequency sound which might be related to natural food searching behaviour with pulsed tones resembling the sound of fish movements.
MOORHOUSE (1932) observed rapid habituation of perch to sound in a tank and WAHLBERG &
WESTERBERG (2005) mentioned that it would be relatively easy for a fish to associate a
sound with certain events and habituation to a sound that is not connected with danger could occur. However, it is not known how fish might react to a long lasting continuous sound.
1.2.4.4 Results from offshore wind farm research
There are only a few studies investigating the effects of offshore wind turbine sound emissions on fish. In addition, a number of studies have examined the influence of the sound produced during pile driving, which is of importance during construction of offshore wind farms (e.g. MCKENZIE MAXON 2000, NEDWELL et al. 2003a).
The sound of pile driving is on a higher level than the operational sound of wind turbines, but the sound emission is not continuous. The sound signal will depend on the material of the pile, the sediment structure and the way the piling takes place and efforts are made to monitor and reduce sound emissions (VAGLE 2003, DEWI 2004). Measurement during pile driving in the Baltic Sea showed sound levels of about 175 dB re 1µPa declining to about 159 dB re 1µPa at a distance of 1100 m (DEWI 2004). NEDWELL et al. (2003a) measured source levels of 260 dB re 1µPa at a distance of 1 m during piling and calculated a sound level of more than 170 dB re 1µPa at a distance of 10 km from the turbine. A study carried out by FEIST et al. (1992 in HAWKINS 2003) showed that the number of juvenile salmonid schools was reduced to about one half during pile driving compared with the same area when pile driving was not taking place, indicating that the fish returned after the noise stopped. The authors estimated a detection range for the hearing generalists of at least 600 m at a source level of 150 dB re 1µPa.
The possible influence on fish of the noise and electromagnetic fields created by the world’s first commercial offshore wind farm, Vindeby (Denmark, 11 turbines of 450-kW established in 1991) was evaluated by ENGELL-SØRENSEN (2002) after ten years of operation. The evaluation was prompted by anecdotal evidence provided by the only commercial fisherman active in the area, that catches of the flatfish turbot (Psetta maxima) decreased inside the wind farm when wind speeds were higher than 5 ms-1 compared to catches outside the wind farm. The fisherman also observed that 24 hours calm weather conditions were needed before turbot would return to the wind farm area. Planned catch experiments to confirm or reject these findings had to be cancelled due to late arrival of turbot in spring and bad weather conditions. Instead, the author compared data in the literature on the hearing ability of flatfish with the Vindeby sound emissions of 85 to 120 dB re 1µPa in a frequency range from 0,1 Hz to 400 Hz measured at a distance of 14 m from the turbine. The study concluded that an avoidance reaction of turbot and flounder (Psetta flesus) was possible but not likely, even when the fish were close to the turbine during high wind speeds.
HAUMANN (1993 in ENGELL-SØRENSEN 2002) examined the Vindeby wind farm area before construction and during operation and found a considerable increase in the number of cod in the area of wind farm, which the author attributed to the artificial reef effect. Apart from this, HAUMANN concluded that noise or other physical impacts caused by the wind farm did not have any negative effects on fish or fishing. However, as pointed out by ENGELL-SØRENSEN
(2002) these conclusions were not based on statistical analysis.
The strength of an artificial reef effect depends not only on the structure of the artificial substrate but also on the surrounding environment since recruitment is subject to the organisms in surrounding areas and depends on currents carrying larvae and spat (ENGELL- SØRENSEN et al. 2000). JOSCHKO et al. (2004) expected turbine piles to change the hydro- dynamic regime and the sedimentary environment of the soft bottom, which could cause changes in larval settlement. Additionally the piles would represent an artificial hard substrate introduced into a soft bottom area, which would be likely influence the ecosystem significantly by allowing certain species, such as cirripedia, actinaria and bivalvia to colonize the area (JOSCHKO et al. 2004). From research in the wind farm area Horns Rev an 8-fold increase in food availability (epifauna-biomass) for fish was estimated due to introduction of hard substrate, which could result in an increase in fish abundance (ELSAM ENGINEERING
2004). Hydroacoustic fish monitoring was initiated in 2004 and indicated that the wind farm attracted fish beyond a distance of 500 m (HVIDT et al. 2005). An average increase of 300%
in sandeel abundance was recorded compared to the year before the wind farm was erected, although abundance decreased by about 20% in the control area outside the wind farm area (ELSAM ENGINEERING &ENERGI E2A/S2005).
WESTERBERG (2000) observed increasing fish numbers in an area of less than 200 m and lower catch rates at a distance between 200 m and 800 m around the 220-kW Svante wind turbine (Sweden) when the turbine was switched off compared to when it was operational.
The sound level emitted by the small turbine was 102 to 113 dB re 1µPa at a distance of 1 m depending on the wind force (WESTERBERG 2000). A possible explanation given by the author was an artificial reef effect caused by the pile and that attraction and avoidance were balanced during operation of the turbine. Therefore the fish moved closer to the attractive pile when the turbine was switched off while they moved to the less noisy area during operation.
VALDEMARSEN (1979) observed significant increases in catches of saithe (Pollachius virens) and cod in the vicinity of an oilrig compared with catches 500 m away from the platform and presumed that demersal fish would aggregate around oilrigs. Flatfish such as plaice can also be attracted to artificial reef structures (POLOVINA &SAKAI 1989 in HOFFMANN et al. 2000).
The environmental monitoring programme at the offshore wind farm Horns Rev containing 80 turbines of 2-MW raised the subject of sound influence on fish (ELSAM ENGINEERING &
ENERGI E2 A/S2005), but did not include research on changes in fish communities due to construction and operation of the farm. The authors expect the sound produced from offshore wind turbines to be different from natural sound sources including other marine organisms and therefore masking of biological sounds would not be a problem. Additionally continuous sound production would be likely to result in habituation of fish.
The report of ENGINEERING &ENERGI E2A/S (2005) mentioned that before the wind farm was erected the Horns Rev area was a nursery area for herring with larvae present in spring and juveniles present in the summer and autumn.
The area of the Nysted wind farm containing 72 turbines of 2.3-MW is presumed to be part of a large feeding, breeding and spawning ground used by a number of fish including cod, haddock and herring (BIO/CONSULT 2000 in ELSAM ENGINEERING & ENERGI E2 A/S 2005).
Masking of vocal species such as cod and haddock could negatively effect spawning success.
The environmental statement for the offshore wind farm Robin Rigg (NATURAL POWER 2002) expects the sound emission even during pile driving to be too low to affect fish but the estimation was based on a high reaction threshold of 180 dB re 1µPa even for hearing specialists. HAWKINS (2003) criticized the statement given by NATURAL POWER (2003) since it would underestimate the effect of pile driving which might be significant and can even kill fish. The author measured pile-driving noise in levels detectable for sound sensitive fish such as cod, shad (Alosa spec.) and herring at a distance of 20 km away from the sound source.
A possible negative effect of offshore wind farms could be changes to the electro-magnetic field in the direct vicinity of the cables. Research on this subject is rare and therefore it is not known if fish species sensitive to electro-magnetic fields such as sharks, rays and some bony fish might react to electro-magnetic fields produced by offshore wind farms (ENGELL- SØRENSEN 2002) A study carried out on dogfish (Scyliorhinus canicula) showed some avoidance to electric fields at 1000µV/m but with high variability among individuals (GILL &
TAYLOR 2001)
All these studies highlight the lack of in depth field studies and information for key species and life history stages, such as vocalizing adults during spawning season, larval stages etc.
Standardisation of research projects and long term monitoring before, during and after wind farm construction would be highly desirable (BSH 2001).
![Fig. 49: Summary of the differences in the mean fish numbers [%] between the periods before and during sound production in cod](https://thumb-eu.123doks.com/thumbv2/1library_info/5629310.1692685/88.892.163.735.388.729/fig-summary-differences-mean-numbers-periods-sound-production.webp)
