How Do Participants Deal with Questions if Asked to Rate Visual Dimensions
of an Object?
Markus Kattenbeck
Universität Regensburg, Lehrstuhl für Informationswissenschaft Universitätsstraße 31, 93053 Regensburg, Germany
markus.kattenbeck@ur.de
Abstract
Research Question: How do participants behave when asked to rate objects’
visual dimensions?
Approach: Qualitative Data Analysis
Method: 90 participants were asked to rate 11 objects located along a route of 1.1 km length and asked to explain their rating behaviour using a think-aloud protocol.
Results: If asked to rate several objects, participants tend to stop reading the questions as a whole. Moreover, when judging objects on visual dimensions they make inconsistent use of local neighbourhoods.
Keywords: Pedestrian navigation, Collaborative landmark mining, Visual dimensions, Salience survey
1 Communicating routes based on salient objects — motivation
Humans preferably communicate pedestrian routes using salient objects in- stead of giving distances (c.f. e.g. Michon 2001 and Xia 2011). In order to
In: F.Pehar/C.Schlögl/C.Wolff (Eds.). Re:inventing Information Science in the Networked Society. Proceedings of the 14th International Symposium on Information Science (ISI2015),Zadar,Croatia,19th—21stMay 2015. Glückstadt:VerlagWerner Hülsbusch, pp. 313—319.
enable mobile information systems to mimic this method of communication a set of objects regarded to be salient is necessary (c.f. Kattenbeck et al. 2015 for arguments why research on pedestrian navigation is information beha- viour research). Among the various aspects contributing to salience (c.f. e.g.
Raubal 2002), visual dimensions of objects are of major importance for sali- ence scores because these may be used in route instructions regardless the users’ prior knowledge. In order to gain a set of salient objects a survey- based collaborative filtering method may be used. Ludwig et al. (2013) call this method Collaborative Landmark Mining (CLM). Its premise is that users of mobile systems are willing to answer a survey on objects eligible to de- scribe the route due to the objects’ salience. Because users will answer these questions unsupervised, the way questions are phrased and understood must be considered carefully in order to ensure valid results. Consequently, as a first, fundamental step towards a salience survey this paper reports on a study, conducted to answer two research questions concerning the way peo- ple interact with questions on visual aspects: 1) Does the way people read questions suggest to use shorter questions? 2) Do participants rate visual di- mensions in an absolute manner if the question suggests this interpretation?
Accordingly, the section on related work, which will be presented next, focuses on empirical work on gathering salient object data. The results re- garding both questions will lead to the conclusion that shorter questions are advisable and participants’ attention should be called to judge visual dimen- sion based on the objects’ surroundings.
2 Empirical studies on salience do not deal with wording — related work
Although there are numerous publications on the theoretical framework of salience (cf. e.g. Sorrows 1999, Raubal 2002, Caduff 2008), empirical inves- tigations in real-world, outdoor environments are rather rare. Ishikawa (2012) reports on a study in a city in Japan, whereby participants were asked to name objects they would use to describe the route and give reasons, why a particular object was chosen. Likewise, Schroder (2011) investigated classes of objects, which may be considered salient, and the features contributing to their salience. Nevertheless, neither Schroder (2011) nor Ishikawa (2012) use
a survey and, hence, do not deal with the particular problem of question phrasing. Similarly, there are no publications regarding the use of local neighbourhoods when asked to rate an object’s salience using various fea- tures. However, to understand the way participants make use of questions is particularly desirable for collaborative filtering like methods like CLM be- cause controlling the situation when questions are answered is impossible.
3 Participants walk on a route, rate objects, and give details about their thoughts — empirical method
An in-situ experiment was set up in order to get a first insight into the way people understand the questions of a survey designed to measure the salience of objects. Each of n = 90 participants (most of them were students) had to walk on a route of 1.1 km length together with one of 45, carefully-instructed student experimenters. Each participant rated 11 objects (buildings, public amenities or monuments randomly selected from a set of 78 objects identi- fied as salient in a pre-study) along the route: using a survey with 12 ques- tions, six questions were related to the visual aspects col(our), loc(ation), siz(e), sha(pe), con(dition), sig(nage) derived from Schroder (2011). All questions regarding visual dimensions were phrased in a standardised way:
“How salient is this object’s <<dimension>>”. The remaining questions were related to categorising, naming and the route itself. Once an object was rated, participants were asked by the experimenter whether they read each of the questions thoroughly (Q1). If not, they were encouraged to give reasons.
Furthermore, for each of the six visual dimensions one out of the 11 objects was randomly chosen and participants were asked to recall their considera- tions for this particular dimension and object (Q2; “One of the questions you had to answer regarding the current object was “How salient is this object’s
<<dimension>>”? Please tell me about your aspects, which influenced your decision, when answering this question.”). In the case of both questions the experimenters took notes on the answers given.
4 Participants stop reading the whole question and do make inconsistent use of surroundings — results
Do participants read the whole question?
Giving an answer to this question is of major importance with respect to the efficiency of inquiry in future real world situations (i.e. CLM): If users stop to read the whole question because each of them was phrased the same way, it seems to be desirable to present the dimensions in a less formal way, e.g.
using a star-rating system. Due to missing data, 19 participants had to be ex- cluded from the analysis. Figure 1 presents the counts of yes’s and no’s for Q1 given in the order of the landmarks for the remaining nQ1 = 71 partici- pants. The figure clearly indicates a correlation of time and counts: The num- ber of participants who read each of the questions as a whole decrease for the first 6 objects, whereas the number of those, who do not, increase.
Figure 1. Answers for Q1. Zero indicates not fully read.
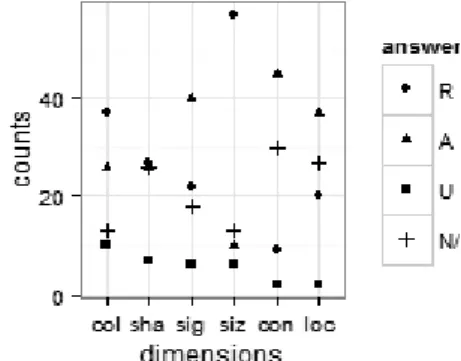
Figure 2. Answers for Q2. “R” indicates surroundings explicitly used; “A” explicitly not; “U” not clearly stated.
A closer look at the explanations given reveals the importance of the recur- rence of questions. Participants do stop reading questions as a whole if they feel as if they know them well enough (P(well-known|no) ≥ .55 as of object 3).
Moreover, figure 1 suggests that a subset of participants is likely to continue reading the whole question, i.e. the counts of yes’s and no’s remains almost constant as of object 7.
Do participants judge visual aspects in an absolute manner?
Four of the original 90 participants had to be excluded because none of the think-aloud questions were answered. Figure 2, which provides counts for each of the visual dimensions (nQ2 = 86), shows that people do not act consis- tently in terms of how they determine the salience of an object. Although the wording of the question did not encourage them to base their judgements on other objects in the neighbourhood, the majority of participants compare the features to the object’s local surroundings when rating dimensions colour and size but do not for signage, condition and location. However, any of the latter could be judged based on the object’s surroundings, as well.
Discussion
Regarding Q1 the numbers of those reading the whole question and those, who do not, converge. Shorter questions on visual dimensions will accom- modate the “non-readers”, who may be irritated by long and recurring ques- tions. Furthermore, shorter questions will decrease the amount of time needed to answer the survey. Both aspects will most likely improve the vali- dity of the survey results. With respect to Q2 participants should be encour- aged to explicitly ground their ratings on the object and its surroundings, which will enhance validity, as well. This is all the more true, as a relative judgment of a feature’s salience suffices to use this dimension in a route in- struction: In a neighbourhood with whitewashed houses, a blue coloured house may be an useful point of reference, no matter if its tone is loud or rich – and it may not be working if all façades were painted rich blue. Moreover, the answers given to Q2 reveal the distinction of tone and intensity as inher- ently important: Some participants rated colour intensity whereas “colour”
intended tone. It is advisable to distinguish these by using two questions, one concerning intensity and another concerning tone. Finally, for both questions, a rather large number of N/As attracts attention: Some of these are due to technical issues. However, the remaining N/As may be attributed to three reasons: obviously neglected (which was the case for Q1 and Q2), repeating the previously given answer instead of explaining one’s thoughts (in case of Q2), and explaining one’s thoughts on other dimensions instead of the one currently asked for (in case of Q2), respectively. Therefore, it seems to be advisable not to rely on student experimenters when investigating the wor- ding of questions: Any of these reasons is easily avoidable during semi-con- trolled experiments.
5 The way questions are asked matters — conclusion
The study presented investigates the way people deal with questions. The empirical method used was an in-situ experiment, asking participants to rate objects and to comment on their thoughts. The results indicate major direc- tions for future work. Firstly, due to schematized phrasing of questions on visual dimensions participants tend to stop reading questions fully. Hence, a star-rating-system can be used. Presumably, a mode of presentation like this will encourage users to participate in CLM in the future, because it is well- known from websites. Secondly, it is advisable to explicitly encourage par- ticipants to base the assessment of an object’s visual dimensions on its sur- roundings. This will improve data quality in terms of consistency. Thirdly, regarding colour as a visual dimension, using separate questions for tone and intensity seems to be sensible.
Acknowledgments
I would like to thank Prof. Dr. R. Hammwöhner, Dr. D. Elsweiler and two ano- nymous reviewers for valuable feedback. Furthermore, thanks to Dr. S. Bienk, all student experimenters and their participants.
References
Caduff, D. & Timpf, S. (2008). On the assessment of landmark salience for human navigation. Cognitive Processing, 9, 249–267.
Ishikawa, T. & Nakamura, U. (2012). Landmark Selection in the Environment: Rela- tionships with Object Characteristics and Sense of Direction. Spatial Cognition &
Computation, 12, 1–22.
Kattenbeck, M., Müller, M., Ohm, C., Ludwig, B. (2015). Der Weg ist das Ziel – Fußgängernavigation ist Forschung zu Information Behavior. Information – Wis- senschaft & Praxis, 66 (1).
Ludwig, B., Bienk, S., Kattenbeck, M., Müller, M., Ohm, C., Einmal, M., Glaser, T., Hackl, M., Oreskovich, M., Schubart, L. (2013). Do You Recognize that Buil- ding’s Facade? Künstliche Intelligenz, 27 (3), 241–246.
Michon, P.-E. & Denis, M. (2001). When and Why Are Visual Landmarks Used in Giving Directions? In: Montello, D. (Ed.). Spatial Information Theory, Springer, 2001, pp. 292–305.
Raubal, M. & Winter, S. (2002). Enriching Wayfinding Instructions with Local Landmarks, In: Egenhofer, M. & Mark, D. (Eds.). Geographic Information Sci- ence, Springer, pp. 243–259.
Schroder C. J.; Mackaness, W. A. & Gittings, B. M. (2011). Giving the ‘Right’
Route Directions: The Requirements for Pedestrian Navigation Systems, Trans- actions in GIS, 15, 419–438.
Sorrows, M. & Hirtle, S. (1999). The Nature of Landmarks for Real and Electronic Spaces Spatial Information Theory, In: Freksa, C. & Mark, D. (Eds.). Cognitive and Computational Foundations of Geographic Information Science, Springer, pp. 37–50.
Xia, J. C.; Richter, K.-F.; Winter, S. & Arnold, L. (2011). A Survey to Understand the Role of Landmarks for GPS Navigation. In: The 7th PATREC Research Forum [Planning and Transport Research Centre], PATREC Research Forum, pp. 1–15.