Research Collection
Journal Article
Fe(II) interaction with cement phases: Method development, wet chemical studies and X-ray absorption spectroscopy
Author(s):
Mancini, Andrea; Wieland, Erich; Geng, Guoqing; Lothenbach, Barbara; Wehrli, Bernhard; Dähn, Rainer Publication Date:
2021-04-15 Permanent Link:
https://doi.org/10.3929/ethz-b-000470682
Originally published in:
Journal of Colloid and Interface Science 588, http://doi.org/10.1016/j.jcis.2020.11.085
Rights / License:
Creative Commons Attribution 4.0 International
This page was generated automatically upon download from the ETH Zurich Research Collection. For more information please consult the Terms of use.
ETH Library
Regular Article
Fe(II) interaction with cement phases: Method development, wet chemical studies and X-ray absorption spectroscopy
A. Mancini
a,b, E. Wieland
a,⇑, G. Geng
a,c, B. Lothenbach
d,e, B. Wehrli
b, R. Dähn
aaPaul Scherrer Institut, Laboratory for Waste Management, 5232 Villigen PSI, Switzerland
bETH Zurich, Institute of Biogeochemistry and Pollutant Dynamics, 8092 Zurich, Switzerland
cNational University of Singapore, Department of Civil and Environmental Engineering, 117576, Singapore
dEmpa, Laboratory for Concrete & Construction Chemistry, 8600 Dübendorf, Switzerland
eNTNU, Department of Structural Engineering, Trondheim, Norway
g r a p h i c a l a b s t r a c t
a r t i c l e i n f o
Article history:
Received 24 September 2020 Revised 11 November 2020 Accepted 23 November 2020 Available online 25 November 2020
Keywords:
Ferrous iron
Calcium silicate hydrates X-ray absorption spectroscopy Sorption
a b s t r a c t
Fe(II) interaction with cement phases was studied by means of co-precipitation and sorption experiments in combination with X-ray absorption fine structure (XAFS) spectroscopy. Oxidation of Fe(II) was fast in alkaline conditions and therefore, a methodology was developed which allowed Fe(II) to be stabilised in the sorption experiments and to prepare samples for spectroscopy. X-ray diffraction (XRD) of the co- precipitation samples showed uptake of a small portion of Fe(II) by calcium-silicate-hydrates (C-S-H) in the interlayer indicated by an increase in the interlayer spacing. Fe(II) incorporation by AFm phases was not indicated. Wet chemical experiments using55Fe radiotracer revealed linear sorption of Fe(II) irre- spective of the Ca/Si ratio of C-S-H and equilibrium pH. The Kdvalues for Fe(II) sorption on C-S-H are more than three orders of magnitude lower as compared to Fe(III), while they are comparable to those of other bivalent metal cations. XAFS spectroscopy showed Fe(II) binding by C-S-H in an octahedral coor- dination environment. The large number of neighbouring atoms rules out the formation of a single surface-bound Fe(II) species. Instead the data suggest presence of Fe(II) in a structurally bound entity.
The data from XRD and XAFS spectroscopy suggests the presence of both surface- and interlayer- bound Fe(II) species.
Ó2020 The Author(s). Published by Elsevier Inc. This is an open access article under the CC BY license (http://creativecommons.org/licenses/by/4.0/).
https://doi.org/10.1016/j.jcis.2020.11.085
0021-9797/Ó2020 The Author(s). Published by Elsevier Inc.
This is an open access article under the CC BY license (http://creativecommons.org/licenses/by/4.0/).
⇑Corresponding author.
E-mail address:erich.wieland@psi.ch(E. Wieland).
Contents lists available atScienceDirect
Journal of Colloid and Interface Science
j o u r n a l h o m e p a g e : w w w . e l s e v i e r . c o m / l o c a t e / j c i s
1. Introduction
Corrosion-induced damage is by far the most common cause of deterioration limiting the durability of reinforced concrete and thus the service life of concrete structures (e.g. [1,2]). Corrosion of reinforcing steel bars accounts for the conversion of Fe(0) into Fe(II,III) corrosion products and the interaction of Fe(II,III) ions with cement phases at the iron-cement interface (e.g. [1,3,4]).
The interaction of ferrous iron (Fe(II)) with cement phases is pre- sently poorly understood. Stefanoni et al.[5]developed a concep- tual model which describes the fate of ferrous ions released by anodic iron dissolution in terms of a competition between the kinetics of Fe(II) oxidation and its transport in the pore solution of concrete. The model predictions suggest that the pore solution is always under-saturated with respect to Fe(II)-containing solids in natural corrosion environments, which allows Fe(II) diffusion to be observed up to a few millimetres away from the steel surface.
Fe(II) ions remain in the dissolved chemical form and diffuse before being oxidised to Fe(III). Below the Fe(II) solubility in alkaline con- ditions, Fe(II) uptake by cement phases determines the aqueous Fe (II) concentration in the cementitious environment and conse- quently the concentration gradient relevant to diffusive transport.
Assessment of the interaction of ferrous iron with cement phases is further significant in connection with the safe disposal of low- and intermediate-level radioactive waste (L/ILW). For example, the planned cement-based deep-mined geological L/
ILW repository in Switzerland will contain large amounts of irradi- ated metallic waste, in particular iron and carbon steel embedded in cementitious materials, which corrode over time [6]. Limited information is available on the long-term geochemical evolution of the interface between iron/steel and cement in anoxic condi- tions (e.g. [7]), in particular Fe(II,III) uptake by cement phases and possible changes of the mineral composition of cement paste due to corrosion-induced effects. Note that cementitious materials will act as the main barriers retarding the release of radionuclides from the cementitious near field into the host rock.
Archaeological artefacts buried in anoxic carbonated soil envi- ronments showed siderite, iron hydroxy carbonates and magnetite as the main corrosion products (e.g.[7,8]). In carbonate-depleted conditions, the formation of magnetite (‘‘black rust”) was observed to be the main corrosion product, for example reinforcement steel subjected to anoxic corrosion for almost one hundred years [9].
Nevertheless, there is no evidence from current studies on the anoxic corrosion of artefacts whether or not Fe(II) may interact with cement phases over the service life of an L/ILW repository, that is up to 105years.
The interaction of ferric iron (Fe(III)) with cement phases has been investigated in detail over the past decade. Fe(III) was found to replace Al(III) in Al(III)-bearing cement phases, such as Fe- ettringite [10,11], Fe-AFm phases [12,13], as well as siliceous hydrogarnet[14]. In addition, synchrotron-radiation-based studies showed that Fe/Al siliceous hydrogarnet is the thermodynamically most stable Fe(III)-bearing phase in Portland cement [15,16].
Recent investigations revealed strong uptake of Fe(III) by colloidal calcium-silicate-hydrate (AC-S-H) phases[17], which is the most abundant constituent of cement paste and the most important host phase controlling the uptake of metal cations by cementitious materials [18]. Structural studies showed Fe(III) uptake into the interlayer of AC-S-H phases at Ca/Si ratios of 1.2 and 1.5, while Fe(III) bonding on the surface ofAC-S-H phases was suggested to occur at a low Ca/Si ratio of 0.8[17].
Studies on Fe(II) interaction withAC-S-H phases are especially challenging due to the limited stability field of Fe(II) in strongly alkaline conditions[19]. By contrast, the uptake of various bivalent, redox-stable cations by AC-S-H phases has been investigated in
the last decades, such as Zn(II)[20–22], Sr(II)[23], Ra(II)[24,25], Pb(II)[26,27]and Ba(II)[28]. In addition to the immobilisation of bivalent metal cations,AC-S-H phases play a prominent role in the immobilisation of tri- and tetravalent actinides[29–33]. The latter studies provided ample evidence that, inAC-S-H, Ca(II) sub- stitution by trivalent actinides in the CaO layer and by tetravalent actinides in the interlayer are the dominant mechanisms of acti- nide binding.
The present study aimed at developing a sound methodology for investigating the interaction of Fe(II) with cement phases (AC-S-H, monosulphate, and monocarbonate) on the basis of wet chemistry experiments carried out in alkaline anoxic conditions and by using X-ray absorption spectroscopy (EXAFS, XANES). Sorp- tion experiments withAC-S-H phases were conducted in electro- chemical cells in order to control the redox state of ferrous iron.
X-ray absorption near edge spectroscopy (XANES) was employed to verify the redox state of Fe(II). A sorption mechanism for Fe(II) binding byAC-S-H phases is proposed on the basis of the X-ray diffraction (XRD) data from the co-precipitation experiments and structural parameters derived from extended X-ray absorption fine structure (EXAFS) spectroscopy. Eventually, the extent of Fe(II) interaction withAC-S-H phases is compared with that of bivalent metal cations.
2. Materials and methods
All solutions were prepared using Fluka or Merck analytical grade (‘‘pro analysis”) chemicals. Ultrapure (deionised, de- carbonated) water (Milli-QÒwater, 18.2 MX.cm resistance) used for the preparation of solutions and for sample dilution was gener- ated by a Milli-Q Gradient A10 purification system (Millipore, USA). Ultrapure water was boiled for 2 h under continuous N2
purge in order to prepare degassed water. The O2concentration of the degassed water was measured and found to be below the detection limit (1 ppb) of a PreSens PSt6 planar oxygen sensor (Regensburg, Germany). All wet chemistry experiments were con- ducted in glove boxes under an inert N2atmosphere (O2, CO2< 0.
1 ppm).
2.1. Chemical stability of Fe(II) in alkaline solution
The chemical stability of Fe(II) was investigated as a function of time in the pH range between 3 and 9 at initial Fe(II) concentra- tions below the Fe(II) solubility (~105M at pH 9; seeFig. S5in Supplementary Information (SI)). A stock solution of 104M FeCl2
at pH 2 was prepared and diluted in polyethylene (PE) flasks to the desired initial Fe(II) concentration. The pH was adjusted by adding appropriate volumes of 1.0 M NaOH. Ultrapure, degassed water was used and all the experiments were carried out inside the glove box with an inert N2atmosphere to minimise O2contamination.
2.2. Synthesis ofAC-S-H phases
TheAC-S-H phases were prepared as described elsewhere[17].
In brief, theAC-S-H phases were synthesised by mixing CaO (cal- cium oxide) and SiO2(silica fume Aerosil 300 from Evonik Indus- tries AG, Germany) at different proportions according to the target Ca/Si ratios (i.e. 0.8 and 1.5) by using the ‘‘direct reaction”
method reported elsewhere[34]. CaO was prepared by decompos- ing CaCO3 (Merck, Germany) at 1000°C until the weight of the material was constant. CaO and SiO2were mixed with ultrapure, degassed water to prepare a suspension at a solid-to-liquid (S/L) ratio of 5 g/L (based upon the dry mass CaO + SiO2). The equilib- rium pH values of the AC-S-H suspensions were 11.5 at target
Ca/Si = 0.8 and 12.5 at target Ca/Si = 1.5. The suspensions were stored in closed PE flasks. Prior to use, the suspensions were equi- librated on an end-over-end shaker for one month in the glove box with N2atmosphere.
2.3. Co-precipitation experiments
Co-precipitation samples ofAC-S-H phases, AFm (Al2O3-Fe2O3- mono) phases and AFt (Al2O3-Fe2O3-tri) phases were prepared by replacing Ca(II) with Fe(II). FeO (Merck, Germany) was used as Fe (II) source.AC-S-H samples were prepared according to the proce- dure described inSection 2.2by replacing 10% CaO (on a mol basis) by FeO. Monosulphate (AFmSO4) and monocarbonate (AFmCO3) were synthesised using Al2O3, CaO, FeO (replacing 10% CaO on a mol basis), and Na2SO4or Na2CO3(Merck, Germany), respectively.
Appropriate amounts of the starting materials were mixed in 250 mL NaOH according to the stoichiometric ratio of the target compounds. The equilibrium Na concentration was 0.2 M (pH 13). The FeO-containing co-precipitation samples were aged at T = 60°C for six months, respectively. An aliquot of each suspen- sion was sampled for characterisation. To this end, the solid and liquid phases were separated by centrifugation (1 h at 95,000 g) under N2atmosphere. The solid phases were dried over a saturated NaOH solution (~8% relative humidity) in an airtight box placed in the glove box with the inert N2atmosphere and subsequently anal- ysed by XRD and XANES.
2.4. Sorption experiments
The sorption experiments with Fe(II) onAC-S-H phases were conducted in electrochemical cells (Fig. 1). The equipment was modified after Soltermann et al.[35]and is based on the electro- chemical method reported earlier by Aeschbacher et al.[36]. The electrochemical cell consists of the bulk and matrix compartments.
The bulk compartment contains the Fe(II)-containing suspension
to be kept in reducing conditions whereas the matrix compartment contains only the equilibrium solution of the Fe(II)-containing sus- pension. The two compartments are separated by an anion exchange membrane (FAB, Fumatech BWT, Germany), which retards the diffusion of the cations between the two compartments and subsequent oxidation of Fe(II) at the anode. The cell is equipped with three electrodes. The bulk compartment harbours an Ag/AgCl reference electrode (eDAQ, Australia) and a glassy car- bon working electrode type Sigradur (HTW, Germany). A coiled wire platinum auxiliary electrode (Bioanalytical Systems Inc., USA) is inserted in the matrix compartment. A VMP3 multi- potentiostat (Bio-Logic, France) was used to monitor the current I (A) over time t(s) and to control the redox potential at the working electrode.
Sorption studies with Fe(II) on the synthesisedAC-S-H phases were carried out to quantify the sorption isotherm (sorbed Fe(II) vs. aqueous Fe(II)). Suspensions of the AC-S-H phases with the two different target Ca/Si ratios (0.8 and 1.5) were used at equilib- rium pH (11.5 and 12.5). For each Ca/Si ratio, five electrochemical cells containing theAC-S-H suspension (78 mL) were operated at Eh=1.0 V(SHE) for two days prior to labelling with55Fe tracer.
In addition, an electrochemical cell containing the55Fe tracer solu- tion was prepared and equilibrated for two days at the same Ehto reduce Fe(III) to Fe(II). The tracer solution was prepared by label- ling a FeCl2solution (70 mL, 5103M) with a55Fe radiotracer (t1/2= 986 days, PerkinElmer Inc., USA, 1.7 MBq in 0.01 mL 1 M HCl) resulting in a concentration ratio of active Fe/inactive Fe = 6 .9 106. An appropriate volume of reduced 55Fe solution was added to theAC-S-H suspensions (range of volume 5 103 10 mL), which were subsequently equilibrated for 10 days. The sorption isotherms were determined at initial Fe concentrations ranging from 2.7107M to 8.2104M. Note that the S/L ratio was slightly different in the electrochemical cells (range 4.38 – 5 g/L), which was considered during data treatment. Sampling and radio assay were conducted as reported previously[17]. In brief, an aliquot
Fig. 1.Electrochemical cell modified after Soltermann et al.[35]and used for the sorption studies with Fe(II). The bulk compartment consists of an Ag/AgCl reference electrode and a cylindrical glassy carbon working electrode. A platinum wire auxiliary electrode is inserted in the matrix compartment. The two compartments are separated by an anion exchange membrane.
of each suspension was withdrawn after equilibration and diluted with 0.01 M HCl in order to dissolve the solid phase.
Solid-liquid phase separation of the remaining suspension was carried out by centrifugation (1 h, 95,000 g). Note that the centrifuge was placed inside the glove box with N2atmo- sphere. After centrifugation, aliquots of the supernatant solu- tion were sampled in duplicates and along with the acidified suspensions, standards and blanks analysed by liquid scintilla- tion counting (LSC) using a Perkin Elmer Tri-Carb A2750 LSC.
Samples for LSC were prepared by mixing 5 mL aliquots of the acidified suspensions or the supernatant solutions, respec- tively, with 15 mL scintillator (Ultima Gold XR, Packard Bio- science, USA). The 55Fe activity was quantified in the energy window set between 2 and 10 keV. As in the previous study with Fe(III) [17] it was observed that the solid contents of the suspensions were too low to cause a significant quenching effect. Standards and blanks were prepared to match the solu- tion compositions of the samples.
The uptake of55Fe ontoA C-S-H phases can be expressed in terms of a distribution coefficient Kdas described previously for Fe(III)[17]. The Kdvalue accounts for the partitioning of the radio- tracer between solid and liquid phase in case of linear sorption and it is defined as follows:
Kd¼Cs;eq
Cl;eqV
M¼ðC0Cl;eqÞ Cl;eq V
M ðm3kg1Þ ð1Þ whereCs,eqis the Fe concentration sorbed onAC-S-H phases [mol/
kg] at equilibrium, andCl,eqis the equilibrium concentration in solu- tion quantified via55Fe [mol/m3]. The difference between the initial Fe concentration in suspension (C0) and the concentration deter- mined in the supernatant (Cl,eq) corresponds to sorbed Fe.Mis the dry weight of theAC-S-H phase [kg], andVis the volume of solution [m3]. The dry weight is equal to the sum of CaO and SiO2used for AC-S-H synthesis at the target Ca/Si ratio. This means that water is disregarded in the mass calculations. High55Fe activities (count rate of initial55Fe-containing suspension > 5105cpm/mL) were utilised in the sorption experiments which allowed the Kd value to be quantified on the basis of statistically significant count rates [37]. The initial55Fe activity of the suspension was determined from an aliquot withdrawn from the suspension prior to phase separa- tion by centrifugation, while the activity in solution (Cl,eq) was determined from an aliquot of the supernatant solution after phase separation.
2.5. Spectrophotometric measurements
The ferrozine method described by Viollier et al.[38]was used to determine the Fe(II) concentration in solution. Absor- bance of the Fe(II) coloured complex was recorded with a Cary 6000i spectrophotometer (Agilent, USA) at 562 nm wavelength and using either 1 cm or 5 cm quartz cells (Starna Scientific, UK) depending on the optic path length required to quantify the Fe(II) concentration above the detection limit of the method.
2.6. XRD
X-ray diffraction (XRD) measurements were conducted on a PANanalytical X’Pert Pro MDF diffractometer using CoK
a
radiationand an X’Celerator detector. Diffraction patterns were collected from 5°to 70°2hat a step size of 0.017°2hand a counting time of 0.6 s per step.
2.7. Synchrotron-based investigations 2.7.1. Sample preparation
Fe K-edge X-ray absorption fines structure (XAFS) spectroscopy was performed on the Fe(II)-loaded C-S-H phases synthesised according to the procedure described above. The Fe(II)-loaded AC-S-H samples were prepared in two ways, firstly by applying the batch-type technique and secondly in electrochemical cells.
For the preparation of the former samples, appropriate volumes of a FeCl2solution (5103M) were added to theAC-S-H suspen- sions in centrifuge tubes in order to prepare samples with the tar- get Fe(II) loadings (~2800 ppm). The suspensions were equilibrated for 14 days in the glove box with N2atmosphere. After equilibra- tion, the suspensions were centrifuged (1 h, 95,000 g), the super- natant solutions were discarded and the pastes were used for the XAFS studies.
For the preparation of the samples in the electrochemical cell, appropriate volumes of the FeCl2solution (5103M) were added to the AC-S-H suspensions (Ca/Si of AC-S-H = 0.8 and 1.5) to achieve the target Fe(II) loadings of~20800 ppm (0.05 mol/kg) Fe(II) and equilibrated for 2, 8 and 14 days at the applied redox potential. After equilibration, the suspensions were centrifuged (1 h, 95,000 g) inside the glovebox, the supernatant solutions were discarded and the pastes were used for the XAFS studies.
The same methodology was employed for the preparation of the Fe(II)-loaded AFm phases. A more concentrated stock solution of Fe (Cl2(5102M) was added due to the higher S/L ratio (ca. 40 g/L) of the suspensions. The suspensions were equilibrated for 2 days and had a Fe(II) loading of~6100 ppm.
Fe(OH)2(s) was prepared in the glove box with inert N2atmo- sphere by dissolving 5.56 g FeSO47H2O in 200 mL ultrapure, degassed water followed by subsequent addition (3 mL/min) of 150 mL 0.193 M NaOH under vigorous stirring. The precipitate was filtrated, and the wet precipitate dried at 60°C in an oven inside the glove box.
The residual wet pastes obtained from the preparation of the Fe (II)-loaded cement phases and the Fe(II) reference (diluted with boron nitride) were confined in Plexiglas sample holders and sealed with Kapton tape. The samples were taken out of the glove- box, shock frozen in liquid N2, stored in a Dewar filled with liquid N2(CX100, Worthington Industries, USA) and shipped in cryogenic conditions to the synchrotron facilities.
2.7.2. Data collection and fitting
The XAFS studies were conducted at beamline B18 (Diamond, Didcot, UK) and at beamline BL 11–2 (Stanford Synchrotron Radia- tion Lightsource (SSRL), Menlo Park, USA). The two beamlines are equipped with a Si crystal monochromator (B18: Si(1 1 1); BL 11–
2: Si(2 2 0)) and high-rate detectors (B18: 9-element Ge solid state detector; BL 11–2: 100-pixel Ge solid-state monolith). The monochromator angle was calibrated by assigning the energy of 7112 eV to the first inflection point of the Fe K-edge spectrum of an iron foil. Measurements of the frozen samples were performed in fluorescence mode. The risk of O2diffusion into the samples was minimised by maintaining cryogenic temperatures with the help of liquid nitrogen (LN2) cryostats at both beamlines. For each sample, several fluorescence spectra were acquired. The data were dead- time corrected, deglitched if necessary, and merged. Extended X- ray absorption fine structure (EXAFS) spectra and X-ray absorption near edge spectra (XANES) were recorded up to 12 Å1and 8 Å1, respectively.
The ATHENA software package was used for data reduction fol- lowing standard procedures [39]. After background subtraction, the energy was converted to photoelectron wave vector units (Å1) by assigning the ionisation energy of the Fe K-edge (E0= 7112 eV) to the first inflection point of the absorption edge.
Radial structure functions (RSFs) were derived by Fourier trans- forming the k3-weightedv(k)spectra between 2.0 and 11.0 Å1 using a Kaiser-Bessel window function with a smoothing parame- ter of 4.
Least-square linear combination (LC) fitting of the XANES was performed to quantify the contribution of the reference spectra to the spectra of the co-precipitation samples expressed as the sum of the reference compounds with weighting coefficients rang- ing between 0 and 1. The spectra of Fe(II)- and Fe(III)-doped AFm andAC-S-H C-S-H phases as well as FeO were used as references.
The EXAFS spectra of the Fe(II)-loadedAC-S-H sorption sam- ples were analysed by multi-shell fits in real space across the first three shells (DR = 1 to 5 Å1) in order to determine the structural parameters of the absorber atom (coordination number (N), bond length (R), Debye-Waller (
r
2) factor). Theoretical scattering paths were calculated using FEFF 8.4[40,41]and different model com- pounds. The goodness of the fit was evaluated based on the resid- ual factor (R-factor). The amplitude reduction factor (S02) was fixed to 0.83 as previously reported by Wang et al.[42].3. Results
3.1. Solubility and oxidation of Fe(II)
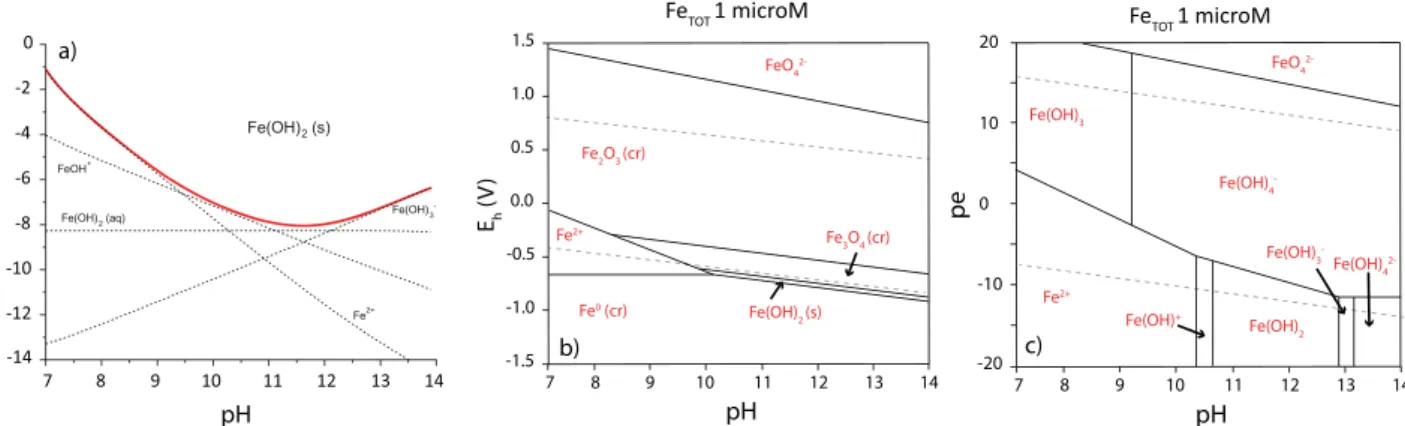
Solubility and redox stability of Fe(II) are the basic information required to assess the chemical behaviour of Fe(II) in cementitious environments. Fe(OH)2(s) is considered to be the solubility- limiting phase in cementitious systems in the absence of reduced sulphur species (Fig. 2a). The aqueous Fe(II) concentration is esti- mated to be very low, i.e. ranging in value from 108 M (pH 11.5) to 107M (pH 10 and 13) based on recently published ther- modynamic data for Fe(II) species[43–45]. The stability field of Fe (OH)2was calculated by considering the thermodynamically most stable Fe(II,III) compounds expected to be formed in sulphur-free conditions (Fig. 2b).Fig. 2b shows that the stability field of Fe(II) is very narrow in alkaline conditions. Therefore, Fe(II) is expected to be susceptible to changes in the redox conditions and may read- ily oxidise to Fe(III).
The oxidation of aqueous Fe(II) below pH 7 has been described more than a century ago[46]in terms of the following kinetics:
d½Fe2þ
dt ¼k½Fe2þ½OH½O2 ð1Þ
where [Fe2+] is the concentration of ferrous iron, and [O2] and [OH] denote the oxygen and hydroxyl ion concentrations in solution.
Towards the alkaline pH range the oxidation kinetics shifts to sec- ond order in the OHconcentration [47,48]. Several studies have
reported Fe(II) oxidation in the acidic to near-neutral pH range in accordance with the kinetics given by Eq.(1), see e.g.[49–54], indi- cating a faster oxidation at increasing pH value.
Fig. 3a shows measurements of the redox stability of aqueous Fe (II) at different pH values and at low O2concentrations as carried out in this study. The initial Fe(II) concentration was set to 105 M, which is below the solubility of Fe(OH)2up to a pH of~9. At pH 7 and above, the measured Fe(II) concentration rapidly decreased with time indicating fast oxidation of Fe(II) to Fe(III).
The oxidation was faster at pH 9 than at 8.1 or 7.2. At pH 3, Fe (II) oxidation was not observed which corresponds to earlier obser- vations of a very slow kinetics in this pH range[56]. The rate con- stant was not determined as the aqueous O2concentration could not be precisely quantified and the O2 content in the N2 atmo- sphere of the glovebox was only known to be <0.1 ppm. In the ini- tial phase, the oxidation of Fe(II) was retarded at all pH values and this phase lasted longer at decreasing pH. The reason for the pH dependence of the time lag until Fe(II) oxidation started is pre- sently not known.
In this study, Fe(II) oxidation was observed although ultrapure water boiled under N2 purge was used and all the experiments were performed inside the glove box with N2atmosphere to min- imise O2 contamination. Note that the O2 concentration in the ultrapure, degassed (‘‘O2-free‘‘) water was found to be below the detection limit of a commercial O2 sensor (detection limit
~1 ppb). Oxidation of Fe(II) presumably occurred due to the slow, but continuous ingress of O2 from the glove box atmosphere (<0.1 ppm O2) into the closed, but not gas-tightly sealed centrifuge tubes used for the experiments.
For the sake of comparison,Fig. 3b shows the results from stud- ies on the redox stability of Fe(II) in natural, O2-saturated water samples in the weakly acidic to near-neutral pH range, i.e. seawa- ter from the North Sea[50]and fresh water from a Swiss lake[51].
As expected, the oxidation of Fe(II) in the quasi ‘‘O2-free‘‘ experi- ments carried out in this study was significantly slower as com- pared to Fe(II) oxidation in natural waters at ambient O2
concentration (note the different scales in the x-axes ofFig. 3a/
b). In both natural waters, the aqueous Fe(II) concentration decreased with increasing pH, as observed in the present study car- ried out in ultrapure, degassed water, even though the oxidation seems to be slower in seawater as compared to fresh water. Differ- ences between the two systems have been ascribed to the com- plexation effects of chloride[48,54].
Attempts were undertaken to stabilise Fe(II) by adding sodium dithionite (Na2S2O4) at pH 3.0, 7.2 and 8.1 as previously reported by Soltermann et al.[35]. Preliminary tests showed that the addi- tion of Na2S2O4had no detrimental effect on the ferrozine method
Fig. 2.a) Solubility of Fe(II)-hydroxide calculated with the Gibbs Energy Minimization Selektor (GEMS) code[55]and the PSI thermodynamic database[43,44]including the thermodynamic properties of Fe(II) species from a recent review[45]; b, c) Pourbaix diagrams calculated for a total Fe(II) concentration of 106M including solids (b) or aqueous species (c).
as the same Fe(II) concentrations were recorded in the samples with and without Na2S2O4(data not shown). The results revealed that Na2S2O4did not suppress the oxidation of Fe(II) in the slightly alkaline pH range, indicating that Na2S2O4cannot be used to sta- bilise Fe(II) in these conditions (Fig. 3a). This finding is in accor- dance with Stucki et al. [57] who reported that the effect of Na2S2O4as a reducing agent may depend on the pH of the solution.
In summary, the kinetic studies on the oxidation of Fe(II) in alkaline, degassed solution with a low (while not quantifiable) O2
concentration revealed that the development of a methodology was required, which allowed Fe(II) to be stabilised for sorption experiments on A C-S-H phases and the preparation of Fe(II)- loaded samples for XAFS investigations (seeSupplementary Infor- mation). The methodology utilising electrochemical cells allowed reducing conditions to be controlled by setting the Eh =1.0 V (SHE), which is slightly below the border of water stability in strongly alkaline conditions. The latter potential was applied to establish redox conditions based on the stability field of Fe(OH)2
(Fig. 2b).
3.2. Co-precipitation experiments
The remarkable stoichiometric and structural variability of cement phases, in particular of theAC-S-H phase, prompted us to investigate the substitution of Ca(II) by Fe(II) although the ionic radii of the two cations differ significantly, i.e. Ca(II) with r = 1.08 to 1.20 Å in VI-VIII coordination and Fe(II) with r = 0.69 and 0.86 Å in VI low and high spin coordination, respectively[58,59]. How- ever, Fe(II) could replace Ca(II) inAC-S-H phases in a way similar to Zn(II) (r = 0.68–0.98 in IV-VIII coordination[58]) as previously observed by Ziegler et al.[20].
The co-precipitation experiments carried out in this study aimed at assessing the possibility of Ca(II) - Fe(II) replacement in cement phases. A portion of CaO used for synthesising the cement phases was replaced by FeO (10% on a mol basis). Diffractograms of pure AC-S-H 0.8, AC-S-H 1.5, AFmSO4, and AFmCO3 were com- pared with the co-precipitation samples aged for six months at T = 60 °C (Fig. 4). The XRD data show that, despite the presence of FeO, the synthesis of the targeted cement phases was successful, while some differences in the XRD patterns of the pure phases and the co-precipitation samples were noticed. For example, peaks at 2h= 42°were detected in the XRD pattern of AFm andAC-S-H phases, in addition to the peaks at higher angles (49° and 72°; not shown), which indicate the presence of unreacted FeO. This
finding shows that FeO was not completely dissolved during syn- thesis. Other, minor differences in the peak intensities and posi- tions appeared in the XRD pattern of AC-S-H phases, such as a broadening of the peak shoulder at 2h= 35°. An increase of the basal spacing of bothAC-S-H phases was observed based on the shift of the first peak at 2h~9°10°to lower values, i.e. 2h= 7.8° in the case ofAC-S-H 0.8 and 2h= 8.7°in the case ofAC-S-H 1.5 (Fig. 4a). This indicates changes in the phase composition in the presence of FeO and indirectly Fe(II) uptake into the interlayer of AC-S-H phases. The same indicative feature was observed in co- precipitation samples aged at 25°C (data not shown).
The linear combination (LC) fitting approach was used to esti- mate the proportion of FeO and possibly newly formed Fe(II)- bearing cement phases in the co-precipitation samples (Table 1, Fig. S6in SI). The precipitation of Fe(OH)2(s) during the course of the experiments could be excluded as this phase was also used as a reference in the LC fitting approach. Fe(III)-loaded references and Fe(OH)3(s) were also considered in the fitting in order to account for the possibility of Fe(II) oxidation in the course of the synthesis of the Fe(II)-containing samples. The XANES of Fe(III)- loadedAC-S-H phases are reported elsewhere[17]. Nevertheless, presence of Fe(III) species was not observed in the samples. FeO was found to be the main component in all co-precipitation sam- ples. The results show that small portions of Fe(II) could be accom- modated byAC-S-H phases, while Fe(II) uptake by AFm phases is less likely as indicated by the lower proportion of Fe(II)-AFmCO3
and Fe(II)-AFmSO4species contributing to the XANES spectra of the co-precipitation samples as well as the higher R-factor. The results suggest that in particular the formation of Fe(II)-bearing AC-S-H phases could occur to some extent in the co- precipitation experiments with theAC-S-H phases. The indicative co-precipitation experiments prompted us to further explore the possibility of Fe(II) uptake byAC-S-H phases rather than by AFm phases.
3.3. Fe(II) interaction withAC-S-H phases 3.3.1. Sorption isotherms
Fe(II) sorption isotherm were determined on theAC-S-H phases with target Ca/Si ratios = 0.8 and 1.5 after 8 days equilibration. The sorption isotherms were found to be linear (slope = 1) over the entire aqueous Fe(II) concentration range between 107and 103 M for both Ca/Si ratios (Fig. 5). Note that precipitation of Fe (OH)2(s) was not observed in the given Fe(II) concentration range, Fig. 3. a) Effect of pH on the oxidation of aqueous Fe(II) in ultrapure, degassed water. The time-dependent Fe(II) concentration (c(t)) was determined using the ferrozine method and related to the initial Fe(II) concentration (c0). b) Oxidation of aqueous Fe(II) in sea water[50]and fresh water[51]. The natural waters were saturated with respect to O2giving rise to faster Fe(II) oxidation as compared to the present study in ultrapure, degassed water.
while thermodynamic calculations suggested that the solubility limit with respect to Fe(OH)2(s) is exceeded (Fig. 2a). A tentative explanation for this observation can be proposed with a view to possible kinetic and/or thermodynamic limitations. Kinetics: Pre- cipitation of Fe(OH)2(s) in these systems may be retarded and equi-
librium may not be achieved within the 8 days of equilibration.
Thermodynamics: An amorphous solid phase Fe(OH)2(am) may form in these systems, which has a significantly higher solubility limit as defined by the currently available thermodynamic data.
The results further show that theAC-S-H composition had no measurable effect on Fe(II) sorption as the data expressed in terms of mol/kg forAC-S-H 0.8 and 1.5 agree well within the experimen- tal uncertainty range. A slightly higher Fe(II) uptake results for the AC-S-H phase with the higher Ca/Si ratio if the Fe(II) loading is expressed in terms of mol Fe(II)/mol Si (y-axis on the right hand side). The Kdvalues derived from the isotherm measurements were determined to be 0.08 ± 0.06 m3/kg for Ca/Si = 0.8 and 0.09 ± 0.0 6 m3/kg for Ca/Si = 1.5, which is significantly lower than the Kdval- ues determined for Fe(III) (Fig. 5)[17].
3.3.2. Coordination environment of Fe(II) sorbed ontoAC-S-H phases The coordination environment of Fe(II) in Fe(II)-loadedAC-S-H phases (target Ca/Si ratio = 0.8 and 1.5) was determined after equi- libration for 2 and 8 days (Fig. 6). Preliminary tests showed that Fe (II) was stable under the beam in the cryostat set-up used for the measurements (see Fig. S2 in SI). The Fe K-edge EXAFS spectra were found to be identical after the two periods of equilibration.
This indicates that the dominant coordination environment was established within two days of reaction. This finding further shows that Fe(II) sorption onAC-S-H phases is a fast process. The slightly different features of the backscattering contributions in the EXAFS spectra between Ca/Si = 0.8 and Ca/Si = 1.5, such as the double peak Fig. 4. XRD data of a)AC-S-H 0.8 and 1.5 and b) AFmSO4and AFmCO3samples. The XRD data of pure phases (black) are compared with those of the co-precipitation samples (grey). The broken lines highlight the peak shift at low 2h. Note that the strong peak at 2h= 42°indicates the presence of FeO (also highlighted as broken line in b). c) Experimental (solid line) and fitted XANES spectra (dashed line) of the same co-precipitation samples and FeO.
Table 1
Percentage of the contribution of the XANES spectra of FeO and Fe(II)-loaded cement phases (AC-S-H 0.8,AC-S-H 1.5, AFmCO3, and AFmSO4) to the XANES spectra the Fe(II)- containing co-precipitation samples as determined by LC fitting.
Co-prec. sample Percentage of Fe species from XANESa
FeO Fe(II)-AC-S-H 0.8 Fe(II)-AC-S-H 1.5 Fe(II)-AFmCO3 Fe(II)-AFmSO4 R-factorb
AC-S-H 0.8 84(1) 16 (2) – – – 0.002
AC-S-H 1.5 79(1) – 21(2) – – 0.002
AFmCO3 90(2) – – 10(1) – 0.009
AFmSO4 87(2) – – – 13(2) 0.006
aThe Fe(II) reference spectra employed in the fitting are displayed inFig. S6in SI. The fitting was constrained to sum up to 100%.
bThe residual factor(R) is an indicator for the goodness of the fit (R =P
(Iobs-Icalc)2/N, where Iobsand Icalcare the observed and calculated normalized intensities, respectively, and the summation is over N data points.
Fig. 5.Sorption isotherms for Fe(II) onAC-S-H phases (Ca/Si = 0.8 and 1.5) in comparison to those for Fe(III) on the same phases[17]. The left y-axis relates to the sorbed Fe(II) concentration. The molar Fe(II)/Si ratio ofAC-S-H phases is shown on the right y-axis. (Note that erroneous Fe/Si ratios were assigned to the Fe(III) sorption isotherms published in the previous study with Fe(III)[17]).
in the k range ~4 Å1and the k range ~7 Å1(shaded areas in Fig. 6a) suggest that the Ca/Si ratio ofAC-S-H phases could have an effect on the coordination environment of Fe(II).
In the first step of data analysis, the Fe K-edge EXAFS spectra of the Fe(II)-loadedAC-S-H samples were compared with that of Fe (OH)2(s) (Fig. 6). The EXAFS spectra showed distinctly different spec- tral features in the k range above~6.5 Å1, while similarities in the EXAFS spectra were noted in the k range below~6.5 Å1. In addition, it was noticed that the XANES of the Fe(II)-loadedAC-S-H phases were clearly different from the XANES of Fe(OH)2 (Fig. S4in SI).
Structural parameters were determined for Fe(OH)2 which agree with literature data (Table 2). Attempts were made to fit the EXAFS spectra of the Fe(II)-loaded C-S-H phases by using the parameters derived for Fe(OH)2. The resulting structural parameters were unre-
alistic, indicating that the coordination environment of Fe(II) inAC- S-H phases is different from that of Fe(II) in Fe(OH)2.
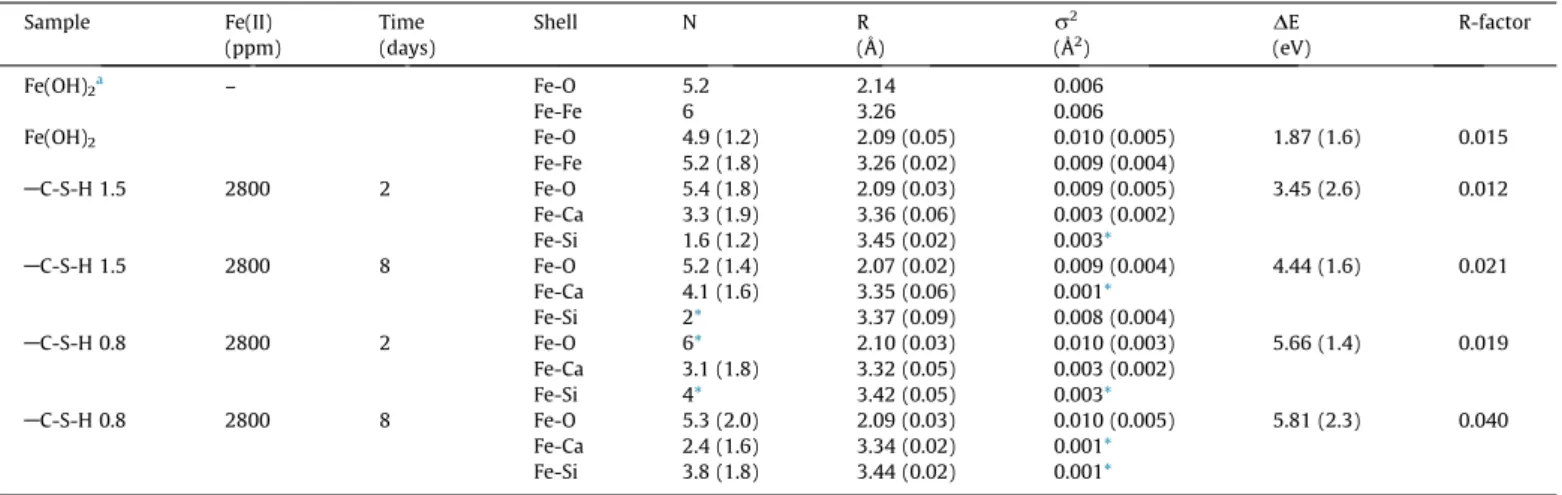
Fitting of the EXAFS spectra of the Fe(II)-loadedAC-S-H samples was successful by using the structure of the Fe-Si-Ca rich mineral babingtonite as structural model (Ca2(Fe2+,Mn)Fe3+Si5O14(OH) [60]). The latter model was previously used to fit Fe(III)-AC-S-H EXAFS spectra[17]. All Fourier transforms showed a pronounced peak at R +DR~1.5 Å accounting for the backscattering contribu- tion of the oxygen shell (Fig. 6b). All samples showed the same structural parameters within the experimental uncertainties (Table 2). The number of neighbouring oxygen atoms varied between 5.2 ± 1.4 and 6 (fixed) suggesting an octahedral rather than a tetrahedral coordination environment. The derived Fe-O distances (RFe-O) ranged between 2.07 Å and 2.10 Å, while the
Table 2
Structural parameters determined for the Fe(II)-loadedAC-S-H phases and Fe(OH)2. Calculated uncertainties are given in parentheses. N = number of neighbouring atoms, R = interatomic distance,r2= Debye – Waller factor,DE = energy shift, R-factor = residual factor.
Sample Fe(II) Time Shell N R r2 DE R-factor
(ppm) (days) (Å) (Å2) (eV)
Fe(OH)2a – Fe-O 5.2 2.14 0.006
Fe-Fe 6 3.26 0.006
Fe(OH)2 Fe-O 4.9 (1.2) 2.09 (0.05) 0.010 (0.005) 1.87 (1.6) 0.015
Fe-Fe 5.2 (1.8) 3.26 (0.02) 0.009 (0.004)
AC-S-H 1.5 2800 2 Fe-O 5.4 (1.8) 2.09 (0.03) 0.009 (0.005) 3.45 (2.6) 0.012
Fe-Ca 3.3 (1.9) 3.36 (0.06) 0.003 (0.002)
Fe-Si 1.6 (1.2) 3.45 (0.02) 0.003*
AC-S-H 1.5 2800 8 Fe-O 5.2 (1.4) 2.07 (0.02) 0.009 (0.004) 4.44 (1.6) 0.021
Fe-Ca 4.1 (1.6) 3.35 (0.06) 0.001*
Fe-Si 2* 3.37 (0.09) 0.008 (0.004)
AC-S-H 0.8 2800 2 Fe-O 6* 2.10 (0.03) 0.010 (0.003) 5.66 (1.4) 0.019
Fe-Ca 3.1 (1.8) 3.32 (0.05) 0.003 (0.002)
Fe-Si 4* 3.42 (0.05) 0.003*
AC-S-H 0.8 2800 8 Fe-O 5.3 (2.0) 2.09 (0.03) 0.010 (0.005) 5.81 (2.3) 0.040
Fe-Ca 2.4 (1.6) 3.34 (0.02) 0.001*
Fe-Si 3.8 (1.8) 3.44 (0.02) 0.001*
aZhu and Elzinga[61].
*Fixed parameters.
a) b) c)
Fig. 6.Fe K-edge EXAFS spectra of Fe(II)-loadedAC-S-H phases. a)k3-weighted spectra, b) experimental (solid line) and calculated (dashed lines) Fourier transforms (modulus and imaginary part), c)k3-weighted EXAFS function of the Fourier-back transform spectra obtained fromFig. 6b (solid line: experimental, dashed line: calculated).
The shaded area indicates a main spectral difference between Fe(OH)2and the two Fe(II)-loadedAC-S-H phases.
Debye-Waller factor (
r
2) varied between 0.009 ± 0.005 Å2and 0.010 ± 0.005 Å2.
Presence of further backscattering atoms was indicated by the broad peak at R +DR~2.7 Å. This peak could accurately be fitted by considering Fe-Ca and Fe-Si backscattering contributions. The fitting was not successful if one of the latter contributions was omitted or if a different backscattering path was considered, such as Fe-Fe. The Fe-Ca and Fe-Si interatomic distances were found to agree within the uncertainties for the twoAC-S-H phases (Ca:
3.32 Å (±0.05 Å) to 3.34 Å (±0.02 Å) in AC-S-H 0.8 and 3.35 Å (±0.06 Å) to 3.36 Å (±0.06 Å) inAC-S-H 1.5; Si: 3.42 Å (±0.05 Å) to 3.44 Å (±0.02 Å) inAC-S-H 0.8 and 3.37 Å (±0.09 Å) to 3.45 Å (±0.02 Å) inAC-S-H 1.5). Nevertheless, differences in the coordina- tion environments of Fe(II) on the twoAC-S-H phases are reflected by differences in the number of neighbouring Ca and Si atoms (Ca:
3.1 (±1.8) and 2.4 (±1.6) onAC-S-H 0.8 and 3.3 (±1.9) and 4.1 (±1.6) onAC-S-H 1.5; Si: 4 and 3.8 (±1.8) onAC-S-H 0.8 and 1.6 (±1.2) and 2 onAC-S-H 1.5). The number of neighbouring Ca atoms tends to be higher inAC-S-H 1.5 as compared toAC-S-H 0.8, while the opposite is true for the number of neighbouring Si atoms.
4. Discussion
4.1. Development of a methodology for Fe(II) studies in cementitious environments
The present study shows that a thorough control of the experi- mental conditions is required to investigate the fate of Fe(II) in cementitious environments. Important constraints are the limited solubility of Fe(OH)2(s), the very narrow range of the redox stabil- ity of Fe(II) (Fig. 2) and fast oxidation of Fe(II) in strongly alkaline conditions (Fig. 3). The experimental methodology reported in this study has been developed in a stepwise manner with the aim of addressing the above constraints.
Oxidation of Fe(II) to Fe(III) is a fast process in the neutral to alkaline pH range (Fig. 3). We were able to monitor Fe(II) oxidation in ultrapure, degassed (‘‘O2-free”) water up to pH 9, which is at the lower limit of the pH range relevant to cementitious systems. The term ‘‘O2-free” refers to the procedure applied to deplete O2from water, i.e. by boiling ultrapure water under a N2purge for 2 h. After this treatment, residual O2below 1 ppb (detection limit of a com- mercial O2 sensor) was observed, while it is expected that the water may still contain traces of O2. It is anticipated that Fe(II) oxi- dation to Fe(III) will be even faster in the pH range above 9 in the given ‘‘O2-free” conditions. In strongly alkaline conditions, the con- centration range of aqueous Fe(II) is constrained by the presence of traces of dissolved O2and the precipitation of Fe(OH)2. Hence, fur- ther verification of the Fe(II) oxidation kinetics in alkaline media will be very challenging for two reasons: i) O2has to be quantified at ultra-low concentrations, and ii) a very sensitive analytical tech- nique for Fe(II) quantification is required to conduct the experi- ments in the Fe(II) concentration range below the solubility limit of Fe(OH)2(s).
The results from the wet chemistry studies on the redox stabil- ity of Fe(II) further prompted us to develop a robust methodology for Fe(II) studies in alkaline conditions (seeFig. S1in SI). Stabilisa- tion of Fe(II) in cementitious environments was found to be chal- lenging. Our attempts to maintain the + II oxidation state by the addition of reducing agents were not successful in acidic and weakly alkaline conditions. Furthermore, we noticed that Fe(II) sorption studies in strongly alkaline conditions could not be car- ried out as standard batch-type experiments at low Fe(II) concen- trations, even though the experiments were performed in a N2
controlled atmosphere (O2, CO2< 0.1 ppm) and by using ultrapure, degassed water (seeFig. S1 in SI). As the standard approach for
sorption studies in cementitious environments was not applicable to Fe(II), an approach based on the use of electrochemical cells for redox control was developed (seeFig. S1in SI). The use of an elec- trochemical cell enabled us to control the redox potential and sta- bilise Fe(II) in strongly alkaline solutions over a time period up to about two weeks. Nevertheless, the approach does not allow long- term stabilisation of Fe(II) as O2is slowly but continuously pro- duced by the anodic electrochemical reaction.
Specific measures were also taken to prevent Fe(II)-doped sam- ples from being oxidised due to exposition to air or even traces of O2. To this end, Fe(II)-doped samples were kept in cryogenic envi- ronments whenever possible. For example, the Fe(II)-loaded CASAH samples were frozen in liquid N2, stored at cryogenic tem- perature in a Dewar vessel containing liquid N2and further, the XAFS measurements were carried out on samples mounted in LN2cryostats. These measures prevented samples from being oxi- dised due to air exposure and from being altered by beam-induced damages (Fig. S2in SI).
4.2. Fe(II) sorption process
The uptake mechanism of Fe(II) by AC-S-H phases (Ca/Si ratios = 0.8 and 1.5) can be assessed based on the main findings from the co-precipitation, wet chemistry, and spectroscopic exper- iments, which are summarised as follows.
The co-precipitation experiments show that:
An increase of the basal spacing by XRD, i.e. a shift of the first peak at 2h~9°-10°to lower values for bothAC-S-H phases, indi- cating Fe(II) uptake into the interlayer;
Limited Fe(II)-Ca(II) replacement, i.e. 2% Ca (on a mol basis) have been replaced by Fe(II) as determined with LC fitting of the XANES data, which corresponds to Fe/Si ratios ~0.02 in AC-S-H 0.8 and~0.05 inAC-S-H 1.5.
The sorption studies with Fe(II) on theAC-S-H phases show:
Uptake of Fe(II) is fast and the equilibrium state is achieved within 2 days, according to EXAFS spectroscopy, upon contact- ing theAC-S-H suspensions with Fe(II);
Fe(II) sorption ontoAC-S-H phases is linear in the aqueous Fe(II) concentration range up to 103M indicating that the same type of sorption sites are available for Fe(II) binding at low and high Fe-concentrations;
Fe(OH)2(s) does not precipitate in the Fe(II) concentration range covered by the sorption isotherm, hence limiting the solubility of Fe(II), while precipitation cannot be excluded above aqueous Fe(II) concentrations of 103M;
The composition of theAC-S-H phase (Ca/Si ratio) and thus pH has no measurable effect on the uptake of Fe(II), although a reduction in Fe(II) sorption at higher pH could be expected due to hydrolysis as previously observed in the case of Fe(III) [17];
The uptake of Fe(II) byAC-S-H phases is much weaker than that of Fe(III) on the same type of cement phases, resulting in a dif- ference in the sorption value (Kd) of the two oxidation states of Fe by>3 orders of magnitude.
The spectroscopic investigations on the Fe(II)-loaded AC-S-H samples show:
Absence of Fe(OH)2(s) in the Fe(II) concentration range of the sorption isotherm, thus supporting conclusions drawn from the wet chemistry experiments;
Fe(II) is coordinated in octahedral geometry;
Fe(II) sorbed ontoAC-S-H phases has a large number of neigh- bouring Ca (~2 and~4 inAC-S-H 0.8 and 1.5, respectively) and Si atoms (~4 and~2 inAC-S-H 0.8 and 1.5, respectively).
The results from the co-precipitation experiments reveal that partial replacement of Ca(II) by Fe(II) may occur inAC-S-H phases, while complete stoichiometric substitution is not supported by the data. The large difference in the ionic radii of Ca(II) (r = 1.08 to 1.20 Å in VI-VIII coordination) and Fe(II) (r = 0.69 and 0.86 Å in VI low and high spin coordination, respectively) does not allow quantitative replacement of the two bivalent metal cations. How- ever, partial Ca(II)-Fe(II) substitution occurs either on surface sites and/or in the interlayer of the C-S-H phases. The XRD data of the C- S-H co-precipitation samples indicate Fe(II) uptake into the inter- layer as evidenced from an increase in the basal spacing for both C-S-H phases. Mass balance considerations resulted in Fe/Si ratios
~0.02 in case of the C-S-H phase with Ca/Si = 0.8, and~0.05 in case of the C-S-H phase with Ca/Si = 1.5. L’Hopital et al.[62]showed that an Al/Si ratio = 0.05 of Al-bearing C-A-S-H gives rise to a sig- nificant increase in the basal spacing compared to Al-free C-S-H phase. A clear difference in the basal spacing in C-A-S-H phases as compared to C-S-H phases was further reported by Renaudin et al.[63]. Thus, the evidence is that an increase in the basal spac- ing, even at low Fe/Si ratio, is attributable to Fe(II) uptake into the interlayer of C-S-H phases as previously reported for Al(III).
Modelling of the EXAFS spectra was performed on the assump- tion that Fe(II) bonding in the interlayer might be the dominant uptake process. Attempts were made to identify the position of Fe(II) in the interlayer of the C-S-H phases using the tobermorite structure[64]. The same approach was previously applied in the case of Fe(III)[17]. For example, Fe-Ca replacement in the inter- layer was tested and a Fe atom was inserted close to the bridging site of the interlayer. Furthermore, two other possible Fe positions in the interlayer were considered, i.e. close to the pair sites and Ca substitution at the bridging site [17]. Eventually, a Fe atom was placed at the edge site ofAC-S-H phases. Nevertheless, all struc- tural parameters derived based on the tobermorite structural model were unrealistic. We therefore concluded that the formation of solely Fe(II) interlayer species is not supported by the EXAFS data.
Additional evidence against Fe(II) bonding in the interlayer as the dominant uptake process results from the experiment where a Fe(II)-loaded C-S-H sample was exposed to air (Fig. S3in SI).
The results show that oxidised Fe(II) does not occupy the same structural positions in C-S-H 1.5 as compared to sorbed Fe(III) onto the same C-S-H phase (seeFig. S4in SI). This finding supports the idea that, contrary to Fe(III), Fe(II) is not taken up predominately by the interlayer of the C-S-H phase but, in addition, occupies near- surface sites that can be accessed by O2.
The evidence from the EXAFS studies on the Fe(II)-loaded C-S-H sorption samples further is that Fe(II) does not form solely mono- or bidentate Fe(II) surface complexes typically observed on stable oxide surfaces (e.g. oxides, clays) for which a maximum number of three neighbouring atoms (Ca + Si + O) is anticipated. Rather, the large number of neighbouring atoms (~6 in total (Ca + Si)) observed in this study suggests Fe(II) uptake into the structure of the C-S-H phases either on the outer surface or to some extent in the interlayer in a manner similar to Fe(III) bonding on C-S-H 0.8 [17]. Note, however, that a total number of > 10 neighbouring atoms would be expected if interlayer-bound Fe(II) were a domi- nant species as previously observed in the case of Fe(III)[17]and Np(IV) [32]. Thus, in the case of interlayer bonding, the number of neighbours is expected to be significantly higher than the six neighbouring atoms (Ca + Si) determined in this study. It should be noted that, in general, the structural parameters deduced from EXAFS spectroscopy are an average of the individual parameters of
all major Fe species that have been uptaken by the C-S-H phases and significantly contribute (typically > 5%) to the EXAFS spectrum [65].
In summary, we infer that Fe(II) bonding in the interlayer cannot be the dominant mechanism of Fe(II) interaction with the C-S-H phases in case of the short-term sorption samples studied by EXAFS spectroscopy (i.e. up to 8 days equilibration), while the XRD data of the co-precipitation samples suggest uptake of a por- tion of Fe(II) by the interlayer. The presence of equal proportions of surface-bound and interlayer-bound Fe(II) species cannot be excluded on the basis of the EXAFS data. An alternative structure model allowing for a total of~6 (Ca + Si) neighbours is based on Fe(II) incorporation into the near-surface structure supposed that the EXAFS spectra can be assigned to a single Fe(II) species. Pres- ence of a single Fe(II) species is supported by linear sorption (Fig. 5) indicating that all sites have the same affinity for Fe(II).
Nevertheless, this alternative structural model is not in line with the XRD data. In summary, the most plausible interpretation of the above findings is as follows: i) Fe(II) is bonded both on the sur- face (formation of surface complexes) and in the interlayer at about equal quantities, ii) both sites, i.e. surface and interlayer sites, have similar affinities for Fe(II).
4.3. Comparison of Fe(II) sorption with the sorption of other bivalent metal cations
C-S-H phases mainly determine the sorption potential of cement paste for bivalent metal cations. Therefore, the possibility of sorption competition between metal cations and the influence of Fe(II) on the retention of bivalent radionuclides has to be evalu- ated in connection with safety assessment of future repositories for radioactive waste.
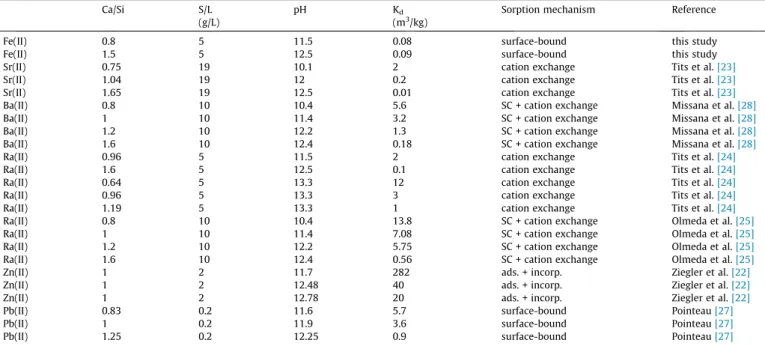
The sorption behaviour of bivalent metal cations by C-S-H phases has been extensively studied in the last two decades and quantified in terms of Kdvalues, while only limited spectroscopic evidence for the sorption mechanisms of the different metal cations is presently available. Hence, an assessment of Fe(II) inter- action with C-S-H phases in comparison to other bivalent metal cations has to be based presently solely on Kdvalues. To this end, the Kdvalues and sorption isotherms for bivalent metal, i.e. Zn(II) [20–22], Sr(II) [23], Ra(II) [24,25], Pb(II) [26,27] and Ba(II) [28], are compiled along with those of Fe(II) (Fig. 7,Table 3).
The Fe(II) sorption isotherms seem to suggest that Fe(II) sorp- tion does not depend on pH or the Ca/Si ratio of C-S-H phases, respectively, in the pH range between 11.5 and 12.5 as the sorption data agree within the experimental uncertainty. Nevertheless, a decrease in the Fe(II) sorption on the C-S-H phases is anticipated with increasing pH, similar to Fe(III) sorption on TiO2[17], as the concentration of the aqueous Fe(OH)3species linearly increases with increasing pH above pH 11 (Fig. S5in SI)[66]. The experimen- tal findings thus suggest that pH dependence of Fe(II) sorption on C-S-H phases cannot be resolved within the uncertainty of the data or that other species present in solution, such as Ca, have an effect on the extent of Fe(II) sorption on C-S-H phases. At present, the reason for pH-independent Fe(II) sorption on C-S-H phases cannot be explained.
Sr, Ba and Ra are the metal cations with Kdvalues most similar to Fe(II) at high Ca/Si ratios of the C-S-H phase. Sr, Ba and Ra spe- ciation is dominated by Sr2+, Ba2+and Ra2+ions even at high pH values, while the Fe(II) speciation is dominated by Fe(OH)3. The Kdvalues of Sr, Ba and Ra increase with decreasing Ca/Si ratio of the C-S-H phases contrary to Fe(II) where no apparent effect of the Ca/Si ratio on Fe(II) uptake has been observed. It should be noted that the aqueous Ca concentration in equilibrium with the C-S-H suspensions increases with increasing Ca/Si ratio [67].
Hence, an increase in the Kdvalue with decreasing Ca/Si ratios of
the C-S-H phases as observed in case of the alkaline earth metals indicates a cation exchange process involving the latter metal cations and Ca. The uptake of Sr2+, Ba2+and Ra2+by C-S-H phases has been modelled in terms of a cation exchange process with Ca2+[23–25,28]and, in addition, in the case of Ra2+and Ba2+, also by surface complexation (SC) on silanol-like sites[25,28].
The hydrolysis behaviour of Pb is similar to Fe(II) above pH 11 with Pb(OH)3as the dominant hydrolysis product. As for the alka- line earth metals, Pb uptake by C-S-H phases increases with decreasing Ca/Si ratio. The sorption process was modelled in terms of surface complexation on silanol-like surface sites[26,27]. Simi- larly, the extent of Zn(II) uptake was found to depend on the Ca/Si ratio of C-S-H phases, suggesting an increase of the uptake with decreasing Ca/Si ratio[20–22]. Nevertheless, the Kdvalues for Zn uptake by C-S-H phases are significantly higher than those of the
alkaline earth metals and Pb, thus indicating a different sorption mechanism. Ziegler et al.[22]proposed that Zn(II) uptake occurs in two steps, i.e. adsorption onto the surface of C-S-H phases and subsequent diffusion into the C-S-H structure whereby the Zn(O, OH)4 tetrahedra substitute for the silicate bridging tetrahedra and/or at terminal silicate chain sites rather than occupying inter- layer positions[21]. Thus, the currently available sorption data suggest that the sorption mechanism of Fe(II) is likely to be compa- rable to that of the alkaline earth metals and Pb, while a different sorption mechanisms accounts for the significantly stronger bond- ing of Zn by C-S-H phases. Similar sorption mechanisms further implies the potential for sorption competition between Fe(II) and other bivalent metal cations.
5. Conclusions
The behaviour of aqueous Fe(II) in alkaline cementitious envi- ronments is strongly influenced by the fast kinetics of Fe(II) oxida- tion to Fe(III) and the limited solubility of Fe(II). These chemical properties of Fe(II) require specific measures to be taken when studying the sorption behaviour of Fe(II) in cementitious systems, such as avoiding exposure to O2(e.g. use of ‘‘O2-free” water for the experiments and conducting experiments in N2atmosphere). We used electrochemical cells for the control of the redox stability of Fe(II) and avoided post-experimental Fe(II) oxidation to Fe(III) by keeping and analysing samples in cryogenic conditions.
Similar to Fe(III), Fe(II) uptake by C-S-H phases seems to be independent of the Ca/Si ratio of the C-S-H phases, and thus pH.
Fe(II) sorption is linear indicating that no Fe(II)-hydroxide precip- itation occurs in the studied Fe(II) concentration range from 107 to 103M. The Kdvalue is~0.1 m3/kg irrespective of the Ca/Si ratio of the C-S-H phases and pH, suggesting that hydrolysis and Ca could have an opposite effect on the extent of Fe(II) uptake by C- S-H phases. The Kd value of ~0.1 m3/kg value is comparable to those of other bivalent metal cations, in particular the alkaline earth metals, at high Ca/Si ratio, while for alkaline earth metals the Kdvalue is much lower at low Ca/Si ratio.
Table 3
Summary of the available literature data for the sorption of selected bivalent metal cations onAC-S-H phases (Ca/Si ratio, S/L ratio, pH, Kd, and reference). For details on sorption mechanisms see text (SC = surface complexation, ads. = adsorption, incorp. = incorporation).
Ca/Si S/L pH Kd Sorption mechanism Reference
(g/L) (m3/kg)
Fe(II) 0.8 5 11.5 0.08 surface-bound this study
Fe(II) 1.5 5 12.5 0.09 surface-bound this study
Sr(II) 0.75 19 10.1 2 cation exchange Tits et al.[23]
Sr(II) 1.04 19 12 0.2 cation exchange Tits et al.[23]
Sr(II) 1.65 19 12.5 0.01 cation exchange Tits et al.[23]
Ba(II) 0.8 10 10.4 5.6 SC + cation exchange Missana et al.[28]
Ba(II) 1 10 11.4 3.2 SC + cation exchange Missana et al.[28]
Ba(II) 1.2 10 12.2 1.3 SC + cation exchange Missana et al.[28]
Ba(II) 1.6 10 12.4 0.18 SC + cation exchange Missana et al.[28]
Ra(II) 0.96 5 11.5 2 cation exchange Tits et al.[24]
Ra(II) 1.6 5 12.5 0.1 cation exchange Tits et al.[24]
Ra(II) 0.64 5 13.3 12 cation exchange Tits et al.[24]
Ra(II) 0.96 5 13.3 3 cation exchange Tits et al.[24]
Ra(II) 1.19 5 13.3 1 cation exchange Tits et al.[24]
Ra(II) 0.8 10 10.4 13.8 SC + cation exchange Olmeda et al.[25]
Ra(II) 1 10 11.4 7.08 SC + cation exchange Olmeda et al.[25]
Ra(II) 1.2 10 12.2 5.75 SC + cation exchange Olmeda et al.[25]
Ra(II) 1.6 10 12.4 0.56 SC + cation exchange Olmeda et al.[25]
Zn(II) 1 2 11.7 282 ads. + incorp. Ziegler et al.[22]
Zn(II) 1 2 12.48 40 ads. + incorp. Ziegler et al.[22]
Zn(II) 1 2 12.78 20 ads. + incorp. Ziegler et al.[22]
Pb(II) 0.83 0.2 11.6 5.7 surface-bound Pointeau[27]
Pb(II) 1 0.2 11.9 3.6 surface-bound Pointeau[27]
Pb(II) 1.25 0.2 12.25 0.9 surface-bound Pointeau[27]
Fig. 7.Comparison of the sorption isotherms of selected bivalent metal cations on AC-S-H phases. The solid line indicates the sorption isotherm for Fe(II) onAC-S-H phases. The two dashed lines highlight the isotherms with the highest and the lowest Kdvalues of the bivalent metal cations (except Zn) selected for comparison.
![Fig. 1. Electrochemical cell modified after Soltermann et al. [35] and used for the sorption studies with Fe(II)](https://thumb-eu.123doks.com/thumbv2/1library_info/5472008.1684161/4.892.151.742.681.1082/fig-electrochemical-cell-modified-soltermann-used-sorption-studies.webp)
![Fig. 5. Sorption isotherms for Fe(II) on AC-S-H phases (Ca/Si = 0.8 and 1.5) in comparison to those for Fe(III) on the same phases [17]](https://thumb-eu.123doks.com/thumbv2/1library_info/5472008.1684161/8.892.61.835.533.627/fig-sorption-isotherms-fe-phases-comparison-iii-phases.webp)