Environmental Science & Technology is published by the American Chemical Society.
system for on-site environmental gas analysis
Matthias S. Brennwald, Mark Schmidt, Julian Oser, and Rolf Kipfer
Environ. Sci. Technol., Just Accepted Manuscript • DOI: 10.1021/acs.est.6b03669 • Publication Date (Web): 19 Nov 2016 Downloaded from http://pubs.acs.org on November 29, 2016
Just Accepted
“Just Accepted” manuscripts have been peer-reviewed and accepted for publication. They are posted online prior to technical editing, formatting for publication and author proofing. The American Chemical Society provides “Just Accepted” as a free service to the research community to expedite the dissemination of scientific material as soon as possible after acceptance. “Just Accepted” manuscripts appear in full in PDF format accompanied by an HTML abstract. “Just Accepted” manuscripts have been fully peer reviewed, but should not be considered the official version of record. They are accessible to all readers and citable by the Digital Object Identifier (DOI®). “Just Accepted” is an optional service offered to authors. Therefore, the “Just Accepted” Web site may not include all articles that will be published in the journal. After a manuscript is technically edited and formatted, it will be removed from the “Just Accepted” Web site and published as an ASAP article. Note that technical editing may introduce minor changes to the manuscript text and/or graphics which could affect content, and all legal disclaimers and ethical guidelines that apply to the journal pertain. ACS cannot be held responsible for errors or consequences arising from the use of information contained in these “Just Accepted” manuscripts.
A portable and autonomous mass spectrometric system for on-site environmental gas analysis
Matthias S. Brennwald,
∗,1Mark Schmidt,
2Julian Oser,
1and Rolf Kipfer
1,31Eawag, Swiss Federal Institute of Aquatic Science and Technology, Dep. Water Resources and Drinking Water, D¨ubendorf, Switzerland
2GEOMAR Helmholtz Centre for Ocean Research Kiel, Wischhofstr. 1–3, 24148 Kiel, Germany 3Institute for Geochemistry and Petrology, ETH Zurich, Switzerland
E-mail: matthias.brennwald@eawag.ch
Revison of ES&T manuscript ES-2016-03669r November 7, 2016
Corresponding author phone: +41 58 765 53 05
TOC Art
Abstract
1
We developed a portable mass spectrometric system (“miniRuedi”) for quantificaton of
2
the partial pressures of He, Ne (in dry gas), Ar, Kr, N2, O2, CO2 and CH4 in gaseous and
3
aqueous matrices in environmental systems with an analytical uncertainty of 1–3 %. The
4
miniRuedi does not require any purification or other preparation of the sampled gases and
5
therefore allows maintenance-free and autonomous operation. The apparatus is most suit-
6
able for on-site gas analysis during field work and at remote locations due to its small size
7
(60 cm×40 cm×14 cm), low weight (13 kg), and low power consumption (50 W). The gases
8
are continuously sampled and transferred through a capillary pressure reduction system into
9
a vacuum chamber, where they are analysed using a quadrupole mass spectrometer with a
10
time resolution of!1 min. The low gas consumption rate (< 0.1 ml/min) minimises interfer-
11
ence with the natural mass balance of gases in environmental systems, and allows the unbi-
12
ased quantification of dissolved-gas concentrations in water by gas/water equilibration using
13
membrane contractors (gas-equilibrium membrane-inlet mass spectrometry, GE-MIMS). The
14
performance of the miniRuedi is demonstrated in laboratory and field tests, and its utility is
15
illustrated in field applications related to soil-gas formation, lake/atmosphere gas exchange,
16
and seafloor gas emanations.
17
Introduction
18
The abundances of gas species in environmental systems are controlled by numerous physical,
19
chemical and biological processes and conditions. Gases are therefore highly useful proxies to
20
study the dynamics of environmental processes and can be of great utility to study the interplay
21
of these processes. In particular, chemically inert gases (noble gases; He, Ne, Ar, Kr, Xe) were
22
successfully used to study and quantify physical transport and mixing of fluids as well as the
23
exchange between gas and water1–27or biofluids.28,29Such quantitative information on the physical
24
processes controlling the dynamics of gases in environmental systems is required to quantify and
25
interpret the turnover and the fate of biogeochemically active species (e.g., O2, CO2, CH4, NxOx)
26
in terms of chemical and biological processes5,21,30–35
27
The dynamics of gases and the associated processes in environmental systems are often not
28
accessible from “snapshot data” obtained from single samples reflecting the conditions of a system
29
at a unique point in time. In order to capture the complete evolution of the gas species of interest,
30
data series with sufficiently high temporal and spatial resolution are required. Careful optimisa-
31
tion of the sampling strategy in terms of sampling frequency and locations is therefore of utmost
32
importance, but is often very challenging due to the lack of prior knowledge of the gas dynamics
33
within a given system.
34
The currently applied methods for environmental gas analyses are usually targeted at a single
35
gas species or limited set of gases, and are often based on expensive and highly specialised instru-
36
ments and techniques for sampling and subsequent laboratory based quantification.36–42Acquiring
37
data sets comprising a sufficiently complete suite of both inert and active gas species at the re-
38
quired spatial and temporal resolutions therefore poses numerous practical limitations related to
39
field-work logistics, access to specialised laboratories and data turnaround time that often prevent
40
acquisition of suitable data sets.
41
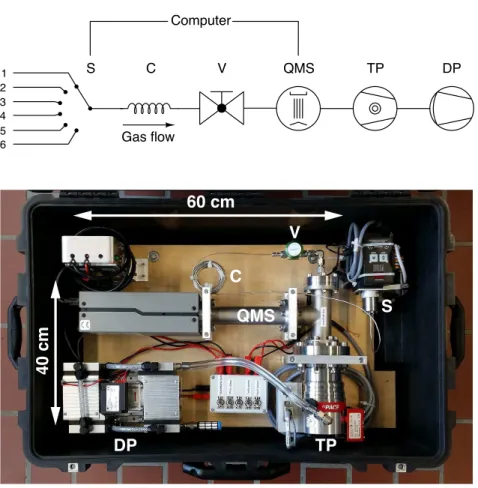
The way forward to overcome these technical and logistical limitations is to simultaneously
42
analyse a sufficiently complete suite of inert and biogeochemically active gas species at the re-
43
quired temporal and spatial resolution directly in the field. On-site and real-time availability of
44
such data avoids the limitations involved with sampling, transport and analysis and would thus
45
considerably improve the quality and utility of the recorded data during fieldwork. For this pur-
46
pose, membrane-inlet mass-spectrometric (MIMS) systems43,44 were developed with the aim to
47
reduce their complexity and size.42,45–48 However, these MIMS are targeted at limited sets of gas
48
species dissolved in water samples only, and are not suitable for unattended long-term operation
49
in the field, because their gas inlet system is designed for manual sample inlet or requires frequent
50
maintenance of gas-purifying devices. In addition, these instruments rely on a gas-permeable mem-
51
brane to separate the water sample at atmospheric pressure from the vacuum in the MS. The rates
52
by which the gas species diffuse from the bulk water across the membrane and into the vacuum
53
of the MS depend on temperature, water flow along the membrane surface, membrane ageing and
54
fouling, etc. It is notoriously difficult to achieve tight control over these operational parameters and
55
cumbersome to handle water standards with well-known dissolved gas concentrations during field-
56
work. Reliable and accurate calibration and application of such MIMS instruments is therefore
57
challenging.
58
The recently developed gas-equilibrium MIMS (GE-MIMS) method49–51 avoids some of the
59
limitations of previous MIMS designs by establishing a solubility equilibrium between the sampled
60
water and a gas phase separated by a gas-permeable membrane. The advantage of the GE-MIMS
61
method is that the gas/water partitioning is hardly affected by the poorly constrained dynamics of
62
the gas-transfer across the membrane, because the partitioning operates at solubility equilibrium.
63
Reliable on-site calibration of such a gas/water equilibration system is therefore straight-forward,
64
and ambient air can be conveniently used as a standard gas for calibration of the partial pressures
65
of the noble gases, N2, and O2.
66
For GE-MIMS analysis, a small fraction of the equilibrated gas phase is continuously trans-
67
ferred through a pressure reducing system into the MS vacuum, where the gases are analysed.
68
Recent GE-MIMS instruments for analysis of O2/Ar ratios50 or Ne/Ar, Ne/Kr, and Ne/Xe ratios51
69
in seawater used very low gas transfer rates (! 0.02 cm3STP/min, STP: standard temperature and
70
pressure, T = 0◦C, P = 1013.25 mbar) to avoid deviation from the gas/water equilibrium in the
71
membrane contactor. In contrast, a modified atmospheric-pressure gas analyser targeted for GE-
72
MIMS analysis of absolute He, Ar, Kr, N2, O2, CO2, and CH4concentrations (“Ruedi”)49operates
73
at a much higher gas removal rate from the membrane contactor (2 cm3STP/min). However, this
74
gas depletion biases the partial pressures relative to the assumed gas/water equilibrium in the mem-
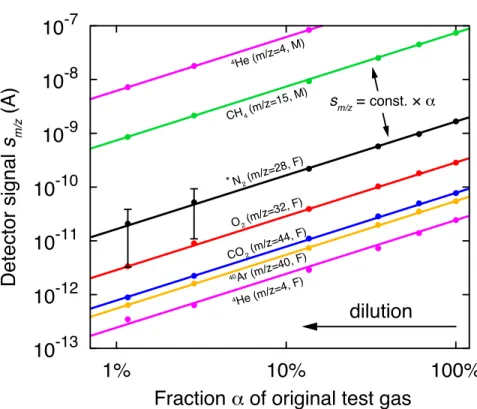
75
brane contactor. While both approaches have illustrated the great potential of continuous analysis
76
of selected gas species,30,32,34,35,52,53the remaining analytical limitations of these instruments (lim-
77
ited sets of gas species, lack of absolute partial pressure analysis) and their bulkiness and high
78
power consumption (several hundred watts) prevented widespread use in diverse environmental
79
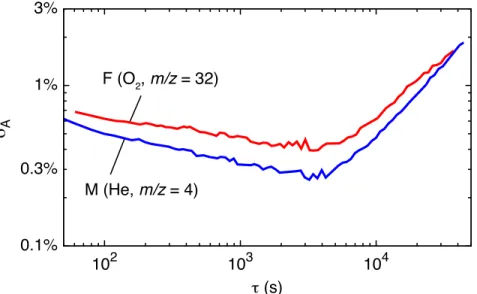
research applications in the field.
80
Here we present a simple, compact, and portable mass spectrometric system with low sample
81
gas consumption (“miniRuedi”). The miniRuedi expands considerably beyond the capabilities of
82
currently available instruments and methods for environmental gas analysis. The system allows
83
quasi-continuous and on-site analysis of the partial pressures of a wide range of environmental
84
gas species at environmental concentrations (He, Ne (in dry gas), Ar, Kr, N2, O2, CO2 and CH4)
85
and is most suitable for absolute analysis of dissolved gas concentrations in aqueous matrices
86
using the GE-MIMS method. The system does not rely on any gas purification or sample prepa-
87
ration units, which makes it robust and maintenance-free and thus enables autonomous long-term
88
operation in the field. The miniRuedi is built using off-the-shelf parts only. The instrument is
89
portable (60 cm× 40 cm × 14 cm, 13 kg) and consumes only 50 W electrical power, which al-
90
lows straight-forward deployment and operation at remote locations using batteries, solar panels
91
or other off-grid electricity sources. Most importantly, the instrument consumes very little sample
92
gas (0.06 cm3STP/min), which is required for unbiased GE-MIMS measurements of absolute partial
93
pressures, and greatly reduces the interference of on-line gas analysis with the natural dynamics
94
and mass balance of the gases in an environmental system.
95
The utility of the miniRuedi for environmental research is demonstrated in three field-application
96
examples related to soil-gas formation, lake/atmosphere gas exchange, and seafloor gas emana-
97
tions.
98
Experimental Section
99
The setup of the miniRuedi system is illustrated in Figure 1. A parts list is given in Table 1.
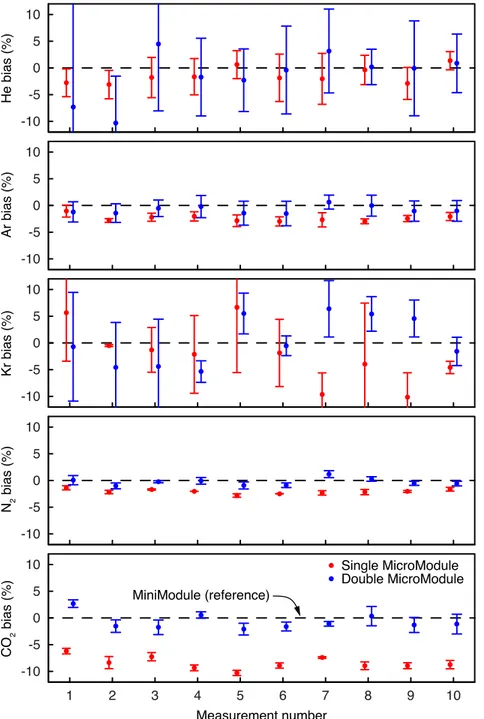
100
The computer controlled valve (S) is used to select the gas inflow from different gas sources at
101
approximately atmospheric pressure. The capillary (C) controls the gas flow from the gas inlet
102
into the vacuum system. The continuous gas flow from the capillary into the quadrupole mass
103
spectrometer (QMS) is balanced by the turbomolecular pump (TP), which produces a high vacuum
104
in the QMS. The gas species in the QMS are ionised in the open, cylindrically symmetrical ion
105
source by electron impact ionisation (in this work, the ionisation energy was always set to 70 eV
106
unless noted otherwise). The resulting ion beam then passes a quadrupole mass filter set to a
107
specific m/z ratio (m: ion mass number, z: ion charge number), and the ion beam strength at
108
thism/zvalue is quantified using either a Faraday cup (F) or a secondary electron multiplier (M)
109
detector.
110
Gas inlet system
111
The sample gas pressure is reduced from approximately atmospheric pressure to the high vacuum
112
in the QMS using a 10 m long capillary with an inner diameter of 0.1 mm. The rugged 1/16”
113
stainless-steel capillary tubing prevents the leakage of He and other mobile gases through the
114
tubing walls. We empirically determined the gas flow though this capillary to 0.06 cm3STP/min.
115
This gas flow results in a total gas pressure of approximately 2×10⁻⁸bar in the MS vacuum
116
chamber, which yields maximum overall sensitivity of the MS while not exceeding the linear
117
operation range of the MS. The observed travel time of the gas from the capillary inlet to the QMS
118
is approximately 80 s. An instantaneous step-like concentration change at the capillary inlet is
119
smeared out over approximately 10 s (50 % rise time) once it reaches the QMS, resulting in an
120
analytical time resolution of!1 min.
121
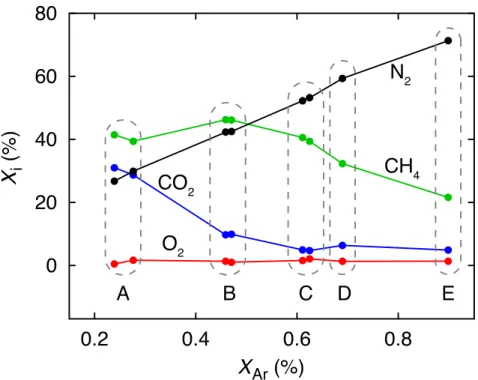
Compared to MS systems with a typical two-stage pressure reduction using a capillary fol-
122
lowed by a pinhole/bypass system, the miniRuedi gas consumption is lower by several orders of
123
magnitudes. The system is therefore most suitable for applications where low gas consumption is
124
beneficial, such as the GE-MIMS technique. With a typical total gas concentration in air-saturated
125
water of approximately 25 cm3STP/L, a water flow rate of" 0.1 L/min through the membrane con-
126
tactor would provide more than 100×the gas amount consumed by the miniRuedi. This illustrates
127
how the miniRuedi allows unbiased GE-MIMS analysis at low water flow rates. Furthermore, pin-
128
hole/bypass stages or similar flow bifurcations may introduce uncontrollable fractionation of gas
129
species in vacuum systems. Such artefacts are avoided in the miniRuedi by the absence of such a
130
secondary pressure reduction stage.
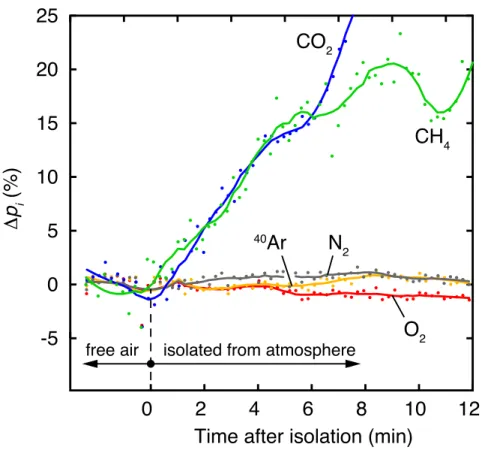
131
Data processing and calibration
132
The peak heights in the m/z spectrum are recorded in a user-defined sequence of the relevant
133
m/zvalues using the F and M detectors, and repeated readings are averaged over a time interval
134
suitable for a given application. The means (sm/z) of the peak heights recorded during each interval
135
at each m/z ratio are used as the raw measurement results of each measurement step. The sm/z
136
values obtained from sample or standard-gas analyses are corrected for the instrument blank by
137
subtracting thesm/zvalues obtained with the inlet valve V closed.
138
The blank-corrected sm/z values are calibrated in terms of the partial pressures of the different
139
gas species in the sampled gas by peak height comparison relative to a reference gas with well
140
known partial pressures of the species of interest. The mixing ratios of the different gas species in
141
the gas are unaffected by the gas passage through the capillary, because the viscous flow regime
142
prevailing throughout most of the capillary prevents fractionation of the gas species. For a given
143
total gas pressure at the capillary inlet, the peak height at a givenm/z value is therefore linearly
144
related to the partial pressure of the respective gas species in the sampled gas. Note, however, that
145
the capillary gas flow approaches the molecular flow regime at the outlet to the QMS vacuum. The
146
rate of the total gas flow through capillary is therefore not a perfectly linear function of the total gas
147
pressure at the capillary inlet.54 We found this nonlinearity to be negligible for the quantification
148
of the partial pressures (bias < 1%) if the pressure difference between the sample gas and the
149
reference gas at the capillary inlet is ! 50 mbar. For larger pressure differences, accurate partial
150
pressures are obtained by normalising their sum to correspond to the true sample gas pressure at
151
the capillary inlet.
152
In many environmental applications, ambient air can be used as a well-defined and convenient
153
gas standard for noble gases, N2 and O2. A dedicated standard-gas mixture is only required for
154
species with unknown or variable atmospheric partial pressures, or if the sampled partial pressures
155
are vastly different from those in air, for example in systems with high abundances of CO2, CH4or
156
(non-atmospheric) He.
157
In order to account for drifts in the instrument sensitivity resulting from changes in the flow
158
resistance of the gas inlet or the sensitivity of the mass spectrometer, the standard gas is analysed
159
periodically in between sample gas analyses. The sm/z values obtained in a given sample-gas
160
analysis step are then calibrated using thesm/zvalues of the standard-gas analysis steps interpolated
161
to the analysis time of the sample gas step. Finally, the standard error of the sample gas analyses
162
is estimated from the standard deviation of replicate analysis results obtained from standard gases.
163
Results and Discussion
164
Laboratory tests
165
To test the linearity of the sm/z values in response to variations in the partial pressures of the
166
gas species at the capillary inlet, we prepared a gas mixture with mixing ratios of approximately
167
7.0% He, 0.24% CH4, 16% O2, 72% N2, 1.8% Ar, and 3.1% CO2. This test gas was kept in a
168
gas sampling bag (Linde, Plastigas) and was incrementally diluted with 99.999% pure N2. The
169
dilution factor was determined by quantifying the CO2and CH4mixing ratios of the dilution using
170
a cavity ring-down spectroscopy analyser (Picarro G2201-i). Figure 2 shows the peak heights
171
obtained from analyses of each test gas dilution step, whereby the total pressure of the gas mixture
172
and its dilutions in the sample bag was always kept at ambient pressure (960 hPa). This dilution
173
test confirms that the F and M peak heights at a givenm/zvalue are linear functions of the partial
174
pressure of the respective gas species at the capillary inlet.
175
To assess the drift of the F and M sensitivity over time, the instrument was set to continuously
176
analyse an air sample during 70 h in a laboratory with stable ambient temperature. Figure 3 shows
177
the Allan deviations55of the resulting F and M signals. The Allan deviations reflect the errors of
178
the means of the F and M signals as a function of the averaging time. Both the F and M Allan
179
deviations exhibit a minimum at an averaging time of approximately 1 h. For shorter averaging
180
times, the uncertainties of the F and M signal means are dominated by random noise, whereas
181
for longer averaging times the uncertainties of the means are dominated by instrument drift. To
182
minimise the effects of drift on the measurement results, peak-height readings should therefore
183
not be averaged for longer than 1 h, and drift calibrations should be run at least hourly. However,
184
changes in ambient temperature will affect the sensitivity of the instrument, mainly because the
185
flow resistance of the capillary decreases with increasing temperature. Averaging time and drift
186
calibration intervals therefore need to be adapted to changes in the ambient conditions. In addition,
187
the choice of the averaging time and the drift calibration intervals will also need to be adapted to
188
the time resolution of the measurement results required to assess the gas dynamics of the system
189
being studied.
190
The Allan deviation corresponds to the resolving power of the measurement and hence indi-
191
cates the analytical precisions and the limits of detection55 that can be achieved with the F and M
192
detectors at any givenm/zvalue. The minima of the relative Allan deviations for He (M,m/z= 4),
193
Ne (M, m/z = 20), N2 (F, m/z = 28), O2 (F, m/z = 32), Ar (M, m/z = 36; F,m/z = 40), and
194
Kr (M,m/z =84) all correspond to 0.3–0.6% of the respective partial pressure in the atmosphere.
195
The typical limits of detection are therefore estimated to approximately 1% of the partial pressure
196
of the respective gases in the atmosphere.
197
The absence of any gas purification stage requires special attention to avoid matrix effects
198
related to ions of different gas species that contribute to the same signal at a givenm/zratio, e.g.,
199
due to multiple ionisation of gas species or isobaric gas molecules.56 Multiple ionisation can be
200
reduced substantially by reducing the electron impact energy in the ioniser unit in the QMS.57
201
In particular, the interferences occurring at m/z = 16 (12CH+4 and 16O2+2 ions) and at m/z = 20
202
(20Ne+and40Ar2+ions) may be of special relevance for the targeted applications of the miniRuedi.
203
Figure 4-A shows the F peak heights obtained from analysis of pure Ar at m/z = 40 (40Ar+) and
204
m/z = 20 (40Ar2+) as a function of the electron energy. For electron energies below 50 eV, the
205
40Ar2+/40Ar+ ratio is less than 3· 10−5, which is approximately two orders of magnitude lower
206
than the20Ne/40Ar ratio in air (1.77·10−3). Using electron energies of 50 eV or less will therefore
207
reduce the40Ar2+interference to a level where it can easily be compensated or even neglected for
208
20Ne analysis in air-like gases (Figure 4-B). However, we observed that 20(H2O) molecules may
209
contribute up to∼50 % to them/z= 20 signal in moist air-like gas matrices (such as in GE-MIMS
210
analyses). 20Ne quantification is therefore recommended in dry gases only and requires careful
211
compensation of the residual20(H2O) contribution, which may be estimated from the them/z=18
212
signal and by assuming a typical20(H2O)/18(H2O) ratio. Apart from these interferences, we did not
213
observe any significant interferences that would affect the gas analysis on them/zvalues shown in
214
Figure 2. Nevertheless, it is important to note that such interferences may become relevant in gas
215
matrices that are very different from the air-like gas assessed in this work.
216
To test the miniRuedi performance as a GE-MIMS with miniature membrane contactors at low
217
water flow, we compared GE-MIMS measurements using miniature membrane contactors (Liqui-
218
Cel G591, 11 cm3external volume) with measurements using the large membrane contactor as used
219
with our original GE-MIMS49(Liqui-Cel G542, 260 cm3external volume). The miniature contac-
220
tors were operated either as a single unit or as a parallel combination of two units. Groundwater
221
was pumped through the membrane contactors, and tee branches were used to split the water flow
222
among the membrane contactors for parallel operation of the miniature and the large contactors.
223
The flow rates were 0.4 L/min through each miniature contactor and 2 L/min through the large
224
contactor. 10 measurements were made with each miniature contactor setup (single or two parallel
225
contactors). Each miniature-contactor measurement was bracketed with a measurement using the
226
large contactor. Figure 5 shows that using a single miniature contactor may result in a small bias
227
of the gas partial pressures relative to those observed in the large contactor. For the tested gas
228
species shown in Figure 5, the bias is largest for CO2 (approximately 8%), but much smaller for
229
the remaining gases (He, Ar, Kr, N2). However, using two miniature contactors removes the bias
230
for all gases. The low gas consumption of the miniRuedi therefore obviates the compensation for
231
gas depletion in the membrane contactor and allows absolute GE-MIMS measurements with much
232
smaller membrane contactors and water flows than the previous GE-MIMS instrument49, which
233
requires a water flow of≥ 2 L/min.
234
Field test (accuracy and precision)
235
To quantify the accuracy and precision of the miniRuedi with the GE-MIMS method, we carried
236
out a series of 42 GE-MIMS measurements (using a Liqui-Cel G542 contactor) of the4He, N2,40Ar
237
and 84Kr concentrations in a small creek (Chriesbach, Switzerland). The concentrations of these
238
inert atmospheric gases in the creek are in equilibrium with their atmospheric partial pressure and
239
therefore serve as a well defined reference for comparison with the measured concentrations. In
240
addition, 29 air replicates were analysed to determine the precision of the miniRuedi measurements
241
without the GE-MIMS contactor. Air standards for drift calibration were carried out in between the
242
sample analyses. For each measurement, the peak heights atmz=4,28,40 and 84 were integrated
243
for 10 min.
244
The residuals ri = (Cm,i − Ce,i)/Ce,i of the measured concentrations in the water (Cm,i,i =
245
1. . .42) relative to the atmospheric equilibrium concentrations (Ce,i) were computed from the sol-
246
ubility of the respective gas at the water temperature that prevailed at the time of the corresponding
247
measurement (13.4◦C to 15.7◦C). The means of theri (µin Table 2) indicate that the accuracy
248
of the miniRuedi analysis with the GE-MIMS method was 0.9 % or better for all gases. The stan-
249
dard deviations of theri (σ) indicate that the overall precision of the miniRuedi analysis with the
250
GE-MIMS method ranged from 1.2 % to 3.3 %. The standard deviations of the air replicates anal-
251
ysed without the GE-MIMS contactor (σair) are only marginally smaller. The loss of precision
252
associated with the addition the GE-MIMS contactor to the miniRuedi is therefore small.
253
Application examples
254
In the three application examples below, we demonstrate the utility of the miniRuedi for the anal-
255
ysis of the gas dynamics in different environmental systems and field settings. The examples were
256
chosen to cover both gaseous and aqueous matrices and to span a wide range of processes and rates
257
controlling the natural gas dynamics.
258
Soil gas formation
259
Figure 6 shows the concentrations of Ar, N2, O2, CO2, and CH4 determined with the miniRuedi
260
in the soil gas of a bioreactor landfill located in north-eastern Switzerland. The landfill is being
261
prepared for active aerobisation by technical means in order to foster aerobic decomposition of the
262
mostly organic wastes to CO2in favour of anaerobic decomposition to the more potent greenhouse
263
gas CH4. To this end, the landfill has been sealed at the top. The ongoing production of landfill
264
gases therefore results in a steady gas outflow from the 5 observation wells, where the gases were
265
sampled in gas-tight 500 mL stainless-steel flasks. We connected the flasks to the miniRuedi gas
266
inlet to determine the concentrations of the various gas species in these samples . The concen-
267
trations of Ar, N2, and O2 were calibrated using ambient air, whereas gas mixtures of 10% CO2
268
in N2 and 10% CH4 in N2were used for CO2and CH4 calibration. As expected, the observed O2
269
concentrations are low in all 5 observation wells (0.5–2 %). The concentrations of the remaining
270
gases indicate a binary mixture of landfill gas (CO2, CH4) and oxygen-depleted air (N2, Ar). The
271
Ar concentration yields a direct quantification of the relative proportions of these two endmembers
272
and hence allows quantification of the air-derived O2that has been transformed within the landfill.
273
In addition, the N2/Ar ratio is elevated in one well by approximately 30% relative to the atmo-
274
spheric ratio, which points to N2 production by denitrification. Such combined analyses of inert
275
and active gas species are therefore highly beneficial to quantify the turnover of O2and other gases
276
and thus allows assessing the efficiency of landfill aerobisation.
277
Lake/atmosphere gas exchange
278
Figure 7 shows the partial pressures of Ar, N2, O2, CO2, and CH4 in a floating chamber deployed
279
on the water surface of Lake Soppensee (central Switzerland). Such floating chambers are used to
280
isolate a section of the water surface (0.126 m2) from the atmosphere in order to study CO2and CH4
281
fluxes across the water surface using a CO2/CH4analyser.58The mass balance of the gas species
282
in the chamber is controlled by the gas exchange across the isolated section of the water surface.
283
We connected the gas inlet of the miniRuedi to the floating chamber and recorded the change in the
284
partial pressures in the headspace after deployment on the lake during 12 min. The volume of the
285
gas transferred into the miniRuedi gas inlet during this period corresponds to less than 0.05!of
286
the floating chamber volume (19.1 L). The effect of the gas consumption of the miniRuedi on the
287
mass balance of the gas species in the floating chamber is therefore negligible. After deployment
288
of the floating chamber, the CH4 and CO2 partial pressures showed a marked increase relative
289
to the atmospheric background, because the surface water of the hypertrophic lake was strongly
290
supersaturated with these gases. In contrast, the surface water was undersaturated in O2 relative
291
to the atmospheric equilibrium (30% saturation) due to aerobic respiration and possibly also CH4
292
oxidation, rapid cooling of the surface water, and mixing with O2-depleted deep water. Despite
293
the large atmospheric O2background of the initial air trapped in the floating chamber, the decrease
294
of the O2 partial pressure due to O2 transfer to the water is small, but quantifiable. In contrast,
295
the Ar and N2 concentrations in the water were closer to saturation (both at 75% saturation), and
296
no systematic changes in the Ar and N2 partial pressures in the float chamber are observed. The
297
miniRuedi thus allows expanding the float chamber method for quantification of CO2 and CH4
298
fluxes to Ar, N2, O2, and possibly also other gas species. In particular, the gas consumed for
299
miniRuedi analysis does not interfere with the mass balance of the gas species in the floating
300
chamber. The miniRuedi might thus provide new insights into the rates and physical processes
301
controlling gas/water exchange, such as enhanced air/water exchange mediated by microbubbles
302
present in the water body.58
303
Seafloor gas emanation
304
Figure 8 shows the concentrations of He, CO2, and CH4 observed in deep-water samples taken
305
in the Gulf of California (Mexico). These gases are associated with hydrothermal fluids released
306
from black smokers or other fluid vents at the seafloor.59At each sampling location, replicate deep-
307
water samples were collected in 10 L Niskin samplers. Immediately after retrieval of the Niskin
308
samplers, one replicate was screened for the dissolved-gas concentrations with the miniRuedi using
309
the GE-MIMS method. To allow GE-MIMS analysis with such a limited amount of water, two
310
parallel miniature membrane contactors (Liqui-Cel G591) were used with a total water flow of
311
0.5 L/min from the Niskin samplers. The small gas volume of the miniature membrane contactors
312
facilitates fast gas/water equilibration within approximately 3 min after starting the water flow.
313
Therefore, more than 15 min were left for GE-MIMS analysis of the water flowing from the Niskin
314
samplers. The dissolved-gas concentrations obtained from the GE-MIMS screening were used
315
to optimise the the selection of subsamples from the remaining Niskin samplers for after-cruise
316
laboratory-based analyses of3He/4He andδ13C of the fluids emitted from the black smokers.59The
317
new possibility for rapid on-board GE-MIMS screening of relatively small sample volumes (10 L)
318
proved to be highly beneficial for identifying target samples for post-cruise analyses in specialised
319
labs. In addition, data turnaround time was reduced and the quality of the3He/4He andδ13C data
320
set used for detailed characterisation of the hydrothermal fluids was optimised.
321
Assessment
322
Our laboratory tests and field applications demonstrate the performance and flexibility of the
323
miniRuedi for on-site gas analysis in a wide range of environmental systems and applications.
324
The miniRuedi provides real-time partial pressure measurements of He, Ne (in dry gas), Ar, Kr,
325
N2, O2, CO2 and CH4 both in gaseous and aqueous matrices. The low gas consumption opens
326
up new possibilities for unbiased GE-MIMS quantification of dissolved gas concentrations at low
327
water flow, gas analysis in flux chambers, and other systems with low gas throughput where sample
328
gas consumption must be minimised to avoid interference with the natural gas dynamics. In con-
329
trast to earlier systems aimed at environmental gas analysis, the miniRuedi is highly suitable for
330
on-site gas analysis in various environmental systems and at remote locations due to its portability,
331
low power requirements, and maintenance-free operation. The on-site data availability and the
332
high temporal resolution of time-series data are crucial benefits over conventional methods based
333
on expensive and often laborious laboratory analyses of single samples. The miniRuedi therefore
334
opens new opportunities for the combined analysis of inert (He, Ne, Ar, Kr, N2) and reactive gases
335
(O2, CO2, CH4, etc.), which provides the basis for quantitative studies of environmental processes
336
and their interplay in terms of physical, chemical, and biological mechanisms.
337
Acknowledgement
338
We thank Philipp Weber for support with the lab tests and Anja Bretzler for editing assistance.
339
Further, we thank the four anonymous reviewers for their constructive comments.
340
References
(1) Cook, P., Herczeg, A., Eds. Environmental Tracers in Subsurface Hydrology; Kluwer Aca- demic Publishers: Boston, Dordrecht, London, 2000.
(2) Kipfer, R.; Aeschbach-Hertig, W.; Peeters, F.; Stute, M. In Noble gases in geochemistry and cosmochemistry; Porcelli, D., Ballentine, C., Wieler, R., Eds.; Rev. Mineral. Geochem.;
Mineralogical Society of America, Geochemical Society, 2002; Vol. 47; pp 615–700.
(3) Aeschbach-Hertig, W.; Solomon, D. In The Noble Gases as Geochemical Tracers;
Burnard, P., Ed.; Advances in Isotope Geochemistry; Springer: Heidelberg, New York, Dor- drecht, London, 2013; pp 81–122.
(4) Brennwald, M. S.; Vogel, N.; Scheidegger, Y.; Tomonaga, Y.; Livingstone, D. M.; Kipfer, R.
InThe Noble Gases as Geochemical Tracers; Burnard, P. G., Ed.; Advances in Isotope Geo- chemistry; Springer, 2013; pp 123–153.
(5) Stanley, R. H. R.; Jenkins, W. J. In The Noble Gases as Geochemical Tracers; Burnard, P., Ed.; Advances in Isotope Geochemistry; Springer, 2013; pp 55–79.
(6) Aeschbach-Hertig, W.; Peeters, F.; Beyerle, U.; Kipfer, R. Interpretation of dissolved atmo- spheric noble gases in natural waters.Water Resour. Res.1999,35, 2779–2792.
(7) Beyerle, U.; Aeschbach-Hertig, W.; Hofer, M.; Imboden, D. M.; Baur, H.; Kipfer, R. Infiltra- tion of river water to a shallow aquifer investigated with3H/3He, noble gases and CFCs.J.
Hydrol.1999,220, 169–185.
(8) Aeschbach-Hertig, W.; Peeters, F.; Beyerle, U.; Kipfer, R. Palaeotemperature reconstruction from noble gases in ground water taking into account equilibration with entrapped air.Nature 2000,405, 1040–1044.
(9) Hohmann, R.; Schlosser, P.; Jacobs, S.; Ludin, A.; Weppernig, R. Excess helium and neon in the southeast Pacific: Tracers for glacial meltwater.J. Geophys. Res.–Oceans 2002, 107, 3198.
(10) Thomas, J. M.; Hudson, G. B.; Stute, M.; Clark, J. F. Noble gas loss may indicate groundwater flow across flow barriers in southern Nevada.Env. Geol.2003,43, 568–579.
(11) Brennwald, M. S.; Imboden, D. M.; Kipfer, R. Release of gas bubbles from lake sediment traced by noble gas isotopes in the sediment pore water.Earth Planet. Sci. Lett. 2005, 235, 31–44.
(12) Huber, C.; Beyerle, U.; Leuenberger, M.; Schwander, J.; Kipfer, R.; Spahni, R.; Severing- haus, J. P.; Weiler, K. Evidence for molecular size dependent gas fractionation in firn air derived from noble gases, oxygen, and nitrogen measurements.Earth Planet. Sci. Lett.2006, 243, 61–73.
(13) Severinghaus, J. P.; Battle, M. Fractionation of gases in polar ice during bubble close-off:
new constraints from firn air Ne, Kr, and Xe observations.Earth Planet. Sci. Lett.2006,244, 474–500.
(14) Klump, S.; Kipfer, R.; Cirpka, O. A.; Harvey, C. F.; Brennwald, M. S.; Ashfaque, K. N.;
Badruzzaman, A. B. M.; Hug, S. J.; Imboden, D. M. Groundwater Dynamics and Arsenic Mobilization in Bangladesh Assessed using Noble Gases and Tritium.Environ. Sci. Technol.
2006,40, 243–250.
(15) Klump, S.; Tomonaga, Y.; Kienzler, P.; Kinzelbach, W.; Baumann, T.; Imboden, D.;
Kipfer, R. Field experiments yield new insights into gas exchange and excess air formation in natural porous media.Geochim. Cosmochim. Acta2007,71, 1385–1397.
(16) Cey, B. D.; Hudson, G. B.; Moran, J. E.; Scanlon, B. R. Impact of Artificial Recharge on Dissolved Noble Gases in Groundwater in California.Environ. Sci. Technol.2008,42, 1017–
1023, PMID: 18351066.
(17) Klump, S.; Cirpka, O.; Surbeck, H.; Kipfer, R. Experimental and numerical studies on excess- air formation in quasi-saturated porous media.Water Resour. Res.2008,44, W05402.
(18) Holzner, C. P.; McGinnis, D. F.; Schubert, C. J.; Kipfer, R.; Imboden, D. M. Noble gas anomalies related to high-intensity methane gas seeps in the Black Sea.Earth Planet. Sci.
Lett.2008,265, 396–409.
(19) Althaus, R.; Klump, S.; Onnis, A.; Kipfer, R.; Purtschert, R.; Stauffer, F.; Kinzelbach, W.
Noble gas tracers for characterisation of flow dynamics and origin of groundwater: A case study in Switzerland.J. Hydrol.2009,370, 64–72.
(20) Chaduteau, C.; Jean-Baptiste, P.; Fourr´e, E.; Charlou, J.-L.; Donval, J.-P. Helium transport in sediment pore fluids of the Congo-Angola margin.Geochem. Geophys. Geosyst.2009,10, Q01002.
(21) Pitre, F.; Pinti, D. L. Noble gas enrichments in porewater of estuarine sediments and their effect on the estimation of net denitrification rates. Geochim. Cosmochim. Acta 2010, 74, 531–539.
(22) Severinghaus, J. P.; Albert, M. R.; Courville, Z. R.; Fahnestock, M. A.; Kawamura, K.;
Montzka, S. A.; M¨uhle, J.; Scambos, T. A.; Shields, E.; Shuman, C. A.; Suwa, M.; Tans, P.;
Weiss, R. F. Deep air convection in the firn at a zero-accumulation site, central Antarctica.
Earth Planet. Sci. Lett.2010,293, 359–367.
(23) Hall, C. M.; Castro, M. C.; Lohmann, K. C.; Sun, T. Testing the noble gas paleothermometer with a yearlong study of groundwater noble gases in an instrumented monitoring well.Water Resour. Res.2012,48, W04517.
(24) Grundl, T.; Magnusson, N.; Brennwald, M. S.; Kipfer, R. Mechanisms of subglacial ground- water recharge as derived from noble gas, 14C, and stable isotopic data. Earth Planet. Sci.
Lett.2013,369-370, 78–85.
(25) Loose, B.; Jenkins, W. J. The five stable noble gases are sensitive unambiguous tracers of glacial meltwater.Geophys. Res. Lett.2014,41, 2835–2841.
(26) Tomonaga, Y.; Brennwald, M. S.; Meydan, A. F.; Kipfer, R. Noble gases in the sediments of Lake Van – Solute transport and palaeoenvironmental reconstruction.Quaternary Sci. Rev.
2014,104, 117–126.
(27) Tomonaga, Y.; Brennwald, M. S.; Kipfer, R. Attenuation of diffusive noble-gas transport in laminated sediments of the Stockholm Archipelago.Limnol. Oceanogr.2015,60, 497–511.
(28) Tomonaga, Y.; Brennwald, M. S.; Livingstone, D. M.; Tomonaga, G.; Kipfer, R. Determi- nation of Natural In Vivo Noble-Gas Concentrations in Human Blood.PLOS ONE2014, 9, e96972.
(29) Thevis, M.; Piper, T.; Geyer, H.; Thomas, A.; Schaefer, M. S.; Kienbaum, P.; Sch¨anzer, W.
Measuring xenon in human plasma and blood by gas chromatography/mass spectrometry.
Rapid Comm. Mass Spectrometry2014,28, 1501–1506.
(30) Stanley, R. H. R.; Kirkpatrick, J. B.; Cassar, N.; Barnett, B. A.; Bender, M. L. Net commu- nity production and gross primary production rates in the western equatorial Pacific.Global Biogeochem. Cycles2010,24, GB4001.
(31) Freundt, F.; Schneider, T.; Aeschbach-Hertig, W. Response of noble gas partial pressures in soil air to oxygen depletion.Chem. Geol.2013,339, 283–290.
(32) M¨achler, L.; Brennwald, M. S.; Kipfer, R. Argon Concentration Time-Series As a Tool to Study Gas Dynamics in the Hyporheic Zone.Environ. Sci. Technol.2013,47, 7060–7066.
(33) M¨achler, L.; Peter, S.; Brennwald, M. S.; Kipfer, R. Excess air formation as a mechanism for delivering oxygen to groundwater.Water Resour. Res.2013,49, 1–10.
(34) Eveleth, R.; Timmermans, M.-L.; Cassar, N. Physical and biological controls on oxygen saturation variability in the upper Arctic Ocean.J. Geophys. Res.–Oceans2014, 119, 7420–
7432.
(35) Peter, S.; M¨achler, L.; Kipfer, R.; Wehrli, B.; Durisch-Kaiser, E. Flood-Controlled Excess- Air Formation Favors Aearobic Respiraton and Limits Denitrification Activity in Riparian Groundwater.Frontiers Env. Sci.2015,3.
(36) Hofer, M.; Imboden, D. M. Simultaneous determination of CFC-11, CFC-12, N2 and Ar in water.Anal. Chem.1998,70, 724–729.
(37) Beyerle, U.; Aeschbach-Hertig, W.; Imboden, D. M.; Baur, H.; Graf, T.; Kipfer, R. A mass spectrometric system for the analysis of noble gases and tritium from water samples.Environ.
Sci. Technol.2000,34, 2042–2050.
(38) Kulongoski, J. T.; Hilton, D. R. A quadrupole-based mass spectrometric system for the de- termination of noble gas abundances in fluids.Geochem. Geophys. Geosyst.2002,3, 1–10.
(39) Stanley, R. H. R.; Baschek, B.; Lott III, D. E.; Jenkins, W. J. A new automated method for measuring noble gases and their isotopic ratios in water samples. Geochem. Geophys.
Geosyst.2009,10, Q05008.
(40) S¨ultenfuss, J.; Roether, W.; Rhein, M. The Bremen mass spectrometric facility for the mea- surement of helium isotopes, neon, and tritium in water. Isotopes In Environmental and Health Studies2009,45, 83–95.
(41) Brennwald, M. S.; Hofer, M.; Kipfer, R. Simultaneous analysis of noble gases, sulphur hex- afluoride and other dissolved gases in water.Environ. Sci. Technol.2013,47, 8599–8608.
(42) Visser, A.; Singleton, M. J.; Hillegonds, D. J.; Velsko, C. A.; Moran, J. E.; Esser, B. K. A membrane inlet mass spectrometry system for noble gases at natural abundances in gas and water samples.Rapid Communications in Mass Spectrometry2013,27, 2472–2482.
(43) Kotiaho, T. On-site Environmental and In Situ Process Analysis by Mass Spectrometry.Jour- nal of Mass Spectrometry1996,31, 1–15.
(44) Ketola, R. A. In Environmental Instrumentation and Analysis Handbook; Randy D. Down P E, R. D., Lehr, J. H., Eds.; Wiley, 2005; pp 187–220.
(45) Schl¨uter, M.; Gentz, T. Application of Membrane Inlet Mass Spectrometry for Online and In Situ Analysis of Methane in Aquatic Environments.J. Am. Soc. Mass Spectromet.2008, 19, 1395–1402.
(46) Gentz, T.; Schl¨uter, M. Underwater cryotrap-membrane inlet system (CT-MIS) for improved in situ analysis of gases.Limnol. Oceanogr. Methods2012,10, 317–238.
(47) Sommer, S.; Schmidt, M.; Linke, P. Continuous inline tracking of dissolved methane plume at a blowout site in the Northern North Sea UK – water column stratification impedes immediate methane release into the atmosphere.Marine and Petroleum Geology2015,68, 766–775.
(48) Schmidt, M.; Linke, P.; Sommer, S.; Esser, D.; Cherednichenko, S. Natural CO2 seeps off- shore Panarea – A test site for subsea CO2 leak detection technology. Marine Technology Society Journal2015,49, 19–30.
(49) M¨achler, L.; Brennwald, M. S.; Kipfer, R. Membrane Inlet Mass Spectrometer for the Quasi- Continuous On-Site Analysis of Dissolved Gases in Groundwater. Environ. Sci. Technol.
2012,46, 8288–8296.
(50) Cassar, N.; Barnett, B.; Bender, M. L.; Kaiser, J.; Hamme, R. C.; Tilbrook, B. Continuous High-Frequency Dissolved O2/Ar Measurements by Equilibrator Inlet Mass Spectrometry.
Anal. Chem.2009,81, 1855–1864.
(51) Manning, C. C.; Stanley, R. H. R.; Lott III, D. E. Continuous Measurements of Dissolved Ne, Ar, Kr, and Xe Ratios with a Field-Deployable Gas Equilibration Mass Spectrometer.Anal.
Chem.2016,88, 3040–3048.
(52) M¨achler, L. Quantification of oxygen turnover in groundwater by continuous on-site gas con- centration measurements. Ph.D. thesis, ETH Z¨urich, 2012.
(53) M¨achler, L.; Brennwald, M. S.; Tyroller, L.; Livingstone, D. M.; Kipfer, R. Conquering the Outdoors with On-Site Mass Spectrometry.Chimia2014,68, 155–159.
(54) Fryer, G. M. A theory of gas flow through capillary tubes. Proc. Royal Soc. London, Ser. A Math. Phys. Sci.1966,293, 329–341.
(55) Werle, P.; M¨ucke, R.; Slemr, F. The Limits of Signal Averaging in Atmospheric Trace-Gas Monitoring by Tunable Diode-Laser Absorption Spectroscopy (TDLAS).Appl. Phys. B1993, 131–139.
(56) Burnard, P.; Zimmermann, L.; Sano, Y. In The Noble Gases as Geochemical Tracers;
Burnard, P., Ed.; Advances in Isotope Geochemistry; Springer, 2013; pp 1–15.
(57) Davies, S.; Rees, J. A.; Seymour, D. L. Threshold ionisation mass spectrometry (TIMS);
a complementary quantitative technique to conventional mass resolved mass spectrometry.
Vacuum2014,101, 416–422.
(58) McGinnis, D. F.; Kirillin, G.; W, T. K.; Flury, S.; Bodmer, P.; Engelhardt, C.; Casper, P.;
Grossart, H.-P. Enhancing Surface Methane Fluxes from an Oligotrophic Lake: Exploring the Microbubble Hypothesis.Environ. Sci. Technol.2015,49, 873–880.
(59) Berndt, C. et al. Rifting under steam – how rift magmatism triggers methane venting from sedimentary basins.Geology2016, G38049.1.
Tables
Table 1: Parts list (see also Figure 1).
Part Description
S 6-port inlet selector valve (VICI C5-2306EMHY)
C 10 m stainless steel tubing with 0.1 mm inner diameter (VICI TSS104) V Inlet valve (Swagelok SS-4H)
QMS Quadrupole mass spectrometer with Faraday cup and secondary electron mul- tiplier detectors (Stanford Research Systems RGA-200)
TP Turbomolecular pump with 70 L/s pumping speed (Pfeiffer HiPace 80) DP Diaphragm pump for<20 mbar forevacuum (KNF N 813.4 ANDC-B)
Power supply 24 VDC power supply (max. 5 A during turn on) for S, QMS, TP, and DP, for instance 2×12 V ‘car batteries’ or mains voltage converter (e.g., Mean Well SP-240-24)
Table 2: Field test results for accuracy and precision of the miniRuedi analysis and the GE-MIMS method (see text). Means (µ) and standard deviations (σ) of the residuals of the observed concen- trations relative to the atmospheric equilibrium concentrations, and standard deviations of replicate air analysis results (σair).
Species µ(%) σ(%) σair(%)
4He -0.5 2.5 1.9
N2 -0.3 1.2 0.9
40Ar 0.8 2.3 1.1
84Kr 0.9 3.3 3.2
Figures
Gas flow
C
S V
60 cm
40 cm
QMS
TP DP
V QMS TP DP
C
Computer
1 S
2 3 4 5 6
Figure 1: Schematic overview (top) and photo (bottom) of the miniRuedi mass-spectrometer sys- tem (see also Table 1): 6-port inlet selector valve (S), capillary (C), inlet valve (V), quadrupole mass spectrometer (QMS), turbomolecular pump (TP), diaphragm pump (DP). The inlet selector valve and the quadrupole mass spectrometer are controlled by a computer. The photo shows the miniRuedi mounted in a wheeled hardshell suitcase for transport and protection.
10-13 10-12 10-11 10-10 10-9 10-8 10-7
1% 10% 100%
Detector signal s m/z (A)
Fraction _ of original test gas dilution
4He (m/z=4, M)
4He (m/z=4, F)
40Ar (m/z=40, F) CH4 (m/z=15, M)
N2 (m/z=28, F)
*
CO2 (m/z=44, F) O2 (m/z=32, F)
sm/z = const. × _
Figure 2: Peak heights sm/zobtained with F and M detectors from a test gas mixture (at ambient pressure) that was incrementally diluted with pure N2to reduce the partial pressures of the various gas species (see text). The dilution is quantified as the fractionαof the original test gas remaining in the dilution. Them/z= 28 peak heights corresponding to the N2of the test gas (denoted by an asterisk, N2*) was arithmetically corrected for the contribution of the N2 added for dilution. The dots show the peak heights at the respectivem/zvalues (mean values of three replicate analyses).
Error bars reflecting the standard deviations of the replicate measurements are covered by the plot symbols, except for N2* error bars, which reflect the uncertainty of the dilution correction. The best-fit lines are of the formsm/z= const.×α, withr2 >99.5% for all fits.
0.1%
1%
3%
0.3%
102 103 104
mA
o (s) F (O2, m/z = 32)
M (He, m/z = 4)
Figure 3: Relative Allan deviationsσAas a function of the averaging timeτof the F and M signal readings obtained from the analysis of an air sample (see text). The instrument was operated in a laboratory with ambient temperature stabilised to±1◦C.
10-14 10-13 10-12 10-11 10-10 10-9 10-8 10-7
F signal (A)F and M signals (A)
A (pure Ar)
B (air)
m/z = 40 (F)
m/z = 20 (M) (divided by 1000)
Ionizing electron energy (eV) 10-15
10-14 10-13 10-12 10-11 10-10 10-9
20 30 40 50 60 70 80 90 100 110
m/z = 40 (F)
m/z = 20 (F)
Figure 4: Peak heights at m/z = 20 and m/z = 40 as a function of the ionising electron energy.
A: analysis of pure Ar (99.999%) using the F detector. B: analysis of air, where peak heights at m/z = 20 were analysed using the M detector and divided by 1000 to compensate for the higher sensitivity of the M detector relative to the F detector.
-10 -5 0 5 10
-10 -5 0 5 10
-10 -5 0 5 10
-10 -5 0 5 10
-10 -5 0 5 10
1 2 3 4 5 6 7 8 9 10
Measurement number
Single MicroModule Double MicroModule MiniModule (reference)
He bias (%)N2 bias (%)Ar bias (%)Kr bias (%)CO2 bias (%)
Figure 5: Bias in partial pressures obtained from GE-MIMS measurements in groundwater using miniature membrane contactors (Liqui-Cel MicroModule, type 0.5 × 1 / G591) relative to par- tial pressures in larger membrane contactors as required for the original GE-MIMS instrument49 (Liqui-Cel MiniModule, type 1.7×5.5 / G542). The miniature contactors were operated either as a single unit or as a parallel combination of two units. Groundwater was pumped through the membrane contactors, and tee branches were used to split the water flow among the membrane contactors for parallel operation of the MicroModules and the MiniModule. The error bars reflect the variability of the gas concentrations in the groundwater flow and the noise in the MS detector signals during each measurement.
0 20 40 60 80
0.2 0.4 0.6 0.8
X
i(% )
X
Ar(%)
N
2A B C D E
CH
4CO
2O
2Figure 6: Soil gas composition in a covered landfill: volumetric concentrations of Ar vs. concen- trations ofi= N2,O2,CO2,CH4in the five observations wells A–E. Replicate samples were taken in wells A, B and C. Error bars reflecting the standard errors of the measurements are covered by the plot symbols.
-5 0 5 10 15 20 25
0 2 4 6
CH4 CO2
isolated from atmosphere N2
O2
40Ar
8 10 12
6p i (%)
Time after isolation (min) free air
Figure 7: Gas exchange at the water surface of Lake Soppensee: changes of the partial pressures of Ar, N2, O2, CO2, and CH4in an air volume above the water surface, before and after isolating the air volume from the atmosphere (∆pi, change relative to initial partial pressures in free air).
10-3
3×10⁻⁸ 10-7 3×10⁻⁷ 10-6 10-2
10-1
10-8 10-7 10-6
CO
2(cm
3 STP/ g) CH
4(cm
3 STP/ g)
CH4 CO2
He (cm
3STP/ g)
Black Smo
kers
Background
Figure 8: Screening seawater samples for hydrothermal fluids released from black smokers in the Gulf of California:59 He, CO2, and CH4 concentrations in water samples taken at water depths of up to 2 km (note the logarithmic axis scales).