Supplementary Material: Reloca Slide: an ∼ 24 km
3submarine mass wasting event in response to over-steepening and failure of
the central Chilean continental slope
February 26, 2016
Eduardo Contreras-Reyes1,∗, David Voelker2, Joerg Bialas3, Eduardo Moscoso4, and Ingo Grevemyer3
1 Departamento de Geof´ısica, Facultad de Ciencias de F´ısicas y Matem´aticas, Universidad de Chile, Santiago, Chile.
2 MARUM, Zentrum fuer Marine Umweltwissenschaften der Universitaet Bremen, Bremen, Ger- many.
3 GEOMAR, Helmholtz Zentrum fuer Ozeanforschung, Kiel, Germany.
4 ERDBEBEN, Geophysical Prospecting Company, Valpara´ıso, Chile
∗ Corresponding author: Eduardo Contreras-Reyes:
Departamento de Geof´ısica, Facultad de Ciencias F´ısicas y Matem´aticas, Universidad de Chile, Blanco Encalada 2002, Santiago, Chile. Tel.: +56 2 29784296, Fax: +56 2 26968686, E-Mail: econtreras@dgf.uchile.cl
1 Reloca Slide description
−75˚ −74˚ −73˚ −72˚
−36˚30'
−36˚00'
−35˚30'
−35˚00'
−34˚30'
−34˚00'
−33˚30'
−75˚ −74˚ −73˚ −72˚
−36˚30'
−36˚00'
−35˚30'
−35˚00'
−34˚30'
−34˚00'
−33˚30'
−75˚ −74˚ −73˚ −72˚
−36˚30'
−36˚00'
−35˚30'
−35˚00'
−34˚30'
−34˚00'
−33˚30'
0 50
−6000 −5000 −4000 −3000 −2000 −1000 0 1000 2000 Bathymetry/Topography (m)
km P03
P09 Chile trench
axial channel
Mataquit
o can
yon
canyon
slide NAZCA PLATE 6.6 cm/a
SOUTH AMERICAN PLATE
head scarp
5 4 3 2 1 0
−35˚30'
(km)
Chile trench axial channel
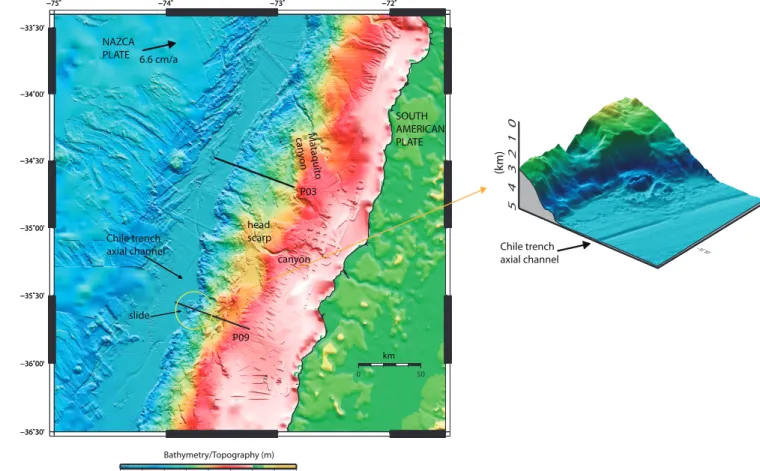
Figure S1 The Reloca Slide is exceptionally evident a product of a mass wasting event be- cause of the proximity of the evacuation area and the displaced material and because the good preservation and textbook morphology of both. The evacuation area at the lower slope is present as a spoon-shaped indentation into the lowermost slope with a headscarp that is clearly defined as a sudden gradient change of the lower continental slope. Black lines denote the wide-angle seismic profiles studied byMoscoso et al., [2011]), P03 and this work, P09.
The Reloca Segment is characterized by a remarkably steep lower continental slope and we propose that it had reached an overcritical angle producing the mass wasting event. The land- ward migration of the deformation front within the Reloca Segment is a typical feature seen at convergent margins where high oceanic features like seamounts are being subducted. However,
seamount subduction is usually accompanied by landward dipping normal faults in the upper plate as consequence of the subsidence of the accretionary prism in the aftermath of the seamount passage [e.g., Dominguez et al., 2000]. In contrast, the Reloca Segment is rather characterized by uplift of the continental slope landward of the Reloca Slide (Fig. 2B). Moreover, the shape of the indentation of the lowermost slope does not match a theoretical entry trajectory of a seamount defined by the convergence direction of the Nazca and South American plates, which has an azimuth of about N78oE over the last 3 Ma [Angermann et al., 1999]. Also the size of the indentation of the Reloca Segment is broad, which would call for the subduction of a large seamount. However, no seamounts that rise more than 1 km from the seafloor are observed on the Nazca Plate seaward of Central Chile which renders the hypothesis of seamount subduction as the cause of the Reloca Slide unlikely. Alternatively, frontal removal (without uplift) could produce a similar geometry of the lower slope (with a steep slope). That is, removing the tip of the acrretionary prism by frontal erosion. However, this mechanism is also unlikely due to the abundance of sediment at the trench and the absence of high oceanic features preventing subduction erosion and therefore the frontal removal of the accretionary prism.
1.1 The tsunamigenic potential of the Reloca Slide
The possibility that the slide crept downhill seem unlikely for a number of reasons, mostly be- cause of the morphology of the slide deposits:
- First of all, the bulk (∼70%) of the total volume of the deposits are present in the form of angular blocks that are dispersed over in the trench. The blocks that have moved furthest lie some km away from the toe of the slope. The shattering into separate blocks, the wide scatter and the far transport call for a high-energy transport of brittle material rather than slow defor- mation of a viscous mass.
- Downslope creep of sediments typically produces a morphology related to extensional de- formation upslope (thinned sediment) and compressive deformation where the slope gradient decreases again (folds, imbrications). Nothing similar is observed around Reloca. The glide plane forms a distinct edge in the slope an is internally smooth and the deposits do not show a micro - bathymetry indicative of internal creep.
- Creep could theoretically also happen in a way that the displaced block remained internally undeformed but moved slowly along a predefined plane of weakness. However, we consider this scenario unlikely, again because of the wide dispersal of the material in the trench (would it have arrived slowly at the trench it would simply have gotten stuck in the trench sediments and probably wouldn’t even have detached fully from the slope). Secondly, looking at the inclination of the slide plane (∼30o) and the gravitational force of the block (or its sheer size), the glide
plane would have have very particular frictional properties to resist sudden failure and permit steady slow creep.
As listed above, all observations indicate a rapid (and thus tsunamogenic) event. Regarding the rates of motion: we applied a set of numeric descriptions of the motion of failing submarine landslides that were published by Grilli and Watts [e.g.,Watts et al., 2003] and come up with terminal velocities of>100 m/s for the event[Voelker et al., 2009]. On the other hand, we have no indications of present or ongoing failure in the bathymetry. Everything points to Reloca Slide being a relict of a sudden event.
1.2 Ratios of sand to silt to shale in the Reloca Slide material and the ages Little of the slumped material has been cored and those core segments that show clear indi- cations of slump deformation consist of angular to sightly rounded clasts of different material, mostly fine sand-sized material[Flueh and Bialas, 2008]. Our attempts to date the material had no success because of the paucity of datable foraminifera. Judging from the geometry of the slide scar, Reloca Slide has mainly removed material of the present accretionary prism, but has possibly exposed the inner prism that is supposed to be made of a paleo-accretionary prism of a former phase of accretion. Melnick and Echtler, [2006] argued that during Pliocene the margin shifted from erosive to accretionary mode in response to an increase in trench sedimentation rate, linked to fast denudation of the Andes and a coeval decrease of the subduction rate. Sim- ilarly, Kukowski and Oncken, [2006]suggested that the southern central Chile subduction zone has been in accretion mode since the Pliocene, following on a period of subduction erosion that started at least in the middle Miocene.
1.3 Debris fan
Sediment gravity cores were collected during RRS JAMES COOK cruise JC23b [Flueh and Bialas, 2008]. The coring plan was laid out to sample reference core upslope of the headscarp, samples from the headscarp, the top of the largest slide block and the distal-most parts of the slide. Two sites on the distal part of the landslide were chosen on basis of sediment echosounder data that showed a 1-3 m thick, well-layered top part (post-slump sediments) resting on an acoustically transparent, wedge-shaped sediment body (debrite, slumped material). The goal was to sample both acoustic units. This was achieved at gravity core station GC11. From the sea floor to 131.5 cm bsf, the sediment column consists of homogeneous, brown silty clay to clay, intercalated by few thin volcanic ash layers (post-slump). Below, from 139 to 303 cm bsf., there is a lithological unit that consists of lenses of heterogeneous material. There is no layering visi- ble, instead, sediment clasts of up to 10 cm size in diameter are stacked chaotically, producing a
patchy appearance with a dominance of dark gray and light gray patches. The clasts are slightly rounded and internally uniform. They consist of fine- sand sized material with the exception of some lenses of clay stones (more detailed in[Voelker et al., 2009]).
We have little control on the maximum and average thickness of unconsolidated sediments in the survey lines. Recent sedimentation rates on the central Chile slope have been reported to vary extremely, due to downslope transport patterns and local upwelling cells [Munoz et al., 2004], and to be high (up to 0.25 cm/yr,[Munoz et al., 2004]).
1.4 Giant slope failures in the Arauco area in central Chile (36.5o-39oS) Figure S2Geersen et al., [2011]) reported three Pleistocene giant slope failures in the Arauco area in central Chile (36.5o-39oS): Isla Santa Mar´ıa Slide (∼388 km3), Arauco Slide (∼253 km3), and the Mocha Slide (∼472 km3). These authors used seismic reflection constraints to estimate ages of 250, 410, and 560 ka for the Santa Mar´ıa, Arauco, and Mocha Slides, respectively.
−75˚ −74˚ −73˚
−40˚00'
−39˚30'
−39˚00'
−38˚30'
−38˚00'
−37˚30'
−37˚00'
−36˚30'
−75˚ −74˚ −73˚
−40˚00'
−39˚30'
−39˚00'
−38˚30'
−38˚00'
−37˚30'
−37˚00'
−36˚30'
0 50
Isla Mocha
Isla Santa María
Peninsula de Arauco
(km) Mocha slide Arauco slide
Santa María slide
Chil e tr enc h a xia l channel
2 Coseismic slip models
−75˚ −74˚ −73˚ −72˚
−37˚00'
−36˚30'
−36˚00'
−35˚30'
−35˚00'
−34˚30'
−34˚00'
−33˚30'
−75˚ −74˚ −73˚ −72˚
−37˚00'
−36˚30'
−36˚00'
−35˚30'
−35˚00'
−34˚30'
−34˚00'
−33˚30'
66mm/y
CB MB
NB
Reloca
Mataquito 2
2
2 4
4
4
4
6 6
6
6
8 8
8
10 10
10 12
14
16
Delois et al., 2010
−75˚ −74˚ −73˚ −72˚
−37˚00'
−36˚30'
−36˚00'
−35˚30'
−35˚00'
−34˚30'
−34˚00'
−33˚30'
0 50
Navidad
Pichilemu
Constitución
Chanco Pelluhue
Concepción
−75˚ −74˚ −73˚ −72˚
−37˚00'
−36˚30'
−36˚00'
−35˚30'
−35˚00'
−34˚30'
−34˚00'
−33˚30'
−75˚ −74˚ −73˚ −72˚
−37˚00'
−36˚30'
−36˚00'
−35˚30'
−35˚00'
−34˚30'
−34˚00'
−33˚30'
66mm/y
CB MB
NB
Reloca Mataquito
2
2
2
2 2
2
2
4
4
4
4
4
6 6
6
8 8
8 10
10
10
12
12
14 16
18
Lorito et al., 2011
−75˚ −74˚ −73˚ −72˚
−37˚00'
−36˚30'
−36˚00'
−35˚30'
−35˚00'
−34˚30'
−34˚00'
−33˚30'
0 50
Navidad
Pichilemu
Constitución
Chanco Pelluhue
Concepción
−75˚ −74˚ −73˚ −72˚
−37˚00'
−36˚30'
−36˚00'
−35˚30'
−35˚00'
−34˚30'
−34˚00'
−33˚30'
−75˚ −74˚ −73˚ −72˚
−37˚00'
−36˚30'
−36˚00'
−35˚30'
−35˚00'
−34˚30'
−34˚00'
−33˚30'
66mm/y
CB MB
NB
Reloca Mataquito
2
2
4
4 6 6 6
8
8
8 8
10 10
10 12 14
16 16
Yue et al., 2014
−75˚ −74˚ −73˚ −72˚
−37˚00'
−36˚30'
−36˚00'
−35˚30'
−35˚00'
−34˚30'
−34˚00'
−33˚30'
0 50
Navidad
Pichilemu
Constitución
Chanco Pelluhue
Concepción
−75˚ −74˚ −73˚ −72˚
−37˚00'
−36˚30'
−36˚00'
−35˚30'
−35˚00'
−34˚30'
−34˚00'
−33˚30'
−75˚ −74˚ −73˚ −72˚
−37˚00'
−36˚30'
−36˚00'
−35˚30'
−35˚00'
−34˚30'
−34˚00'
−33˚30'
66mm/y
CB MB
NB
Reloca Mataquito
4 2
4 6
6 8
8
8
10
10
12 14 16
Moreno et al., 2012
−75˚ −74˚ −73˚ −72˚
−37˚00'
−36˚30'
−36˚00'
−35˚30'
−35˚00'
−34˚30'
−34˚00'
−33˚30'
0 50
Navidad
Pichilemu
Constitución
Chanco Pelluhue
Concepción
(A) (B)
(D) (C)
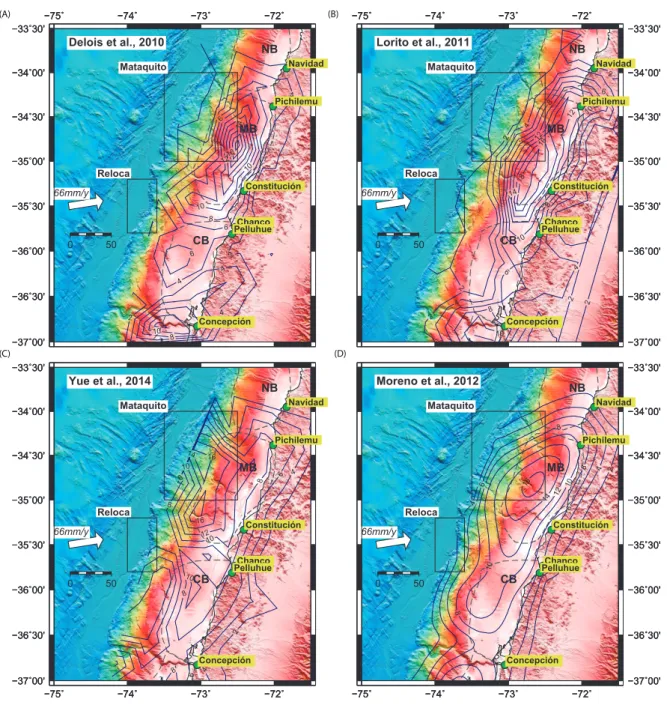
Figure S3 Coseismic slip model of the Maule megathrust earthquakeMw 8.8 (February 27,
2010).
3 Seismic Data and Modeling
The seismic refraction profile (Fig. 1) traversed the central Chile subduction zone system at
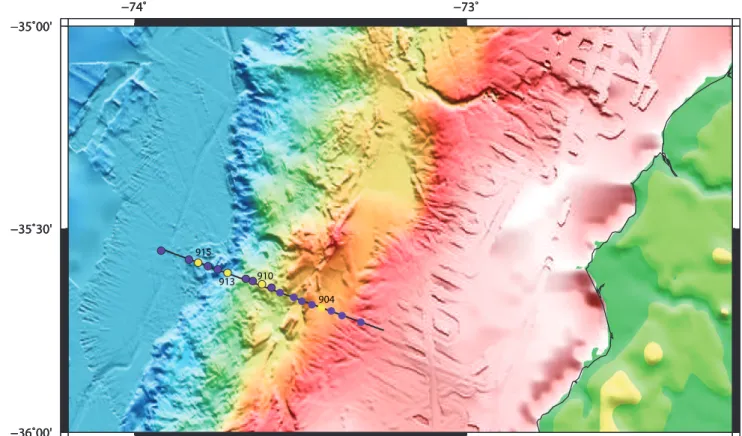
∼35.6oS, including the subducting Nazca plate, the trench axis, and the outer forearc. The line is about 62 km long and 18 ocean-bottom-hydrophones (OBH) and ocean-bottom-seismometres (OBS) were deployed along it (Fig. S4). Receiver spacing along the profile ranges between 3 and 5 km.
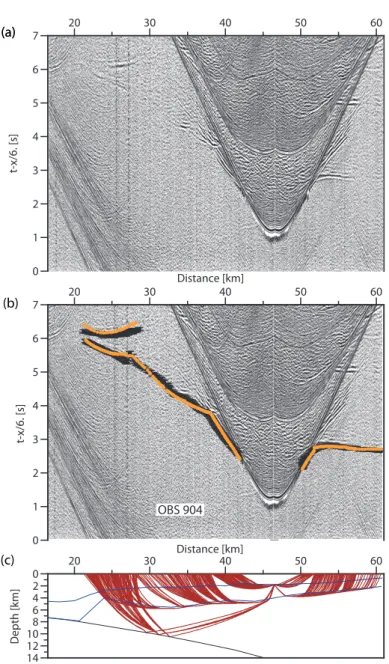
In the overriding plate, intra-crustal refractions (Pg1), and reflections from the top of the oceanic crust (PtocP) of excellent quality were recorded. Fig. S5 shows data examples of seismic record sections with their respective seismic phases identified. The typical travel time picking uncertainty was 60 and 65 ms forPg1 and PtocP phases, respectively.
The 2D velocity structure that best fits the observed arrivals was determined using a joint refraction and reflection travel time inversion technique [Korenaga et al., 2000]. This method allows joint inversion of seismic refraction and reflection travel time data for a 2-D velocity field.
Travel times and ray paths are calculated using a hybrid ray-tracing scheme based on the graph method and the local ray-bending refinement [van Avendonk et al., 1998]. Smoothing constraints using predefined correlation lengths and optimized damping constraints for the model parame- ters are employed to regularize an iterative linearized inversion [Korenaga et al., 2000].
The best fitting velocity model consists of the following layers: (1) water, (2) sediment/debris on top of the continental basement, (3) continental crust, and (4) incoming-subducting oceanic crust. To derive the velocity depth model, the water depth was taken from the swath bathymetry center beam, which remained fixed during the inversion. In order to obtain the sedimentary and crustal velocities, and bottom of the overriding plate we jointly invert refraction (Pg1) and reflections (PtocP) phases.
−74˚ −73˚
−36˚00'
−35˚30'
−35˚00'
−74˚ −73˚
−36˚00'
−35˚30'
−35˚00'
−74˚ −73˚
−36˚00'
−35˚30'
−35˚00'
915
913 910
904
Figure S4 (A) Location of seismic stations (orange dots and red triangles) of which data examples are shown in Fig. S5. (B) Velocity-depth model shown in Fig. 4A.
OBS 904 0
1 2 3 4 5 6 7
t-x/6. [s]
20 30 40 50 60
0 1 2 3 4 5 6 7
t-x/6. [s]
20 30 40 50 60
Distance [km]
OBS 904
0 2 4 6 8 10 12 14
Depth [km]
20 30 40 50 60
Distance [km]
(a) (a)
(b)
(c)
Figure S5 Examples of wide-angle seismic data with predicted travel times (color curves), which are computed based on the velocity model presented in Fig. 4A. Black bars denote the traveltime picks. (A) OBS 904, (B) OBS 910, and (C) OBS 913.
1 2 3 4 5 6 7
t-x/6. [s]
10 20 30 40 50
1 2 3 4 5 6 7
t-x/6. [s]
10 20 30 40 50
Distance [km]
OBS 910
0 2 4 6 8 10
Depth [km]
10 20 Distance [km]30 40 50
(a)
(b)
(c)
Figure S5 (continued)
2 3 4 5 6 7 8
t-x/6. [s]
0 10 20 30 40 50
2 3 4 5 6 7 8
t-x/6. [s]
0 10 20 30 40 50
Distance [km]
OBS 913
0 2 4 6 8 10 12 14
Depth [km]
0 10 20Distance [km]30 40 50
OBS 913 (a)
(b)
(c)
Figure S5 (continued)
Fig. S6 shows the final 2-D velocity-depth model and Derivative Weight Sum (DWS), a proxy of the ray density of our velocity model [Korenaga et al., 2000].
0
4
8
12
Depth [km]
0 5 10 15 20 25 30 35 40 45 50 55 60
Distance [km]
0
4
8
12
Depth [km]
0 5 10 15 20 25 30 35 40 45 50 55 60
Distance [km]
1.51 2
2 2.5
2.5
4 4
0
4
8
12
Depth [km]
0 5 10 15 20 25 30 35 40 45 50 55 60
Distance [km]
0
4
8
12
Depth [km]
0 5 10 15 20 25 30 35 40 45 50 55 60
Distance [km]
0 1 2 3 4 5 6 7 8 9 Vp [km/s]
0 500 1000 1500 2000 2500 3000 DWS
(a)
(b)
Figure S6Derivative Weight Sum (DWS) for rays traveling throughout model shown in Fig.
4A using (A) all rays and (B) rays associated to P-waves recorded only by OBH/OBS’s.
4 Critical Wedge Theory Description and main published re- sults used in this paper
The critical wedge theory or non cohesive Coulomb wedge theory corresponds to a first order analytical analysis of the relation between the stress field, shape and fragile internal deformation of a non-consolidated prism or wedge [Davis et al., 1983; Dahlen, 1984; Dahlen et al., 1984].
This model approximates the geometry of the wedge as a triangle defined by constant angles of slope α and basal decollement β. If constant values of the basal friction coefficient µb, internal friction coefficient µ and internal density ρ are considered, the angle α +β is related to the
directions of the principal stresses, and with the principal directions of fracture in the wedge (σ1 and σ3). Dahlen, [1984] developed the analytical solution of this problem considering a non-cohesive wedge. This condition is satisfied well enough to accretionary wedges composed by poor compacted sedimentary material.
σ1 andσ3 are constant for the inner wedge, independent on the scale. If an internal cohesion is considered, it is possible to find approximated solutions with the assumption of small angles α+β <<1 where the principal fracture directions depends on the position in the inner wedge [Dahlen, 1984]. However, it is possible to show that for a model where the internal cohesion is a function linearly increasing with depth and it vanishes at the top of the wedge, there is an exact self-similar analytical solution without restriction for the anglesα andβ [Zao et al., 1986]. The last model can be useful for accretionary prisms with high slope angle formed by sediment that exhibit a compaction gradient.
Fig. S7 shows the solutions of the non-cohesive Coulomb wedge theory that corresponds to an envelope in the α-β domain. It involves compressional and extensional behaviors around a stability zone. Based on this theory, the margins have been classified globally according to their position in theα vs β plot in accretionary margins, erosive margins and non-accretionary margins[Lallemand et al., 1994]. The feasibility of this simple global classification suggests that the detailed analysis of the slope and basal angle is a key tool to the study of the stress condition of the continental wedge and its regional variability in a particular subduction zone.
It is important to note that the critical wedge theory is unable to describe the continuous time variation of the stress-strain field or to make prediction about a specific fault. However, it provides an approximate characterization of the deformation style of the continental wedge resulting from a stable forming process. Thus, it can be considered this model useful for the study of the long term-regional tectonics, but not for the local-short term complexities of the deformation process.
(a)
(b)
non-stable (extensional)
non-stable (compressional)
critical angle of repose
Figure S7 (a) Relation between the wedge geometry (α, β) and the direction of principal internal stresses (σ1, σ3). (b) Rupture envelope of the non-cohesive critical Coulomb wedge theory in the α-β domain (Figure modified from Maksymowicz, [2015])
Maksymowicz et al, [2015]modeled the free-air gravity field of the southern central Chile con- vergent margin along five 2-D profiles that cross the patch of highest slip during the Chilean 2010 megathrust earthquake in order to analyze variability in the density and shape of the continental wedge and its relationship with seismotectonics. They also analyzed the bathymetry to derive the long-term interplate friction coefficient. Fig. S8 shows the location of the modeled profiles, where PG3 and PG5 are coincident with the Mataquito and Reloca segments, respectively. This figure also shows the estimated values derived by applying the Coloumb wedge theory. Results indicate thatµb values are noticeable larger along the Reloca segment than Mataquito segment for the frontal part of the margin. Maksymowicz et al, [2015] also noted that the low taper angles consistent with a low effective basal friction coefficient spatially correlates with the north- ern large coseismic slip area (see Fig. S1) [Moreno et al, 2012]. Similar results were found by Cubas et al, [2013]. We interpret that reduction in the shear yield stress (or critical shear stress required for failure) due to low basal friction coefficients facilitates the concentration of large
coseismic slip during the earthquake.
distance from the deformation front (km)
distance from the deformation front (km)
PG5 PG3
(a) (b)
(c)
after Maksymowicz et al., (2015)
PG3
PG5
Figure S8 (a )Location of the five modeled gravity lines by Maksymowicz et al, [2015]. (b) and (c) Blue numbers correspond to the modeled µb in the case of a wedge characterized by hydrostatic internal pressure. The wedge was divided in three sectors, which were simplified and modeled as independent wedges with constant taper and basal angles (α and β). The values of µb were calculated in the cases of: a dry wedge (λ=0), hydrostatic internal pressure (λ= ρρw
s), and for the parameters observed in Taiwan (λ =0.67, [Dahlen, 1984]). The average densities were extracted from the gravity models, and the values of internal frictionµwere extracted from Barton and Choubey, [1977]. (Figure modified fromMaksymowicz et al., [2015])
References
[1] Dahlen, F. A. (1984), Non-cohesive critical Coulomb wedges: an exact solution, J. Geo-
phys. Res, 89: 10,125-133
[2] Davis, D.M., Suppe, J., Dahlen, F.A., (1983), Mechanics of fold- and thrust belts and accretionary wedges,J. Geophys. Res, 88, 11531172.
[3] Dominguez, S., J. Malavieille, S. E. Lallemand (2000), Deformation of accretionary wedges in response to seamount subduction: Insights from sandbox experiments,Tectonics, doi:10.1029/1999TC900055.
[4] Flueh., E., Bialas, J., (2008), RRS JAMES COOK Cruise Report JC23-A and B, IFM- GEOMAR Report. IFM-GEOMAR, Kiel, Germany, p. 242.
[5] Geersen, J., Voelker, D., Behrmann, J.H., Reichert, C. and Krastel, S. (2011), Pleis- tocene giant slope failures offshore Arauco Peninsula, Southern Chile, J Geol. Soc., 168, 12371248.
[6] Korenaga, J., W. S. Holbrook, G. M. Kent, P. B. Kelemen, R. S. Detrick, H.-C. Larsen, J.
R. Hopper, and T. Dahl-Jensen (2000),Crustal structure of the southeast Greenland mar- gin from joint refraction and reflection seismic tomography,J. Geophys. Res, 104(B3),105, 21,591-21,614.
[7] Kukowski, N., Oncken, O., (2006),Subduction Erosion - the ”Normal” Mode of Fore-Arc Material Transfer along the Chilean Margin?, in: Oncken, O., Chong, G., Franz, G., Giese, P., Gtze, H.-J., Ramos, V.A., Strecker, M.R., Wigger, P. (Eds.), The Andes - Active Subduction Orogeny. Springer, Berlin Heidelberg, pp. 213-232.
[8] Lallemand, S.E., Schnurle, P., Malavieille, J., (1994), Coulomb theory applied to accre- tionary and nonaccretionary wedgespossible causes for tectonic erosion and/or frontal accretion, J. Geophys. Res, 99, 12,03312,055.
[9] Maksymowicz, A., A. Trehu, E. Contreras-Reyes, and S. Ruiz, (2015), Density-depth model of the continental wedge at the maximum slip segment of the Maule Mw8.8 megath- rust earthquake, Earth Planet. Sci. Lett., 409, 265277. doi:10.1016/j.epsl.2014.11.005.
[10] Maksymowicz, A., (2015), The geometry of the Chilean continental wedge:
Tectonic segmentation of subduction processes off Chile,Tectonophysics., doi:
dx.doi.org/10.1016/j.tecto.2015.08.007
[11] Melnick, D., Echtler, H.P., (2006),Inversion of forearc basins in south-central Chile caused by rapid glacial age trench fill,Geology, 34, 709-712, doi: 710.1130/G22440.22441.
[12] Moreno, M., et al., (2012) Toward understanding tectonic control on the Mw 8.8, Maule Chile earthquake, Earth Planet. Sci. Lett., 321, 152165.
[13] Moscoso, E., Grevemeyer, I., Contreras-Reyes, E., Flueh, E.R., Dzierma, Y., Rabbel, W., Thorwart, M., (2011),Revealing the deep structure and rupture plane of the 2010 Maule, Chile earthquake (Mw = 8.8) using wide angle seismic data,Earth Planet. Sci. Lett., 307, 147155. doi:dx.doi.org/10.1016/j.epsl.2011.04.025.
[14] Munoz, P., Lange, C.B., Gutierrez, D., Hebbeln, D., Salamanca, M.A., Dezileau, L., Reyss, J.L., Benninger, L.K., (2004), Recent sedimentation and mass accumulation rates based on 210Pb along the Peru-Chile continental margin, Deep Sea Research., 51, 2523- 2541.
[15] van Avendonk, H. J. A., A. J. Harding, and J. A. Orcutt (1998), A two-dimensional tomographic study of the Clipperton transform fault,J. Geophys. Res, 103, 17,885-17,899.
[16] Voelker, D., Geersen, J., Contreras-Reyes, E., Reichert, C., (2013), Sedimentary fill of the Chile Trench (32oS-46oS): volumetric distribution and causal factors., J. Geological Society, doi:10.1144/jgs2012-1119.
[17] Voelker, D., Weinrebe, W., Behrmann, J.H., Bialas, J., Klaeschen, D., (2009), Mass wasting at the base of the south central Chilean continental margin: the Reloca Slide, Advances in Geoscience, 22, 155-167.
[18] Watts, P., Grilli, S., Kirby, J., Fryer, G., Tappin, D., (2003), Landslide tsunami case studies using a Boussinesq model and a fully nonlinear tsunami generation model, Natural Hazards And Earth System Science, 3, 391-402.
![Fig. S6 shows the final 2-D velocity-depth model and Derivative Weight Sum (DWS), a proxy of the ray density of our velocity model [Korenaga et al., 2000].](https://thumb-eu.123doks.com/thumbv2/1library_info/5351607.1682837/14.892.166.732.297.712/shows-final-velocity-derivative-weight-density-velocity-korenaga.webp)
![Figure S8 (a )Location of the five modeled gravity lines by Maksymowicz et al, [2015]](https://thumb-eu.123doks.com/thumbv2/1library_info/5351607.1682837/17.892.125.869.287.694/figure-s-location-modeled-gravity-lines-maksymowicz-et.webp)
