Tropospheric QBO–ENSO Interactions and Differences between the Atlantic and Pacific
FELICITASHANSEN
GEOMAR Helmholtz Centre for Ocean Research Kiel, Kiel, Germany
KATJAMATTHES
GEOMAR Helmholtz Centre for Ocean Research Kiel, and Christian-Albrechts-Universitat zu Kiel, Kiel, Germany€
SEBASTIANWAHL
GEOMAR Helmholtz Centre for Ocean Research Kiel, Kiel, Germany
(Manuscript received 1 March 2015, in final form 20 November 2015) ABSTRACT
This study investigates the interaction of the quasi-biennial oscillation (QBO) and the El Niño–Southern Oscillation (ENSO) in the troposphere separately for the North Pacific and North Atlantic region. Three 145-yr model simulations with NCAR’s Community Earth System Model Whole Atmosphere Community Climate Model (CESM-WACCM) are analyzed where only natural (no anthropogenic) forcings are considered. These long simulations allow the authors to obtain statistically reliable results from an exceptional large number of cases for each combination of the QBO (westerly and easterly) and ENSO phases (El Niño and La Niña). Two different analysis methods were applied to investigate where nonlinearity might play a role in QBO–ENSO interactions. The analyses reveal that the stratospheric equatorial QBO anomalies extend down to the tropo- sphere over the North Pacific during Northern Hemisphere winter only during La Niña and not during El Niño events. The Aleutian low is deepened during QBO westerly (QBOW) as compared to QBO easterly (QBOE) conditions, and the North Pacific subtropical jet is shifted northward during La Niña. In the North Atlantic, the interaction of QBOW with La Niña conditions (QBOE with El Niño) results in a positive (negative) North Atlantic Oscillation (NAO) pattern. For both regions, nonlinear interactions between the QBO and ENSO might play a role. The results provide the potential to enhance the skill of tropospheric seasonal predictions in the North Atlantic and North Pacific region.
1. Introduction
The quasi-biennial oscillation (QBO) is the domi- nant mode of variability in the equatorial lower to upper stratosphere (Baldwin et al. 2001). It appears as alternating westerly and easterly wind regimes that propagate downward with an average period of 28 months. By influencing the propagation of plane- tary waves and their interaction with the mean flow at mid- and high latitudes, the tropical QBO affects the mean state and variability in the extratropical and even the polar stratosphere. A colder and more stable
stratospheric polar vortex is observed during its west- erly phase (QBOW) and a warmer, more disturbed polar vortex is observed during its easterly phase (QBOE; Holton and Tan 1980, 1982; Anstey and Shepherd 2014).
Although the QBO is primarily a stratospheric phe- nomenon, there are at least two ways in which it can affect the troposphere: 1) directly in the tropics and extratropics, by modifying properties like, for example, convection (Collimore et al. 2003) or vertical wind shear along the tropopause (Gray et al. 1992), which are im- portant for stratosphere–troposphere exchange; or 2) indirectly through its effect on the stratospheric polar vortex; at the poles, stratospheric anomalies can prop- agate down and affect extratropical surface weather and climate. This stratosphere–troposphere coupling mech- anism occurs irrespective of any QBO influence on the
Corresponding author address: Felicitas Hansen, GEOMAR Helmholtz Centre for Ocean Research Kiel, Düsternbrooker Weg 20, 24105 Kiel, Germany.
E-mail: fhansen@geomar.de
15 FEBRUARY2016 H A N S E N E T A L . 1353
DOI: 10.1175/JCLI-D-15-0164.1 Ó2016 American Meteorological Society
stratospheric polar vortex, which is why point 2 is con- sidered an indirect QBO effect on the troposphere.
It might be natural to assume that the QBO has an effect on the tropical troposphere, bearing in mind the dominance of the oscillation for the variability in the overlying stratosphere. It has been shown that the trop- ical troposphere has its own biennial or quasi-biennial oscillation (Meehl 1987,1993), which is often referred to as the tropical or tropospheric biennial oscillation (TBO;
Meehl 1997). The TBO is irregular in time and asym- metric in longitude (Xu 1992; Chang and Li 2000;
Baldwin et al. 2001). Several studies linked the TBO to the Southern Oscillation (e.g.,Berlage 1955;van Loon and Madden 1981;Meehl 1987;Kiladis and van Loon 1988;Ropelewski et al. 1992) and the Asian monsoon (e.g., Lau 1992; Meehl 1997; Loschnigg et al. 2003).
However, no linear correlation exists with the strato- spheric QBO (Barnett 1991; Xu 1992). Nonlinear or multivariate relationships between the two oscillations have been investigated (e.g.,Maruyama and Tsuneoka 1988;Kwan and Abu Samah 2003;Taguchi 2010;Huang et al. 2012), but no consensus has been reached so far.
Notwithstanding the possibility of a QBO–TBO con- nection, the QBO has been shown to influence the tropical and subtropical troposphere. Through the QBO modulation of temperature and vertical wind shear along the tropical tropopause (Gray et al. 1992;Huang et al. 2012), stronger tropical deep convection (Gray et al. 1992;Collimore et al. 2003) and a stronger Hadley circulation (Rind and Balachandran 1995; Hitchman and Huesmann 2009) is observed during QBOE com- pared to QBOW conditions. It has been found that the tropospheric subtropical jet is weakened during QBOE compared to QBOW conditions, especially in the North Pacific region (Garfinkel and Hartmann 2011a,b). Other tropical and subtropical phenomena are thereby af- fected as well like (e.g., hurricanes in the tropical At- lantic that have been shown to occur significantly more often during QBOW conditions and vice versa) (e.g., Shapiro 1989). However, Camargo and Sobel (2010) reported that this relationship has not been present since the 1990s. In the western North Pacific, the tracks (though not the number) of tropical cyclones depend on the QBO phase (Ho et al. 2009). The boreal summer monsoon is also influenced significantly by the phase of the QBO (e.g., Giorgetta et al. 1999). Fadnavis et al.
(2011) found a dependence of cyclones in the Bay of Bengal on the QBO, which occur more often during QBOE conditions and change their tracks depending on the QBO and monsoon phases. Seo et al. (2013) re- ported that the spring rainband over eastern China and the Japanese islands is located farther south during QBOW than during QBOE conditions.
At high latitudes, the QBO signal at the surface re- sembles an AO/NAO pattern. This has some implica- tions for midlatitude surface weather (e.g., over Europe).
During QBOE conditions, the mean surface tempera- tures are below normal and the frequency of winter cold spells increases (Marshall and Scaife 2009).
In this study, we investigate the influence of the stratospheric QBO on the troposphere, and how the tropospheric QBO signal interacts with the El Niño–
Southern Oscillation (ENSO). ENSO is the dominant mode of global sea surface temperature (SST) variabil- ity (Trenberth 1997). It consists of a seesaw between warm and cold SST anomalies in the equatorial Pacific, but influences both the regional and global weather and climate via a number of teleconnections. The strongest ENSO effects can be observed in the troposphere, but its effects on the stratosphere, especially on the polar re- gions during winter, are also well pronounced. During the ENSO warm phase (El Niño), a significantly warmer stratospheric polar vortex occurs, as shown in observa- tional studies (e.g.,van Loon and Labitzke 1987;Camp and Tung 2007;Garfinkel and Hartmann 2008;Mitchell et al. 2011) and confirmed in model studies (e.g.,Sassi et al. 2004;Manzini et al. 2006;Taguchi and Hartmann 2006;Ayarzagüena et al. 2013). Manzini et al. (2006), Garfinkel and Hartmann (2008), andAyarzagüena et al.
(2013) suggested that the Aleutian low is deepened during El Niño events, which enhances the forcing and vertical propagation of planetary waves from the tro- posphere into the stratosphere, resulting in a weaker and warmer stratospheric polar vortex. This in turn in- fluences the frequency of stratospheric sudden warmings (SSWs), which are extreme events of an anomalously weak stratospheric polar vortex. Altogether, there seems to be a tropospheric (via tropospheric teleconnections) and a stratospheric (via SSWs) pathway of ENSO influ- encing the troposphere as recently suggested from re- analysis data byButler et al. (2014).
By influencing the same regions as described for the QBO above like the tropical/subtropical troposphere and the polar stratosphere, it is likely that ENSO also has an effect on the QBO signals in both the strato- sphere and the troposphere. Taguchi (2010) used ra- diosonde data to investigate the dependence of the QBO amplitude and period at the equator on ENSO warm and cold phases. He observed that the QBO am- plitude is significantly weaker during El Niño than during La Niña events, and that the QBO period is longer during La Niña and shorter during El Niño.Yuan et al. (2014)recently confirmed these results, also using radiosonde data, and demonstrated the zonal symmetry of ENSO’s influence on the equatorial QBO along the tropopause.
Some studies investigated the ENSO influence on the QBO signal and vice versa with a focus on the strato- spheric polar night jet region.Wei et al. (2007)analyzed reanalysis atmospheric data and reconstructed ocean data and found that the QBO response in the Northern Hemisphere (NH) wintertime stratospheric polar vor- tex is significant during La Niña, but much weaker during El Niño, because the QBO modulation of plan- etary wave propagation is only significant during La Niña.Garfinkel and Hartmann (2007)investigated dif- ferent combinations of both ENSO with both QBO phases in reanalysis data and found that ENSO has an effect on NH polar stratospheric temperatures during QBOW, but not during QBOE conditions. Another outcome of their study is that during either El Niño or QBOE, the influence of the other factor on the polar vortex is weakened, suggesting a nonlinear interaction of both phenomena.Calvo et al. (2009)confirmed this nonlinear behavior between QBOE and El Niño con- ditions in their model study. They also suggested that El Niño intensifies (weakens) the QBO polar vortex re- sponse in early (late) winter. This has direct implications for the duration of the QBO signal in the NH polar stratosphere and the speed of the downward propaga- tion of the signal.
Most of the studies that investigate the QBO influence on the troposphere do not take into account ENSO as an additional altering factor, mainly because the observa- tional data used in these studies are too short to distin- guish in a statistically reasonable way between all the different combinations of QBO and ENSO phases.
However, knowledge about the interaction between QBO and ENSO signals in the troposphere is important (e.g., for improved tropospheric weather predictions).
The QBO itself has been shown to be predictable up to three years in advance (Scaife et al. 2014) and can po- tentially add skill to forecasts on different time scales (Boer and Hamilton 2008;Tripathi et al. 2015).
Garfinkel and Hartmann (2010) analyzed in re- analysis and model data how the QBO affects El Niño teleconnections in the North Pacific during NH winter.
They found that these teleconnections are weaker during QBOE compared to QBOW and argued that this is partly due to QBO modifications of a Rossby wave train propagating out of the tropics. However, Garfinkel and Hartmann (2010)did not discuss a pos- sible QBO impact on La Niña, mainly because their linearized barotropic model used in order to identify the mechanism by which El Niño teleconnections are altered was incapable of distinguishing between El Niño and La Niña. In this study, we investigate the combined QBO–ENSO effect in the troposphere and include both QBO and both ENSO phases. We focus on
the NH winter and examine the tropospheric QBO–
ENSO interaction separately for the North Pacific and the North Atlantic since the tropospheric QBO signal has been shown to be hidden when zonally averaged fields are investigated (Garfinkel and Hartmann 2011a).
For this we use three long (145 years) simulations of NCAR’s Community Earth System Model Whole Atmosphere Community Climate Model (CESM- WACCM) where anthropogenic greenhouse gas forc- ings were set to constant 1960 conditions to investigate the combined tropospheric QBO–ENSO effect without any anthropogenic factors. Switching off the anthro- pogenic influence in the model simulations allows us to focus on the QBO or ENSO signals and to investigate them in the presence of natural and internal variability.
The length of the model simulations allows us to ana- lyze composites of each of the QBO–ENSO combina- tions with enough cases to obtain statistically robust signals. By comparing CESM-WACCM simulations where either the QBO or ENSO has been switched off, we address the question of the nonlinearity of the QBO–ENSO interaction.
This paper is organized as follows:section 2abriefly describes NCAR’s CESM-WACCM model and the simulations analyzed in this study.Section 2bexplains how the composites for QBO and ENSO phases are computed. Section 3 deals with the identification of a QBO signal in zonal mean zonal wind and how this in- teracts with ENSO, followed by the analysis of the combined QBO–ENSO signals in some tropospheric and surface parameters in section 4. A brief in- vestigation on the (non)linearity of the QBO–ENSO interaction follows in section 5. Finally, the main out- comes are summarized and discussed insection 6.
2. Model and methods description a. Model setup and simulations
The model simulations analyzed in this study were performed with the NCAR CESM-WACCM, version 1.0.2. CESM is a state-of-the-art coupled model system, containing an interactive ocean, land, sea ice, and at- mosphere component. The atmosphere component used here is WACCM, version 4, a fully interactive chemistry-climate model, extending on 66 vertical levels from the earth’s surface to ;140-km altitude (Garcia et al. 2007;Richter et al. 2010). WACCM is run on a horizontal grid of 1.98 32.58(latitude3longitude); the interactive ocean and sea ice components are run on a 18 3 18triangular horizontal grid and are described in Holland et al. (2012)andDanabasoglu et al. (2012). As the WACCM version used here does not generate the
15 FEBRUARY2016 H A N S E N E T A L . 1355
QBO internally, stratospheric zonal winds are relaxed toward observations between 228S/N as described in Matthes et al. (2010)andHansen et al. (2013). Note that the amplitude of ENSO is overestimated compared to observations with the peak amplitude of the Niño-3.4 index being approximately twice that of the observed amplitude (Marsh et al. 2013).
The experiments analyzed in this study correspond to the ‘‘NATURAL,’’ ‘‘Fixed SSTs,’’ and ‘‘NOQBO’’ ex- periments described in Hansen et al. (2014). Unless otherwise stated, the results presented in the following are obtained from the NATURAL simulation, a 145-yr model run (1955–2099) where only natural but no an- thropogenic factors are considered. This is done by setting anthropogenic greenhouse gases and ozone- depleting substances to constant 1960 conditions. The solar cycle is prescribed as spectrally resolved daily variations followingLean et al. (2005); for the twenty- first century, the last four solar cycles before 2005 are repeated. Observed volcanic eruptions of the twentieth century are included.
The Fixed SSTs and NOQBO simulations are used to give an estimate of how much of a combined tropo- spheric QBO–ENSO signal comes from either linear or nonlinear interactions. Both simulations have been ex- tended since Hansen et al. (2014) and now span the period 1955–2099. The Fixed SSTs experiment uses the climatological annual cycle from the NATURAL ex- periment for the underlying SST and sea ice forcing, and repeats this forcing for each of the simulated years.
For the NOQBO simulation, the equatorial QBO nudging is switched off, which leads to relatively con- stant but weak easterlies in the equatorial stratosphere of about210 m s21. All other settings in these two ex- periments are equivalent to the NATURAL simulation.
b. Methods
1) COMPOSITES OFQBOANDENSOPHASES
In the following analysis, we compute composites of anomalies of different parameters for QBO and ENSO phases separately, as well as for combinations of QBO and ENSO phases together. Anomalies are computed with respect to the climatology. A month is defined as being in the westerly QBO phase (QBOW), when the zonal mean zonal wind averaged between 2.88S/N and between 40 and 50 hPa exceeds 5 m s21 during that month. An easterly QBO phase (QBOE) occurs, when this wind average falls below 22.5 m s21. The ENSO phases are defined via the Niño-3.4 index as in Trenberth (1997): if the 5-month running mean of SST anomalies in the Niño-3.4 region (58N–58S, 1708– 1208W) exceeds 0.48C (falls below 20.48C) for at
least 6 consecutive months, an El Niño (La Niña) phase occurs.
The anomalies investigated here are strongest during the NH winter season during November–February (NDJF), and therefore we show 4-month averages in the following. The NDJF average is representative for the NH winter signal. Including several months in- creases the number of cases for the respective phases in the composites, leading to statistically more reliable signals. Statistical significance has been tested with a two-sidedttest, and colors in the following composite figures denote that the anomalies are significantly dif- ferent from the climatology at the 95% confidence interval.
Some of the following composites show zonally av- eraged anomalies, which, unless otherwise stated, refers to anomalies averaged over all longitudes. However, as some of the investigated signals are zonally asymmetric, we distinguish between different longitudinal sectors as well. The Atlantic sector is defined between 108 and 508W, and the Pacific sector between 1608E and 1608W.
The longitudes for the sectors have been chosen fol- lowingGarfinkel and Hartmann (2011a). Sensitivity of the results to this choice has been tested, and deviations from the presented results for a different selection of longitudes will be mentioned in the following wherever they occur.
2) MULTIPLE LINEAR REGRESSION
Insection 5we address the question in which altitudes and regions the combined QBO–ENSO signal might result from nonlinear interactions between the two phenomena. To do this, we estimate a parameter (e.g., zonal mean zonal wind) by a linear regression model with two linear terms of the QBO and ENSO and an additional interaction term:
U(x,t)5a(x)3QBO(t)1b(x)3ENSO(t) 1c(x)3QBO(t)3ENSO(t)1d(x,t).
Here,U(x,t) is an estimate of the zonal mean zonal wind at grid pointxand at timet; QBO(t) is the time series of the QBO; ENSO(t) is the Niño-3.4 time series;
a(x), b(x), and c(x) are the regression coefficients at grid point x; and d(x,t) is the residuum. We assume that a nonzero regression coefficientc(x) of the QBO–
ENSO interaction term QBO(t)3ENSO(t) indicates nonlinear interaction of the QBO and ENSO for the parameter at that grid pointx, as in a purely linear in- teraction the parameter could be described asU(x,t)5 a(x)3QBO(t)1b(x)3Nino3.4(t)1d(x,t). To test if c(x) is different from zero at grid pointx, a two-sidedttest is applied.
3. QBO and ENSO signals in zonal mean zonal wind
a. Separate effects
We first investigate how the two QBO phases (QBOW and QBOE) and the two ENSO phases (El Niño and La Niña) influence the NH zonal mean zonal wind alone. Therefore, we compute averages of zonal mean zonal wind anomalies during those months where the respective phases occur.Figure 1shows composites of zonal mean zonal wind anomalies for QBOW (Fig. 1a), QBOE (Fig. 1b), La Niña (Fig. 1c), and El Niño (Fig. 1d) averaged for the NH winter season from November to February (NDJF). The number of cases for each of the composites can be read fromTable 1.
Figures 1a and 1bshow the prominent features of the QBO: a ‘‘sandwich’’ structure of statistically significant zonal mean zonal wind anomalies of alternating sign in the tropical to subtropical stratosphere. In the polar stratosphere, the wind speeds in the stratospheric polar night jet are significantly increased during QBOW and significantly decreased during QBOE conditions.
The zonal mean zonal wind anomalies due to the two ENSO phases (Figs. 1c,d) show that the zonal mean
zonal wind is stronger (weaker) than normal in the tropical to midlatitude troposphere and lower strato- sphere during El Niño (La Niña). Around 608N, the zonal mean wind speeds are decreased (increased) during El Niño (La Niña) from the surface to the middle stratosphere. Another significant ENSO signal of the same sign can be found in the midlatitude upper stratosphere/lower mesosphere.
Except for this latter ENSO anomaly, the ENSO re- sponse in zonal mean zonal wind is confined to the tro- posphere, while the zonal mean QBO response is confined to the stratosphere.Garfinkel and Hartmann (2011a) showed in their model study that the tropo- spheric anomalies occurring in connection with the dif- ferent QBO phases are hard to detect when zonally
FIG. 1. Anomalies of the zonal mean zonal wind in NDJF with respect to the NDJF climatology for QBO and ENSO phases in the CESM-WACCM NATURAL experiment. The contour interval is 1 m s21and color shading indicates 90% statistical significance.
TABLE 1. Number of NDJF seasons under QBOW, QBOE, El Niño, and La Niña conditions and combinations of QBO and ENSO phases in the NATURAL experiment.
QBOW QBOE
69 58
El Niño 49 25 20
La Niña 55 26 22
15 FEBRUARY2016 H A N S E N E T A L . 1357
averaged fields are investigated, since the signals are zonally asymmetric and vary strongly between the North Atlantic and North Pacific. We confirm their findings, as can be seen in Figs. 2d–f, where the composite differ- ences of zonal mean zonal wind between QBOW and QBOE in NDJF are shown for the zonal average as well as for sector averages of the Pacific and the Atlantic separately. The climatologies of the zonal mean zonal wind in NDJF averaged over the respective sectors are shown inFigs. 2a–cfor comparison. Only in the North Pacific do the equatorial QBO wind anomalies, which occur in the stratosphere around 50 hPa, arch downward into the subtropical troposphere in a horseshoe-shaped pattern, suggesting a significant influence of the QBO on the subtropical jet in this region (Fig. 2e). Testing this result for sensitivity to the longitudes chosen for the Pacific sector mean reveals that the QBO influence on the Pacific subtropical jet is significant only in the western and central North Pacific and not in the eastern part of the basin (not shown). No significant tropo- spheric QBO influence can be seen in the zonal mean (Fig. 2d) or in the North Atlantic (Fig. 2f), the latter being irrespective of which longitudes are chosen to compute the Atlantic sector mean (not shown).
b. Combined effects
The next step is to analyze the combined QBO–
ENSO signal (i.e., the anomalies that occur when one of the QBO phases exists together with one of the ENSO
phases).Figure 3shows composites of zonal mean zonal wind anomalies during NDJF for the four possible combinations of QBO and ENSO phases. InFig. 3a, the anomaly composite is built from months where the above-mentioned criteria for QBOW and La Niña are met simultaneously, inFig. 3b, the conditions for QBOE and El Niño are fulfilled at the same time, and so on. The number of cases for each of the four combinations can be obtained fromTable 1.
FromFig. 3we can see that the strongest response in the stratospheric polar night jet occurs when either QBOW and La Niña (Fig. 3a) or QBOE and El Niño (Fig. 3b) happen simultaneously. During the other two combinations, the response in this region is very weak.
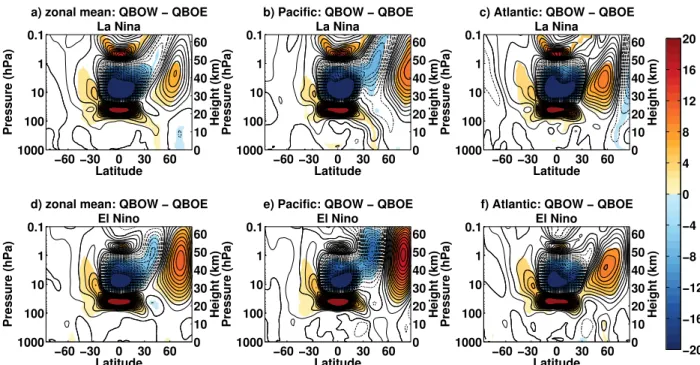
Distinguishing again between the Pacific and Atlantic sector (Fig. 4) reveals that the statistically significant downward arching of the QBO wind signal (i.e., QBOW minus QBOE composite difference) from the equatorial stratosphere into the midlatitude troposphere in the North Pacific sector occurs only during La Niña events (Fig. 4b), but is absent during El Niño events (Fig. 4e).
This combined QBO–La Niña effect can also be ob- served in the zonal average of zonal wind (Fig. 4a) and is independent of the longitude choice for the Pacific sec- tor mean [i.e., it occurs over the whole North Pacific, although weaker in the eastern part (not shown)].
In the North Atlantic sector, it is also a La Niña phase that connects a stratospheric QBO signal with the tro- posphere (Fig. 4c). Here this coupling happens at high
FIG. 2. (a)–(c) Climatologies (contour interval is 5 m s21) and (d)–(f) composite differences of QBOW minus QBOE conditions (contour interval is 1 m s21; color shading indicates 90% statistical significance) for the zonal wind as (a),(d) zonal average; (b),(e) averaged over the Pacific; and (c),(f) averaged over the Atlantic in NDJF in the NATURAL experiment.
latitudes in the central to eastern part of the basin (not shown), where a statistically significant negative QBOW–QBOE anomaly extends from the stratosphere down to the troposphere during La Niña phases. During El Niño phases, significant wind signals in the tropo- sphere over the North Atlantic indicate a northward shift of the midlatitude jet (Fig. 4f). However, these signals are not connected with significant stratospheric signals and hence do not seem to arise as a combined QBO–ENSO effect.
4. Combined QBO–ENSO signals in tropospheric fields
The former analysis of combined QBO–ENSO effects suggests that the QBO influence on the subtropical jet is only significant in the North Pacific sector during La Niña phases. In this section we aim at analyzing in more detail the combined QBO–ENSO signal in several tro- pospheric variables. Figure 5 shows the NH winter season (NDJF) climatology (Fig. 5a) and composite differences for zonal wind at 300 hPa between QBOW and QBOE phases without separating into ENSO phases (Fig. 5d), and considering La Niña (Fig. 5g) and El Niño (Fig. 5j). The westerly subtropical jet is
significantly stronger over the western North Pacific during QBOW compared to QBOE conditions, and its maximum is shifted northward (Fig. 5d). Consistent with the previous findings ofFig. 4, this tropospheric QBO signal is modified in different regions by the two ENSO phases: while La Niña amplifies the significant signal and lets it extend farther eastward over the central and eastern North Pacific (Fig. 5g), no significant wind changes are seen in this region during El Niño (Fig. 5j).
Instead, during El Niño phases, the QBO signal shows statistically significant higher wind speeds during QBOW compared to QBOE conditions over the North Atlantic in the region of the North Atlantic storm track, and significantly lower wind speeds over the central North Atlantic and central Europe (Fig. 5j).
The geopotential height (GPH) at 500 hPa (shown in Figs. 5b,e,h,k), is, without regard to ENSO phase, sig- nificantly lower by up to 25 m during QBOW compared to QBOE conditions in the western North Pacific, ex- tending over the eastern Eurasian continent around 608N (Fig. 5e). As expected from the findings for the winds at 300 hPa, this significant signal is again extended toward the central and eastern North Pacific during La Niña, and more zonally oriented then (Fig. 5h). In ad- dition to the negative GPH anomaly over the North
FIG. 3. As inFig. 1, but for all combinations of QBO phases coinciding with ENSO phases.
15 FEBRUARY2016 H A N S E N E T A L . 1359
Pacific, a positive anomaly over the pole occurs. Again, the influence of El Niño phases appears as a statistically significant signal over the North Atlantic. The GPH is significantly increased by around 20 m south of the North Atlantic storm-track region, while the significant QBO signal in the western North Pacific/eastern Eur- asian continent is almost absent (Fig. 5k). Altogether this combined QBO–El Niño signal resembles the pos- itive phase of the Arctic Oscillation (AO) pattern, as in Fig. 1 ofBaldwin and Dunkerton (1999).
Figure 5kgenerally confirms the results ofGarfinkel and Hartmann (2010)(cf. their Fig. 3) by showing neg- ative GPH anomalies in the North Pacific and positive GPH anomalies south of these during QBOW compared to QBOE under El Niño conditions (i.e., a strengthening of the El Niño teleconnections involving a deepening of the Aleutian low during QBOW compared to QBOE).
However, the anomalies presented here do not show the same statistical significance for the El Niño but instead for the La Niña case, which was not discussed by Garfinkel and Hartmann (2010)but for which they also found the described teleconnection strengthening in the North Pacific during QBOW (C. I. Garfinkel 2015, personal communication).
At the surface, a combined QBO–ENSO signal can also be seen in sea level pressure (SLP) anomalies (Figs. 5c,f,i,l). The QBO signal without regard to ENSO phase (Fig. 5f) shows a significant SLP decrease of up to
2 hPa in the region of the climatological Aleutian low (cf.Fig. 5c) in the northern North Pacific during QBOW compared to QBOE conditions. Two centers of signifi- cant SLP increase during QBOW compared to QBOE conditions can be found over the Barents Sea and northeastern Europe, which extend the climatological high pressure system over Asia. During La Niña phases these regions of significant QBO anomalies are strengthened (Fig. 5i). During El Niño phases the QBO surface signal in the North Pacific is absent like at higher altitudes for the GPH and the zonal wind (Fig. 5l).
Instead, a new statistically significant combined QBO–
ENSO signal establishes in the North Atlantic during El Niño phases, which projects onto the positive phase of the North Atlantic Oscillation (NAO) (Fig. 5l). Statis- tically significant positive SLP anomalies of more than 1.5 hPa can be found southeast of Newfoundland and over northeastern Europe.
From Fig. 6, we can obtain some additional in- formation about the interaction of the single QBO phases with the single ENSO phases by looking at GPH anomaly composites for the four possible combinations separately. For the North Pacific, we learn fromFig. 6d that it is the combined occurrence of QBOE and La Niña phases that has the strongest effect on this region.
The occurring significant positive GPH anomalies ex- tend over the eastern Eurasian continent, while the significant anomalies are restricted to the North Pacific
FIG. 4. Composite differences of QBOW minus QBOE conditions coinciding with (a)–(c) La Niña and (d)–(f) El Niño for the zonal wind as (a),(d) zonal average; (b),(e) averaged over the Pacific; and (c),(f) averaged over the Atlantic in NDJF in the NATURAL experiment. The contour interval is 1 m s21and color shading indicates 90% statistical significance.
FIG. 5. (a)–(c) Climatologies and (d)–(l) composite differences of QBOW minus QBOE conditions coinciding with ENSO phases for the zonal wind at (a),(d),(g),(j) 300 hPa (contour interval is 5 m s21for the climatology and 0.5 m s21for the composite differences);
(b),(e),(h),(k) geopotential height at 500 hPa (contour interval is 50 m/5 m); and (c),(f),(i),(l) sea level pressure (contour interval is 5 hPa/
0.3 hPa) in NDJF in the NATURAL experiment. In (d)–(l) the color shading indicates 90% statistical significance.
15 FEBRUARY2016 H A N S E N E T A L . 1361
basin for the other combinations. Over the North At- lantic, the strongest and zonally most extended GPH anomalies seem to occur when QBOE and El Niño phases occur simultaneously (Fig. 6b). This combination and also the combination of QBOW with La Niña events (Fig. 6a) during winter lead to a significant effect on parts of Europe, where the latter might at first be con- tradictory to the results fromFig. 5where it was stated that only in combination with El Niño (and not with La Niña) the QBO has a significant effect on the North Atlantic. The conclusion fromFig. 6ais that the positive GPH anomalies over Europe during QBOW/La Niña winters are statistically significant from the winter cli- matology, but the conclusion fromFig. 5his that these anomalies are virtually not significant from the response in QBOE/La Niña winters. Knowledge about this can be very useful for tropospheric weather prediction over the
North Atlantic region and Europe where a significant influence on GPH has direct implications (e.g., for the strength and tracks of extratropical cyclones and, hence, for primary meteorological parameters like wind, tem- perature, and precipitation).
5. Nonlinear signals
As a last point in this study, we want to briefly analyze how much of the signal interpreted as a combined QBO–ENSO signal might result from a linear or non- linear superposition of the two phenomena. For this, we use the ‘‘NOQBO’’ and ‘‘FixedSST’’ simulations where the QBO and SST variability are switched off, re- spectively, as described insection 2a.
As a first attempt to address and quantify possible nonlinear interactions, we compute QBOW and QBOE
FIG. 6. Anomalies of geopotential height at 500 hPa in NDJF with respect to the NDJF climatology for all four combinations of QBO and ENSO phases in the NATURAL experiment. The contour interval is 5 m and color shading indicates 90% statistical significance.
anomalies of the zonal mean zonal wind in NDJF with respect to NDJF climatology as was done forFigs. 1a and 1b, but this time from the FixedSST simulation. As year-to-year variability of SSTs is not included in this experiment and hence no ENSO, we can interpret these anomalies as ‘‘pure’’ QBO signals unaffected by any ENSO signals. Furthermore, we compute El Niño and La Niña NDJF anomalies of the zonal mean zonal wind as inFigs. 1c and 1d, but from the NOQBO simulation.
We then obtain combined linear QBO–ENSO signals by adding the anomalies from single phases; for example, a combined QBOW–El Niño anomaly is computed by adding the QBOW anomaly (from the FixedSST simu- lation) and the El Niño anomaly (from the NOQBO simulation). The whole procedure is done separately for sector averages over the North Pacific and North At- lantic. Comparing these linear QBO–ENSO interaction signals with the respective signals from the NATURAL simulation (of which zonal averages are shown in Fig. 3and described in section 3b) can suggest where nonlinear interactions between QBO and ENSO play a role. Figures 7 and 8 show differences between
the linearly combined QBO–ENSO signals from the FixedSST1NOQBO simulations and the combined QBO–ENSO signal from the NATURAL simulation for the Pacific and the Atlantic sector, respectively. In the North Pacific, Figs. 7a and 7b suggest nonlinear processes in the troposphere between 308and 608N (i.e., in the region of the subtropical jet) during the combined occurrence of QBOW with La Niña as well as QBOE with El Niño where significant differences between lin- ear and nonlinear anomalies occur. The nonlinear in- teraction potentially taking place during QBOE/El Niño winters, however, does not lead to an influence onto the North Pacific which differs significantly from the (linear, as suggested in Fig. 7c) combined QBOW/El Niño in- fluence onto this region as we found earlier (cf.Fig. 4e).
In the Atlantic sector (Fig. 8), nonlinear QBO–ENSO interactions in the NH troposphere are not suggested by this analysis; only marginal hints of them might be found in the combination of QBOE with La Niña (Fig. 8d).
Furthermore, nonlinearity might play a role in both the Pacific and Atlantic equatorial stratosphere when either QBOW or QBOE phases occur contemporaneously
FIG. 7. Differences between the sum of single QBO and ENSO Pacific sector mean zonal wind anomalies from FixedSSTs and NOQBO simulation [as inFig. 1(zonal mean) for the NATURAL simulation] and respective combined QBO–ENSO anomalies from NATURAL simulation [Fig. 3(zonal mean); e.g., (a) (QBOW anomaly1 La Niña anomaly) minus combined QBOW/La Niña anomaly]. The contour interval is 0.5 m s21and color shading indicates 95% statistical significance.
15 FEBRUARY2016 H A N S E N E T A L . 1363
with an El Niño phase (Figs. 7 and 8b,c). This is the region where nudging of the zonal wind is applied in the NATURAL and FixedSST simulations, hence, the dif- ferences interpreted here are induced by physical processes.
Another attempt to address nonlinearities in the QBO–ENSO interaction is made by performing a mul- tiple linear regression as described insection 2and an- alyzing the regression coefficient of the QBO–ENSO interaction term. This regression coefficient for the re- gression of QBO and ENSO on the zonal mean zonal wind is shown inFigs. 9a and 9bfor the sector means of the Pacific and Atlantic, respectively. Statistically sig- nificant nonzero regression coefficients can be found in the troposphere in the North Pacific around 608N (Fig. 9a), which was also suggested by the first method and seen in the combined effect of QBOW with El Niño as well as QBOE with El Niño (Figs. 7a,b). The same support can be given for the suggestion of nonlinearities in the equatorial stratosphere around 10 hPa in both the Pacific and Atlantic sectors. For the North Atlantic (Fig. 9b), the regression analysis additionally suggests that nonlinear processes might play a role in the tropo- sphere, mainly around 308–408N, which was not found via the first method described above. Where the
different suggestions about nonlinearity in QBO–ENSO interactions obtained from the two methods applied come from needs to be clarified in future studies.
As a last step, we analyze the regression coefficient of the QBO–ENSO interaction term for the regression of QBO and ENSO on the GPH field at 500 hPa (Fig. 9c).
This analysis also proposes nonlinear QBO–ENSO in- teraction over the North Atlantic comparable toFig. 9b, around 458N. Another (though considerably more re- gionally constricted) region of possible nonlinear pro- cesses in the QBO–ENSO interaction is suggested in the northwestern North Pacific. This significant regression coefficient in the North Pacific confirms the findings discussed earlier in this section.
Other factors might, of course, contribute to the sig- nals interpreted here as nonlinear QBO–ENSO signals as well. Possible contributors could be the solar cycle or volcanic eruptions. However, identifying these addi- tional sources is beyond the scope of this paper.
6. Summary and discussion
In this study, we used three long (145 years) simula- tions of the coupled model system CESM-WACCM to investigate the influence of the stratospheric QBO on
FIG. 8. As inFig. 7, but for the Atlantic sector mean.
the troposphere, and how this interacts with tropo- spheric ENSO signals. For the simulations, only natural (no anthropogenic) forcings were considered, allowing us to detect QBO and ENSO signals unmasked from any anthropogenic influence. QBO signals in several pa- rameters were analyzed with and without considering ENSO phases. The length of our simulations allowed us to create enough cases for each of the QBO–ENSO combinations to obtain statistically robust results. In our analysis, we distinguished between zonal mean QBO–
ENSO responses (meaning the average over all longi- tudes) as well as separate sector mean responses in the North Pacific and the North Atlantic region. In a last step, we applied two different methods to investigate in which regions nonlinear QBO–ENSO interactions might play a role.
Our analysis revealed the following:
d The stratospheric equatorial QBO anomalies extend down to the troposphere over the North Pacific region, but only during La Niña and not during El Niño phases. The Aleutian low is deepened during QBOW compared to QBOE conditions in La Niña winters, and the subtropical jet is stronger and shifted north- ward. Our analysis suggests that this might be due to nonlinear interactions between the QBO and ENSO.
d In the North Atlantic, the combination of QBOW with La Niña (QBOE with El Niño) establishes a positive (negative) NAO pattern. The other two combinations counteract the general North Atlantic ENSO signals.
Nonlinear QBO–ENSO interactions might occur in this region.
d In the stratospheric polar night jet, the strongest responses can be observed during the combined occurrences of the westerly QBO phase (QBOW) with the cold ENSO phase (La Niña) and of the easterly QBO phase (QBOE) with the warm ENSO phase (El Niño). During the other two combinations, the response in this region is very weak.
Following the original QBO definition byHolton and Tan (1980,1982), we defined the QBO time series based on zonal winds between 40 and 50 hPa in the equatorial stratosphere. Most of the results presented in this study are insensitive to this choice of levels, like the downward extension of the stratospheric QBO signal to the tro- posphere over the North Pacific, which leads to a northward shift of the subtropical jet during QBOW compared to QBOE in NH winter. However, this signal does not only occur in the central North Pacific during La Niña phases, but also in the western North Pacific during El Niño phases when the QBO is defined around
FIG. 9. Regression coefficients of the interaction term (QBO3ENSO) onto (a),(b) the Pacific sector and Atlantic sector mean zonal wind (contour interval is 0.01) and (c) geopotential height at 500 hPa (contour interval is 0.05).
Color shading indicates 95% statistical significance.
15 FEBRUARY2016 H A N S E N E T A L . 1365
70 hPa instead, as has been done, for example, by Garfinkel and Hartmann (2010,2011a). The amplitude of the QBO at this level in the lowermost stratosphere is considerably weaker than at higher levels. Defining the QBO there additionally reveals a significant QBO in- fluence during La Niña phases on western and central Europe that appears with a center of positive SLP anomalies in this region during QBOW compared to QBOE (not shown). These findings indicate a seasonal dependence of the combined QBO–ENSO signals in the troposphere as varying the heights to define the QBO implicates analyzing lagged responses; the winter QBO signal at 70 hPa roughly corresponds to the autumn QBO at 40–50 hPa.
With our methods used to investigate potential non- linear interaction of QBO and ENSO signals we did not see any evidence for nonlinearity in the NH polar stratosphere as reported by Calvo et al. (2009). Our analysis focused on winter means from November to February whileCalvo et al. (2009)investigated the sea- sonal evolution during winter. If we apply our methods to the single winter months separately, the results sug- gest nonlinear behavior in the stratospheric polar vortex region in January and weaker in February when QBOW phases occur together with El Niño events. In contrast, Calvo et al. (2009) reported nonlinear interaction of QBOE phases with El Niño events in late winter. The underlying mechanisms still remain unclear, and more studies are needed to help solve these questions.
Our findings highlight the importance of stratospheric processes, in this case the QBO, for a better un- derstanding of tropospheric dynamics. Knowledge about how the individual QBO phases act together with the individual ENSO phases in different regions and particular seasons can enhance the skill of tropospheric seasonal predictions. The results obtained in our study can be applied to the prediction of meteorologically interesting regions: the North Pacific and North Atlantic storm tracks. Extratropical cyclones which travel along the North Atlantic storm track are important phenom- ena especially for Europe, as they transport heat, moisture, and momentum and, thus, influence primary meteorological parameters like temperature and pre- cipitation. Hence, improved predictions of these phe- nomena can be of great value.
Our study did not explicitly consider other factors that might contribute to or favor the nonlinear QBO–ENSO signal. These other factors could be the solar cycle or vol- canic eruptions. Their identification and a more detailed analysis on the dynamics of the combined QBO–ENSO signals should be the focus of future studies. Further anal- ysis is also needed to confirm our findings about the regions in which the QBO–ENSO signal could be nonlinear.
Acknowledgments. This work has been performed within the Helmholtz-University Young Investigators Group NATHAN funded by the Helmholtz-Association through the President’s Initiative and Networking Fund and the Helmholtz Centre for Ocean Research Kiel (GEOMAR). The CESM-WACCM simulations have been performed at the Deutsche Klimarechenzentrum (DKRZ), Hamburg, Germany. The authors thank Chaim Garfinkel and two anonymous reviewers for numerous comments and suggestions that helped to improve the manuscript considerably, and Tim Kruschke for valuable discussions on the manuscript.
REFERENCES
Anstey, J. A., and T. G. Shepherd, 2014: High-latitude influence of the quasi-biennial oscillation.Quart. J. Roy. Meteor. Soc.,140, 1–21, doi:10.1002/qj.2132.
Ayarzagüena, B., U. Langematz, S. Meul, S. Oberländer, J. Abalichin, and A. Kubin, 2013: The role of climate change and ozone recovery for the future timing of Major Strato- spheric Warmings. Geophys. Res. Lett., 40, 2460–2465, doi:10.1002/grl.50477.
Baldwin, M. P., and T. J. Dunkerton, 1999: Propagation of the Arctic Oscillation from the stratosphere to the troposphere.J. Geophys.
Res.,104, 30 937–30 946, doi:10.1029/1999JD900445.
——, and Coauthors, 2001: The quasi-biennial oscillation. Rev.
Geophys.,39, 179–229, doi:10.1029/1999RG000073.
Barnett, T. P., 1991: The interaction of multiple time scales in the tropical climate system.J. Climate,4, 269–285, doi:10.1175/
1520-0442(1991)004,0269:TIOMTS.2.0.CO;2.
Berlage, H. P., 1955: The Southern Oscillation—A 2–3 year fun- damental oscillation of world-wide significance. Scientific Proc. Int. Association of Meteorology I.U.G.G. 10th General Assembly, Rome, Italy, I.U.G.G., 336–345.
Boer, G. J., and K. Hamilton, 2008: QBO influence on extratropical predictive skill. Climate Dyn., 31, 987–1000, doi:10.1007/
s00382-008-0379-5.
Butler, A. H., L. M. Polvani, and C. Deser, 2014: Separating the stratospheric and tropospheric pathways of El Niño–Southern Oscillation teleconnections. Environ. Res. Lett., 9, 024014, doi:10.1088/1748-9326/9/2/024014.
Calvo, N., M. A. Giorgetta, R. Garcia-Herrera, and E. Manzini, 2009: Nonlinearity of the combined warm ENSO and QBO ef- fects on the Northern Hemisphere polar vortex in MAECHAM5 simulations. J. Geophys. Res., 114, D13109, doi:10.1029/
2008JD011445.
Camargo, S. J., and A. H. Sobel, 2010: Revisiting the influence of the quasi-biennial oscillation on tropical cyclone activity.
J. Climate,23, 5810–5825, doi:10.1175/2010JCLI3575.1.
Camp, C. D., and K. K. Tung, 2007: Stratospheric polar warming by ENSO in winter: A statistical study.Geophys. Res. Lett.,34, L04809, doi:10.1029/2006GL028521.
Chang, C. P., and T. Li, 2000: A theory for the tropical tropospheric biennial oscillation.J. Atmos. Sci.,57, 2209–2224, doi:10.1175/
1520-0469(2000)057,2209:ATFTTT.2.0.CO;2.
Collimore, C. C., D. W. Martin, M. H. Hitchman, A. Huesmann, and D. E. Waliser, 2003: On the relationship between the QBO and tropical deep convection.J. Climate,16, 2552–2568, doi:10.1175/1520-0442(2003)016,2552:OTRBTQ.2.0.CO;2.
Danabasoglu, G., S. C. Bates, B. P. Briegleb, S. R. Jayne, M. Jochum, W. G. Large, S. Peacock, and S. G. Yeager, 2012:
The CCSM4 ocean component.J. Climate, 25, 1361–1389, doi:10.1175/JCLI-D-11-00091.1.
Fadnavis, S., T. Chakraborty, S. D. Ghude, G. Beig, and P. E. Raj, 2011: Modulation of cyclone tracks in the Bay of Bengal by QBO.J. Atmos. Sol.-Terr. Phy.,73, 1868–1875, doi:10.1016/
j.jastp.2011.04.014.
Garcia, R. R., D. R. Marsh, D. E. Kinnison, B. A. Boville, and F. Sassi, 2007: Simulation of secular trends in the middle at- mosphere, 1950–2003. J. Geophys. Res., 112, D09301, doi:10.1029/2006JD007485.
Garfinkel, C. I., and D. L. Hartmann, 2007: Effects of the El Niño–
Southern Oscillation and the quasi-biennial oscillation on polar temperatures in the stratosphere.J. Geophys. Res.,112, D19112, doi:10.1029/2007JD008481.
——, and ——, 2008: Different ENSO teleconnections and their effects on the stratospheric polar vortex.J. Geophys. Res.,113, D18114, doi:10.1029/2008JD009920.
——, and ——, 2010: Influence of the quasi-biennial oscillation on the North Pacific and El Niño teleconnections.J. Geophys.
Res.,115, D20116, doi:10.1029/2010JD014181.
——, and ——, 2011a: The influence of the quasi-biennial oscilla- tion on the troposphere in winter in a hierarchy of models. Part I: Simplified dry GCMs. J. Atmos. Sci., 68, 1273–1289, doi:10.1175/2011JAS3665.1.
——, and ——, 2011b: The influence of the quasi-biennial oscilla- tion on the troposphere in winter in a hierarchy of models. Part II:
Perpetual winter WACCM runs.J. Atmos. Sci.,68, 2026–2041, doi:10.1175/2011JAS3702.1.
Giorgetta, M. A., L. Bengtsson, and K. Arpe, 1999: An in- vestigation of QBO signals in the East Asian and Indian monsoon in GCM experiments.Climate Dyn.,15, 435–450, doi:10.1007/s003820050292.
Gray, W. M., J. D. Sheaffer, and J. A. Knaff, 1992: Influence of the stratospheric QBO on ENSO variability.J. Meteor. Soc. Ja- pan,70, 975–995.
Hansen, F., K. Matthes, and L. J. Gray, 2013: Sensitivity of stratospheric dynamics and chemistry to QBO nudging width in the chemistry–climate model WACCM.J. Geophys. Res.
Atmos.,118, 10 464–10 474, doi:10.1002/jgrd.50812.
——, ——, C. Petrick, and W. Wang, 2014: The influence of natural and anthropogenic factors on major stratospheric sudden warmings. J. Geophys. Res. Atmos., 119, 8117–8136, doi:10.1002/2013JD021397.
Hitchman, M. H., and A. S. Huesmann, 2009: Seasonal influence of the quasi-biennial oscillation on stratospheric jets and Rossby wave breaking. J. Atmos. Sci., 66, 935–946, doi:10.1175/
2008JAS2631.1.
Ho, C.-H., H.-S. Kim, J.-H. Jeong, and S.-W. Son, 2009: Influence of stratospheric quasi-biennial oscillation on tropical cyclone tracks in the western North Pacific.Geophys. Res. Lett.,36, L06702, doi:10.1029/2009GL037163.
Holland, M. M., D. A. Bailey, B. P. Briegleb, B. Light, and E. Hunke, 2012: Improved sea ice shortwave radiation physics in CCSM4: The impact of melt ponds and aerosols on Arctic sea ice.J. Climate,25, 1413–1430, doi:10.1175/JCLI-D-11-00078.1.
Holton, J. R., and H.-C. Tan, 1980: The influence of the equatorial quasi-biennial oscillation on the global circu- lation at 50 mb.J. Atmos. Sci.,37, 2200–2208, doi:10.1175/
1520-0469(1980)037,2200:TIOTEQ.2.0.CO;2.
——, and ——, 1982: The quasi-biennial oscillation in the Northern Hemisphere lower stratosphere.J. Meteor. Soc. Japan,60, 140–148.
Huang, B. H., Z. Z. Hu, J. L. Kinter, Z. H. Wu, and A. Kumar, 2012:
Connection of stratospheric QBO with global atmospheric general circulation and tropical SST. Part I: Methodology and composite life cycle.Climate Dyn.,38, 1–23, doi:10.1007/s00382-011-1250-7.
Kiladis, G. N., and H. van Loon, 1988: The Southern Oscillation. Part VII: Meteorological anomalies over the Indian and Pacific sec- tors associated with the extremes of the oscillation.Mon. Wea.
Rev., 116, 120–136, doi:10.1175/1520-0493(1988)116,0120:
TSOPVM.2.0.CO;2.
Kwan, K. F., and A. Abu Samah, 2003: A conceptual model relating the quasi-biennial oscillation and the tropospheric biennial os- cillation.Int. J. Climatol.,23, 347–362, doi:10.1002/joc.876.
Lau, K. M., 1992: East Asian Summer Monsoon rainfall variability and climate teleconnection.J. Meteor. Soc. Japan,70(1B), 211–242.
Lean, J. L., G. Rottman, J. Harder, and G. Kopp, 2005: Source con- tributions to new understanding of global change and solar var- iability.Sol. Phys.,230, 27–53, doi:10.1007/s11207-005-1527-2.
Loschnigg, J., G. A. Meehl, P. J. Webster, J. M. Arblaster, and G. P. Compo, 2003: The Asian monsoon, the tropospheric biennial oscillation, and the Indian Ocean zonal mode in the NCAR CSM. J. Climate, 16, 1617–1642, doi:10.1175/
1520-0442(2003)016,1617:TAMTTB.2.0.CO;2.
Manzini, E., M. A. Giorgetta, M. Esch, L. Kornblueh, and E. Roeckner, 2006: The influence of sea surface temperatures on the northern winter stratosphere: Ensemble simulations with the MAECHAM5 model. J. Climate, 19, 3863–3881, doi:10.1175/JCLI3826.1.
Marsh, D. R., M. J. Mills, D. E. Kinnison, J.-F. Lamarque, N. Calvo, and L. M. Polvani, 2013: Climate change from 1850 to 2005 simulated in CESM1(WACCM).J. Climate,26, 7372–
7391, doi:10.1175/JCLI-D-12-00558.1.
Marshall, A. G., and A. A. Scaife, 2009: Impact of the QBO on surface winter climate. J. Geophys. Res., 114, D18110, doi:10.1029/2009JD011737.
Maruyama, T., and Y. Tsuneoka, 1988: Anomalously short dura- tion of the easterly wind phase of the QBO at 50 hPa in 1987 and its relationship to an El Niño event.J. Meteor. Soc. Japan, 66(4), 629–634.
Matthes, K., D. R. Marsh, R. R. Garcia, D. E. Kinnison, F. Sassi, and S. Walters, 2010: Role of the QBO in modulating the influence of the 11 year solar cycle on the atmosphere using constant forc- ings.J. Geophys. Res.,115, D18110, doi:10.1029/2009JD013020.
Meehl, G. A., 1987: The annual cycle and interannual variability in the tropical Pacific and Indian Ocean regions.Mon. Wea.
Rev., 115, 27–50, doi:10.1175/1520-0493(1987)115,0027:
TACAIV.2.0.CO;2.
——, 1993: A coupled air–sea biennial mechanism in the tropical Indian and Pacific regions—Role of the ocean.J. Climate,6, 31–
41, doi:10.1175/1520-0442(1993)006,0031:ACASBM.2.0.CO;2.
——, 1997: The South Asian monsoon and the tropospheric bi- ennial oscillation. J. Climate, 10, 1921–1943, doi:10.1175/
1520-0442(1997)010,1921:TSAMAT.2.0.CO;2.
Mitchell, D. M., L. J. Gray, and A. J. Charlton-Perez, 2011: The structure and evolution of the stratospheric vortex in response to natural forcings.J. Geophys. Res.,116, D15110, doi:10.1029/
2011JD015788.
Richter, J. H., F. Sassi, and R. R. Garcia, 2010: Toward a physically based gravity wave source parameterization in a general cir- culation model. J. Atmos. Sci., 67, 136–156, doi:10.1175/
2009JAS3112.1.
Rind, D., and N. K. Balachandran, 1995: Modeling the effects of UV variability and the QBO on the troposphere–stratosphere
15 FEBRUARY2016 H A N S E N E T A L . 1367
system. Part II: The troposphere. J. Climate,8, 2080–2095, doi:10.1175/1520-0442(1995)008,2080:MTEOUV.2.0.CO;2.
Ropelewski, C. F., M. S. Halpert, and X. L. Wang, 1992: Observed tropospheric biennial variability and its relationship to the Southern Oscillation. J. Climate, 5, 594–614, doi:10.1175/
1520-0442(1992)005,0594:OTBVAI.2.0.CO;2.
Sassi, F., D. Kinnison, B. A. Boville, R. R. Garcia, and R. Roble, 2004: Effect of El Niño–Southern Oscillation on the dynami- cal, thermal, and chemical structure of the middle atmosphere.
J. Geophys. Res.,109, D17108, doi:10.1029/2003JD004434.
Scaife, A. A., and Coauthors, 2014: Predictability of the quasi- biennial oscillation and its northern winter teleconnection on seasonal to decadal timescales.Geophys. Res. Lett.,41, 1752–
1758, doi:10.1002/2013GL059160.
Seo, J., W. Choi, D. Youn, D. S. R. Park, and J. Y. Kim, 2013: Re- lationship between the stratospheric quasi-biennial oscillation and the spring rainfall in the western North Pacific.Geophys.
Res. Lett.,40, 5949–5953, doi:10.1002/2013GL058266.
Shapiro, L. J., 1989: The relationship of the quasi-biennial oscillation to Atlantic tropical storm activity.Mon. Wea. Rev.,117, 1545–1552, doi:10.1175/1520-0493(1989)117,1545:TROTQB.2.0.CO;2.
Taguchi, M., 2010: Observed connection of the stratospheric quasi- biennial oscillation with El Niño–Southern Oscillation in ra- diosonde data.J. Geophys. Res.,115, D18120, doi:10.1029/
2010JD014325.
——, and D. L. Hartmann, 2006: Increased occurrence of strato- spheric sudden warmings during El Niño as simulated by WACCM.J. Climate,19, 324–332, doi:10.1175/JCLI3655.1.
Trenberth, K. E., 1997: The definition of El Niño.Bull. Amer. Meteor.
Soc., 78, 2771–2777, doi:10.1175/1520-0477(1997)078,2771:
TDOENO.2.0.CO;2.
Tripathi, O. P., and Coauthors., 2015: The predictability of the extratropical stratosphere on monthly time-scales and its im- pact on the skill of tropospheric forecasts. Quart. J. Roy.
Meteor. Soc.,141, 987–1003, doi:10.1002/qj.2432.
van Loon, H., and R. A. Madden, 1981: The Southern Oscillation.
Part I: Global associations with pressure and temperature in northern winter.Mon. Wea. Rev.,109, 1150–1162, doi:10.1175/
1520-0493(1981)109,1150:TSOPIG.2.0.CO;2.
——, and K. Labitzke, 1987: The Southern Oscillation. Part V: The anomalies in the lower stratosphere of the Northern Hemi- sphere in winter and a comparison with the quasi-biennial oscillation. Mon. Wea. Rev., 115, 357–369, doi:10.1175/
1520-0493(1987)115,0357:TSOPVT.2.0.CO;2.
Wei, K., W. Chen, and R. H. Huang, 2007: Association of tropical Pacific sea surface temperatures with the strato- spheric Holton–Tan Oscillation in the Northern Hemi- sphere winter.Geophys. Res. Lett.,34, L16814, doi:10.1029/
2007GL030478.
Xu, J. S., 1992: On the relationship between the stratospheric quasi-biennial oscillation and the tropospheric Southern Oscillation. J. Atmos. Sci., 49, 725–734, doi:10.1175/
1520-0469(1992)049,0725:OTRBTS.2.0.CO;2.
Yuan, W., M. A. Geller, and P. T. Love, 2014: ENSO influence on QBO modulations of the tropical tropopause.Quart. J. Roy.
Meteor. Soc.,140, 1670–1676, doi:10.1002/qj.2247.