OecD c
OuntriesB
eyOnDtHe
P
uBlic-
Privates
Plitn
O. 160 r
alFg
ötzea
cHims
cHmiDRalf Götze Achim Schmid
Healthcare Financing in OECD Countries Beyond the Public-private Split
TranState Working Papers No. 160
Sfb597 „Staatlichkeit im Wandel“ − „Transformations of the State“
Bremen, 2012
[ISSN 1861-1176]
Ralf Götze, Achim Schmid
Healthcare Financing in OECD Countries Beyond the Public-private Split (TranState Working Papers, 160)
Bremen: Sfb 597 „Staatlichkeit im Wandel“, 2012 ISSN 1861-1176
Universität Bremen
Sonderforschungsbereich 597 / Collaborative Research Center 597 Staatlichkeit im Wandel / Transformations of the State
Postfach 33 04 40 D - 28334 Bremen Tel.:+ 49 421 218-56644 Fax:+ 49 421 218-56633
Homepage: http://www.staatlichkeit.uni-bremen.de
Diese Arbeit ist im Sonderforschungsbereich 597 „Staatlichkeit im Wandel“, Bremen, entstanden und wurde auf dessen Veranlassung unter Verwendung der ihm von der Deutschen Forschungsgemein- schaft zur Verfügung gestellten Mittel veröffentlicht.
Healthcare Financing in OECD Countries Beyond the Public-private Split
ABSTRACT
Background: Studies of long-term trends in the healthcare financing mix generally focus on a dichotomous concept discerning public from private funding sources. More de- tailed analyses of the funding mix tend to be restricted to a small number of cases or do rarely examine time trends.
Aim: This paper enhances the existing body of literature by developing and applying a trichotomous concept for healthcare funding, distinguishing taxes, contributions, and private sources. This includes a new aggregated indicator for the mix of three financing sources and its graphical representation.
Methods: The study mainly builds upon OECD Health Data 2011. We measure chan- ges in the funding mix since 1972 as its distance from a funding mix that equally draws upon taxes, contributions and private sources.
Results: Up to 1980, the OECD healthcare systems move toward ideal-typical financ- ing schemes. Between 1980 and 2000, the funding mix hybridizes mainly driven by privatization processes in NHS and social insurance countries and ongoing switch-over- processes between these two healthcare system types. Since 2000, OECD countries again tend toward ideal-typical funding schemes.
Discussion: We use the framework for institutional change developed by Streeck and Thelen. The quantitative approach highlights changes in terms of displacement, layer- ing, and drift but fails to fully reveal conversion processes. Therefore, further qualitative research is needed to capture not only shifts between the funding sources but also more gradual changes within them.
Conclusion: The back-and-forth development of the trichotomous funding mix chal- lenges assumptions of a universal trend toward hybrid financing structures.
CONTENTS
1 INTRODUCTION...1
2 BEYOND THE PUBLIC-PRIVATE SPLIT...2
3 SOURCES OF FINANCING...4
4 DATA AND CASE SELECTION...8
5 METHOD...8
6 RESULTS...10
6.1 Development of the overall funding mix...11
6.2 Visualization of the shifts between hybrid and monopolistic funding ...12
7 DISCUSSION...17
8 CONCLUSION...20
NOTES...21
ABBREVIATIONS...23
REFERENCES...24
BIOGRAPHICAL NOTE...27
TABLES AND FIGURES Figure 1: Trichotomous classification of healthcare funding schemes ...5
Figure 2: Visualization of trichotomous healthcare system funding...9
Figure 3: Hybridity index for different country samples in percent...11
Figure 4: Barros’ index of similarity for different country samples...12
Figure 5: Healthcare funding mix in 13 OECD countries (sample s1) in 1972 and 1980....13
Figure 6: Healthcare funding mix in 15 OECD countries (sample s3) in 1980 and 2000....14
Figure 7: Healthcare funding mix in 21 OECD countries (sample s6) in 2000 and 2008....16
Healthcare Financing in OECD Countries Beyond the Public-private Split
1 INTRODUCTION
Healthcare expenditures of countries belonging to the Organisation for Economic Co- operation and Development (OECD) have risen constantly for over four decades. The growth of healthcare costs and the different ways of healthcare funding have attracted much attention in current scientific and political debates. Concerning developments of the funding mix, so far in particular, the development of the dichotomous public-private mix has come under consideration. While this perspective reflects egalitarian versus libertarian values it conceals the variance within public and private spending.
In this paper1, we augment the financing mix by employing a trichotomous concept of healthcare funding that distinguishes taxes, contributions and private sources. Unfor- tunately, further disaggregation of financing sources inflates data availability problems.
The trichotomous approach corresponds to a conceptual distinction between a state sphere dominated by hierarchical relationships, a societal sphere characterized by asso- ciations and negotiations, and finally a private sphere where interactions take place on markets. As each method of financing implies varying difficulties concerning equity, coverage and choice, we might assume a trend toward hybrid financing structures. Fo- cusing on the OECD-world between the eve of the first oil crisis in 1972 and 2008, we examine if trends toward a hybrid financing structure are confirmed or whether rather particular funding sources are strengthened. Therefore, we develop a hybridity index which measures the distance of a country’s funding mix to a hypothetical mix that builds on equal levels of taxes, contributions and private spending. Using categories of institutional change identified by Streeck and Thelen, we then discriminate different trajectories of changes in the funding mix and suggest explanatory variables linked to these trajectories.
Before we turn to the empirical questions, we give a brief review of the literature (section 2) and provide definitions of financing sources (section 3). The following sec- tions 4 and 5 deal with the dataset used for this analysis and our methodological concept to measure changes of a trichotomous funding mix. Subsequently, we present the em- pirical results (section 6) and discuss the advantages as well as the drawbacks of the hybridity index (section 7). A final section concludes.
1 We would like to thank Simone Leiber, Heinz Rothgang, Claus Wendt, and two anonymous reviewers for their helpful comments. We are grateful to Falk Wagner for surveying data on the Spanish case and to Barbara Ehgart- ner for her careful editorial work.
2 BEYOND THE PUBLIC-PRIVATE SPLIT
The healthcare literature regularly deals with public and private shares of healthcare spending (Castles 2004; Huber and Orosz 2003; OECD 2011; Rothgang et al. 2008).
Indeed, there is much to suggest focusing on the public-private split. The privatization of funding structures is of particular political salience since it affects the access to healthcare, the affordability of medical treatment for those who are less affluent and, hence, equity issues (Maarse 2004b; Maynard 2005). Private financing schemes incur problems to cover the poor and the vulnerable, whereas schemes based on general taxes tend to force people (down) to similar standards without considering individual demand or willingness to pay (Barros 2007). On the one hand public financing sources are sus- pected of causing excessive spending due to moral hazard and bureaucratic budget maximizing strategies (Leu 1986). On the other hand they seem to promote state capac- ity to control spending (Gerdtham and Jönsson 2000). Public schemes have been con- sidered superior to private financing in terms of guaranteeing financial stability without compromising access to healthcare and equity concerns (Thomson, Foubister and Mos- sialos 2009).
However, the simple public-private split conceals the variance within public and pri- vate spending. As the common distinction between National Health Service (NHS) and social insurance (SHI) systems suggests, public sources can be partitioned into tax reve- nues and social insurance contributions. These public financing streams involve distinct characteristics concerning risk pooling and different effects on generosity, equity, cov- erage, or sustainability (Wagstaff 2010: 504). For example, tax financing tends to be more progressive than social security contributions and requires solidarity on a national level rather than on the level of sickness funds. By the same token, the superior capacity of cost control attributed to public financing mainly applies to tax financing, which is under direct control of the government. Differently, social insurance funds are organ- ized autonomously from the government which means less vulnerability to the politics of the day. Therefore social insurance features high levels of legitimacy and trust. In contrast to tax financed systems healthcare systems based on social insurance financing experience pressure to broaden their financing base due to adverse relations between payroll contributions, the labor market, and financial sustainability. Yet, there are also differences within the realm of private financing. In particular we will have to consider private health insurance (PHI) financing next to out-of-pocket spending, which refers to direct purchases of healthcare as well as to various forms of copayments. While out-of- pocket spending is characterized by the fact that the full risk of contracting illness has to be borne by the individual, private health insurance plans include risk pooling. Even though insurance premiums are geared toward the individual risk, in case of an illness, the insurance community vouches for the costs of recovery.
The differences within public and private financing suggest considering trends of healthcare financing beyond the public-private mix. To what extent is this covered by the existing body of literature? A more detailed examination of the funding mix and changes over time can generally be found in studies that provide a description of health- care systems (e.g. see the HiT-Reports of the European Observatory or the special issue of Health Economics in 2005[s1]). Studies of changes in the funding mix tend to focus on single country studies, occasionally, involving qualitative assessments based on a cross-national perspective (Maarse 2004a; Maynard 2005; Thomson, Foubister and Mossialos 2009), while international comparative studies rather provide snapshots, ne- glecting developments over time (Mossialos et al. 2002; OECD 2011; Wagstaff 2010).
Comparative literature on changes in the funding mix beyond the public-private di- chotomy is rather scarce. A notable exception is Barros’ brief study on changes in the funding mix of 16 OECD countries between 1975 and 2005 (Barros 2007). Barros sug- gests an index measuring the ‘similarity of the funding mix’. This index is constructed for each country in a given sample with n countries, considering the country-specific funding shares of taxes, contributions, private insurance premiums, and out-of-pocket payments. Barros measures the absolute distance of the funding share of a given scheme to the funding share of the respective scheme in another country. This is repeated for all funding schemes and all pairs of countries in the sample. Finally, the absolute distances are summed up for each country (see composition in note [1]). After standardization, the index ranges from zero to unity, where zero indicates that the funding mix of a country is identical to all the other countries in the sample. Unity means that a country is exclu- sively financed by funding sources no other country uses. A decline of the index over time is interpreted as a sign of sigma-convergence, denoting increasing similarities be- tween countries (see Holzinger and Knill 2005). Barros finds slow shifts of the funding mix with tendencies toward less public financing and increasing similarities of financ- ing amongst OECD countries.
Using analogous concepts for taxes, social insurance contributions and private sources, Rothgang et al. (2010: Chapter 3) reveal slightly convergent funding structures over 18 OECD countries since the early 1990s. Differently, Glied (2009) examines the
‘single payerness’ in healthcare financing in OECD countries, measured by the Herfin- dahl-Hirschman-Index which is a popular indicator of market concentration in econom- ics. This index is defined as the sum of the squared funding shares (see composition in note [2]). Its maximum value is unity which indicates total monopoly of a single fund- ing source. The lower limit is defined as the reciprocal of the total number of funding sources and means that all funding sources have the same financing share. Hence, the index captures delta-convergence which refers to movements toward a predefined end (see Holzinger and Knill 2005). Glied considers taxes, contributions, private insurance
premiums, and out-of-pocket payments. While the main focus of her analysis concerns the effects of monopsony financing power on various goals of healthcare systems, Glied vaguely suggests convergence in the sense that fragmented schemes tend to become less fragmented and those with strong monopsony power becoming more fragmented (Glied 2009: 597). While there is some evidence for convergence in healthcare financing, it is unclear if there is a focal point of convergence. Barros (2007) suggests a privatization trend, whereas Rothgang et al. (2010) rather find that convergence within healthcare system types provokes increasing similarities.
3 SOURCES OF FINANCING
International comparative analyses of financing structures in the OECD world generally refer to OECD Health Data as the most comprehensive data source. The OECD defines health financing schemes as ‘the main types of financing arrangements through which people obtain health services’, where third party financing schemes represent ‘distinct bodies of rules, governing the mode of participation in the scheme, the basis for enti- tlement to health services and the rules of raising and then pooling revenues of the given scheme‘ (OECD, Eurostat and WHO 2011). The classification into different pub- lic or private schemes is therefore dependent upon the regulation of these schemes. Am- biguities of classifications mainly arise with respect to third party financing: govern- ment schemes, social insurance, and private insurance. Thus, governments may seek to increase the legitimacy of tax claims by earmarking taxes for health purposes and by the creation of parafisci. By the same token, payroll taxes for health spending may survive as a relict of former public insurance schemes. While the existence of parafisci or ear- marked taxes may challenge the classification of taxes versus contributions, there is also ambiguity with respect to social and private insurance. Traditionally, SHI is character- ized by mandatory assignment of members based on their employment status. This in- cludes wage-related contributions shared between employers and employees, which accrue to funds organized autonomously from government units. However, some sys- tems have replaced or amended wage- and income-related contributions by flatrate con- tributions. This increases similarities with PHI plans. There are further analogies: social and private insurance pool health risks, and are subject to government regulation which may even include a mandate to insure, and PHI might as well be provided by non-profit organizations.
Having highlighted some similarities of financing sources leads us to the pertaining question: What are the critical regulatory features to distinguish government schemes from SHI funds and from private schemes? To answer this question and for the pur- poses of data adaption, we refer to the most recent System of Health Accounts (SHA) jointly released by OECD, Eurostat, and WHO (2011). The SHA 2011 seeks to define
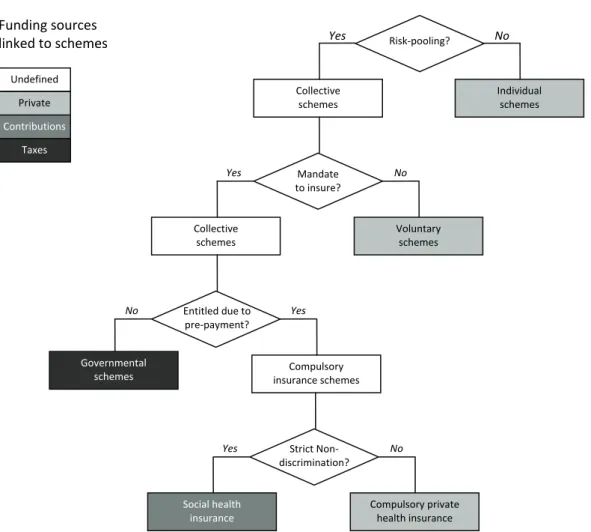
financing schemes independent from institutional characteristics of the financing agent operating the system. The classification follows a decision tree that separates voluntary from mandatory schemes. The latter are further divided into government schemes and compulsory prepaid schemes by the terms of entitlement. Government schemes grant benefits independent from personal financial contributions, in contrast to other obliga- tory prepaid schemes. The SHA separates the latter by the question of interpersonal pooling into compulsory insurance schemes and compulsory medical savings accounts.
Financing schemes including interpersonal pooling are defined as compulsory insurance schemes of which compulsory private schemes are characterized by the fact that insur- ants purchase insurance plans while there is no purchasing contract but rather a mem- bership in case of social insurance.
Figure 1: Trichotomous classification of healthcare funding schemes
Graphic does not include further subschemes of an already defined branch as they belong to the same aggregated funding source
This decision tree provides crucial criteria for the definition of funding schemes but it still contains unanswered questions. A systematic definition of public and private schemes is not given. We consider this distinction still relevant because it refers to the
Risk‐pooling?
Collective schemes
Individual schemes No Yes
Mandate to insure?
Voluntary schemes No
Collective schemes
Yes
Entitled due to
pre‐payment?
Compulsory insurance schemes
Yes
Governmental schemes
No
Strict Non‐
discrimination?
Compulsory private health insurance
No
Social health insurance
Yes Contributions
Private
Taxes Undefined
Funding sources linked to schemes
level of solidarity included in the system. This weakness, we argue, is related to the fact that the terms of enrolment and the terms of risk-pooling (except for the strong assump- tion of no interpersonal pooling) are not included in the decision tree. Moreover, the difference between purchasing insurance and becoming a member need not be the piv- otal difference between SHI and PHI. We would rather argue that both schemes are separated by the way they pool risks. Therefore, we suggest a modified decision tree designed to identify tax financing, contributions and private sources. Thereby, the deci- sion tree reflects an ordinal scale of solidarity from universal social rights to individual responsibility.
At first, we ask if any forms of risk-pooling beyond the individual household occur.
Individual schemes are private by definition, including direct payments of households or organizations for purchasing medical goods and services. This category also includes copayments or medical savings accounts. Risk-pooling identifies collective schemes which might still include private components. Similarly to the SHA 2011, mandatory schemes are separated from voluntary schemes. The latter represent, for instance, volun- tary private insurance. Next, compulsory schemes are distinguished by the question whether entitlements to benefits are based upon pre-payment. The core feature of insur- ance schemes is that contributions establish entitlements for benefits. Differently, in (tax based) governmental schemes entitlements are rooted in a certain status as resident, citi- zen, state employee, or needy person (i.e. specific schemes for state employees or the poor are financed by taxes). Finally, compulsory insurance schemes can be separated into social health insurance and compulsory private health insurance by the terms of enrolment and risk-rating. Social insurance is characterized by strict non- discrimination. With non-discrimination we refer first of all to open enrolment. The health insurance fund must accept any applicant irrespective of health status, previous health experience, age or gender and offer a common benefit package. Further, non- discrimination precludes risk-rated premiums. These conditions define the functions of a social insurance scheme independent of the public or private nature of the institution which operates the scheme. Private insurance is based on a free contract, which in- cludes the option to refrain from contracting for both sides and it is characterized by risk-rating which aims to model the health risk of individuals or defined groups. Hence, there is no ex ante redistribution. A mandate to insure requires public support for those who cannot afford to pay the premiums – mainly, the old aged, the disabled, and the poor – but would, in our opinion, on its own, not be sufficient to turn private into social insurance. Public insurance schemes differ from private insurance through open enrol- ment which includes payments independent from the individual health risk and hence through forms of ex ante redistribution.
For example, the German statutory health insurance is a collective financing scheme as the funds pool risks. Although some groups can opt, participation is generally manda- tory which makes it a compulsory scheme. Benefit claims require contribution pay- ments to statutory health funds, generally raised by employees and employers. Benefits for the non-employed are either based on derived rights through the membership of the spouse or payments of the state on behalf of needy people. Thus statutory health insur- ance includes all criteria of a compulsory insurance scheme. Finally, open enrolment, a common benefit package and risk-independent contribution rates corroborate the defini- tion as a social insurance scheme. By the same token private insurance schemes in Germany follow the flowchart just as statutory insurance. Since 2009 there is even a mandate to insure. However, risk-rated premiums and variable benefit packages make it a private (compulsory) insurance. While for the German case the terms social and pri- vate insurance match with the chosen definitions, labels of financing schemes may be delusive. In France, the term ‘mutuelles de santé’ suggests a social insurance scheme, yet, mutual funds refer to the voluntary insurance market and may also claim risk-rated premiums (though the state limits the terms of risk-rating) (Chevreul et al. 2010). There- fore, they will have to be classified as voluntary private insurance. Conversely, in the Netherlands, the convergence of public and private health insurance in 2006 has estab- lished a health insurance under private law. However, Dutch health insurance funds fully comply with the criteria of a social insurance scheme.
What does this mean for our use of OECD health data? Despite the differences of the decision trees, to our best knowledge, both concepts are basically in line with the fi- nancing data provided by the OECD. Adjustments refer to the classification of social insurance contributions in the US. The OECD health data 2011 classifies the insurance schemes for the aged and disabled (Medicare), the poor (Medicaid) and children in low- income families (CHIP) as well as tax transfers to these schemes as social insurance expenditure. This seems implausible since neither tax transfers to these schemes nor Medicaid and CHIP relate contributions to benefits. Participation in these schemes fol- lows from the adverse economic status. Only the Medicare program requires a contribu- tion history for benefit entitlements. Therefore, in the US case, we use OECD Health Data 2010 which summarizes only Medicare expenditure funded by the contributions of employers and employees under social insurance schemes.
Further adjustments refer to New Zealand and Norway collecting money from em- ployer’s and employees’ contributions. These funds accrue to the government and are used for general health expenditure. Since entitlements are based on residency rather than contributions, we have classified these funds as governmental schemes and hence tax spending (ACC 2008; Johnsen 2006: 40, 141). We refer to these adjustments in the following section dealing with the database of our analysis.
4 DATA AND CASE SELECTION
The quantitative part of this study builds on OECD Health Data 2011. This database provides the most reliable internationally comparative statistic on healthcare funding for currently 34 OECD countries. The following analysis includes only 21 countries which entered the OECD before the first oil crisis and provide sufficient data (see figure 3).
For our analysis we employ data on total and public expenditure on health. In addition, we use the categories general government and social security funds to calculate the fi- nancing shares of taxes and contributions, respectively. If appropriate, we complement the dataset with minor imputations or external data sources such as the OECD Social Expenditure database and national statistics. As mentioned, we re-classified some fund- ing sources as they did not fit to the definitions given (see note [3]).
Due to data limitations we cannot scrutinize the development of all sample countries over the entire observation period. Hence, we work with six subsamples. The first sub- sample s1 includes 13 countries with consistent data on trichotomous healthcare financ- ing for the entire observation period from 1972 to 2008. The subsamples s2 to s6 cover shorter time periods but include incrementally more cases and therefore enhance the robustness of the results (see figure 3). The biggest subsample s6 consists of 21 coun- tries covering the years 1995 to 2008.
5 METHOD
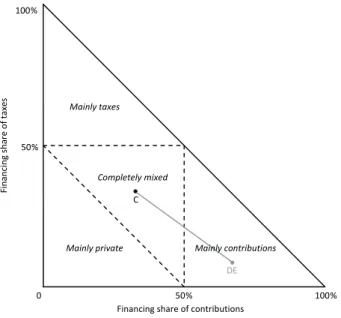
The basic aim of our measure of hybridity is to provide a straightforward characteriza- tion of the trichotomous funding mix that allows an intuitive visualization. The concept relies on basic Euclidean geometry. As the financing shares of taxes, contributions, and private sources add up to 100 percent, we can leave out one variable and limit our mo- del to the plane (two-dimensional) Euclidian space which is easy to display. The x-axis represents the financing share of contributions (cshare), the y-axis the financing share of taxes (tshare). Hence, private sources are the remainder of both variables (also applied in Wagstaff 2010).
As neither one variable nor the sum of both can logically exceed the 100-percent- level, a right triangle limits the space of possible values. This triangle allows us to lo- cate the trichotomous funding mix of each healthcare system in a single point. Further, we divide the triangle in four segments. The three outer ones reflect that one financing source covers more than 50 percent of overall funding and therefore healthcare systems within these segments are mainly financed by taxes, contributions, or private sources, respectively. The forth, inner segment indicates that no financing source exceeds the 50- percent-level. Hence, healthcare systems within this segment have a completely mixed funding structure. For instance, in 2008 the German healthcare funding consisted of 8.9
percent taxes, 67.6 percent contributions, and 23.5 percent private sources and therefore it is situated in the ‘mainly contributions’ segment (see point ‘DE’ in figure 2).
Figure 2: Visualization of trichotomous healthcare system funding
This concept is in so far highly intuitive as it allows us to visually track the position of countries in a single year as well as changes over time. As we are also interested in an indicator of hybridity, we introduce the geometric center C of the right triangle. Now, we calculate the absolute distance di between each country i with the coordinates (csharei / tsharei) and C using the Pythagorean Theorem:
(1)
2 2
3 1 3
1
i i
i cshare tshare
d
The shortest distance is zero representing that all financing sources contribute one third to overall funding. The longest possible distance is dmax which occurs at three points (100 percent taxes, contributions, or private sources). Hence, dmax accounts:
(2) 9
5 3
0 1 3
1 1
2 2
max
d
Consequently, we know the exact range of potential di values spreading from zero to dmax. Within this possibility space, di reacts linearly to changes of cshare and tshare.
This allows us to calculate the standardized degree of hybridity hi for each country which is easier to interpret than the absolute distances:
(3)
max max
d d hi d i
C
50 % 100 %
0 100 %
50 %
Mainly private Mainly taxes
Completely mixed
Financing share of contributions
Financing share of taxes
DE Mainly contributions
The indicator hi ranges from zero to 100 percent. Zero indicates that a single healthcare system is entirely funded either by taxes, contributions, or private sources. 100 percent hybridity represents that all financing sources contribute one third to the funding mix. In addition, we also calculate the standardized degree of hybridity hs for an entire sample s consisting of n countries, representing the mean of country-specific hi. Hence, the com- position of the average hybridity index for an entire sample is:
(4) n
d d d h n i
i s
max
max
In the following, we use the term hybridity index for both standardized measures which are either related to a single country or an entire sample. The hybridity index captures delta-convergence depicting to what extent countries move toward a defined model and therefore has a lot in common with the Herfindahl-Hirschman-Index (HHI) for three funding sources. Using data for 2008 including 21 OECD countries, we find a very strong as well as highly significant negative correlation between both indicators (r2 = –0.973; p < 0.001). The negative sign reflects the inverted scale of both indexes.
Hence, the commonly accepted HHI aligns with our hybridity indicator which addition- ally provides a better visualization and standardization. The latter is also underpinned by the fact that the hybridity index grows linearly while the HHI is progressive and therefore very sensitive for initial shifts away from monopolistic funding but rather blind concerning changes close to hybrid financing. As expected, the hybridity index differs tremendously from Barros’ index of similarity. We find practically no correlation between both indicators (r2 = –0.090; p = 0.699). Hence, the hybridity index captures delta- but not sigma-convergence. As the latter refers to the far more common under- standing of convergence, we avoid this term. Instead, we use ‘hybridization’ for move- ments toward a completely mixed financing structure and we label shifts toward ideal- typical funding schemes as ‘monopolization’.
6 RESULTS
The presentation of the results is divided into two parts. The first part focuses on the development of the hybridity index hs for the six subsamples s1 to s6 over time (infor- mation on hi for single countries is provided in note [4]). This allows us to identify peri- ods of hybridization and monopolization. We also apply Barros’ index of similarity on these periods. In the second part, we display selected periods of time in order to ascer- tain the movements of countries that are responsible for these developments.
6.1 Development of the overall funding mix
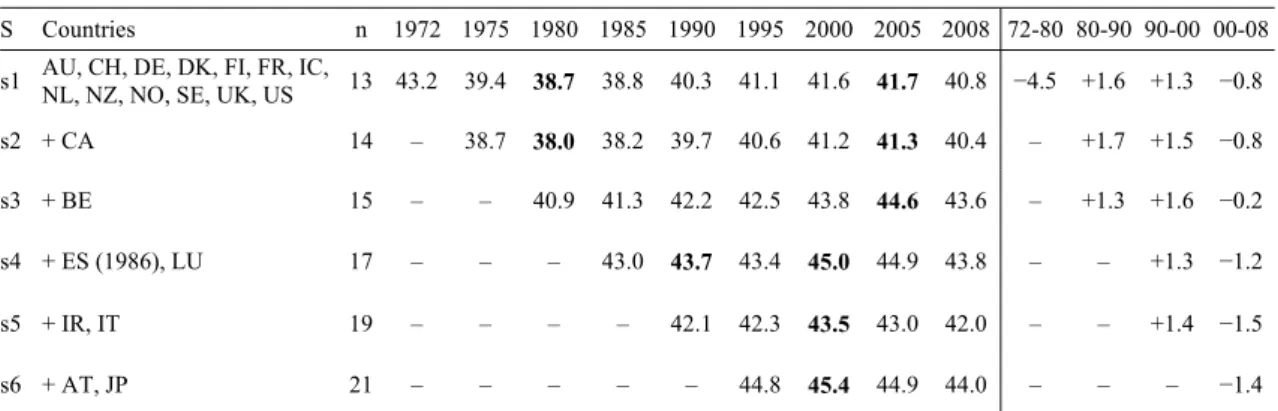
The analysis of the hybridization index starts with the sample s1 which covers the entire observation period. Interestingly, these 13 countries had the most hybridized financing structure accounting for 43.2 percent in 1972 at the eve of the first oil crisis (see figure 3) which is generally seen as the heyday of Western welfare states. Up to 1980, the countries strongly moved toward monopolistic funding schemes. Between 1972 and 1980 hs1 decreased by 4.5 percentage points reflecting a marked shift to ideal-typical funding schemes. While hs1 remained stable between 1980 and 1985, we subsequently observe a two decades lasting hybridization trend. During this period (1985 to 2005) hs1
increased by 2.9 points. The year 2005 seems to be a turning point, as the indicator dropped considerably by 0.9 points within the following three years.
Figure 3: Hybridity index for different country samples in percent
S Countries n 1972 1975 1980 1985 1990 1995 2000 2005 2008 72-80 80-90 90-00 00-08 s1 AU, CH, DE, DK, FI, FR, IC,
NL, NZ, NO, SE, UK, US 13 43.2 39.4 38.7 38.8 40.3 41.1 41.6 41.7 40.8 −4.5 +1.6 +1.3 −0.8 s2 + CA 14 – 38.7 38.0 38.2 39.7 40.6 41.2 41.3 40.4 – +1.7 +1.5 −0.8 s3 + BE 15 – – 40.9 41.3 42.2 42.5 43.8 44.6 43.6 – +1.3 +1.6 −0.2 s4 + ES (1986), LU 17 – – – 43.0 43.7 43.4 45.0 44.9 43.8 – – +1.3 −1.2 s5 + IR, IT 19 – – – – 42.1 42.3 43.5 43.0 42.0 – – +1.4 −1.5 s6 + AT, JP 21 – – – – – 44.8 45.4 44.9 44.0 – – – −1.4 Bold entries indicate shifts in direction. Country abbreviations see note [4].
In order to enhance the robustness of these findings, we take the samples s2 to s6 into account which include up to eight extra cases. We add cases according to data availabil- ity. Sample s2 amended by Canada and s3 including Belgium by and large corroborate earlier findings of back and forth movements. Adding Luxembourg and Spain (sample s4) challenges the robustness of results: The hybridization process is temporally inter- rupted in 1995 and already ends in 2000. The sample s5 again points to continuous hy- bridization in the 1990s but supports the s4 finding that this process already ends in 2000. Similar trends are found for the most comprehensive sample s6 displaying the results for 21 countries between 2000 and 2008.
Thus, we find robust evidence to split our observation period in three phases: (1) a development from relatively hybridized to monopolistic funding structures up to 1980, (2) a long hybridization period between 1980 and 2000, and (3) a movement back to a more ideal-typical schemes since 2000.
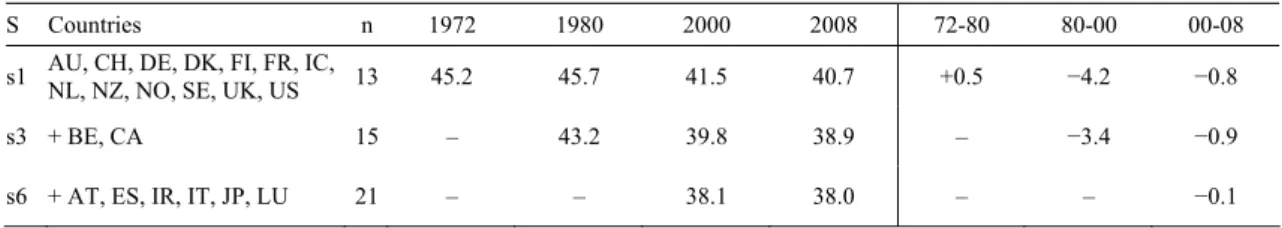
Figure 4: Barros’ index of similarity for different country samples
S Countries n 1972 1980 2000 2008 72-80 80-00 00-08
s1 AU, CH, DE, DK, FI, FR, IC,
NL, NZ, NO, SE, UK, US 13 45.2 45.7 41.5 40.7 +0.5 −4.2 −0.8
s3 + BE, CA 15 – 43.2 39.8 38.9 – −3.4 −0.9
s6 + AT, ES, IR, IT, JP, LU 21 – – 38.1 38.0 – – −0.1 Country abbreviations see note [4]
Concerning the distribution of countries within these periods, we refer to Barros’ index of similarity. During the period 1972 and 1980, the BIS increases, indicating divergence (see figure 4). Hence, the monopolization of funding schemes within the 13 OECD healthcare systems belonging to the sample s1 is also related to increasing differences between them. Corresponding to this, we observe a convergence process during the hy- bridization period (1980-2000). Distances strongly decreased and therefore the funding mixes of healthcare systems became more similar. Interestingly, the monopolization since 2000 is not linked to a divergence but to a convergence process. Although the countries shift toward ideal-typical funding schemes, the BIS and therefore the dis- tances between them decrease. The samples s3 and s6 iterate by and large the story gathered from the sample s1. Only the convergence process between 2000 and 2008 is less pronounced in the sample s6 but it supports the observations that monopolization and sigma-convergence can occur at the same time.
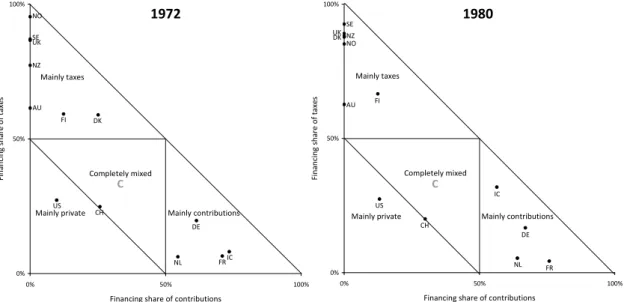
6.2 Visualization of the shifts between hybrid and monopolistic funding The second part of this section deals with the visualization of the three phases men- tioned above. This allows us to investigate shifts between the three funding sources in detail. For each phase we use the most comprehensive country sample. Hence, the pe- riod 1972 to 1980 is captured by the sample s1. For the hybridization process between 1980 and 2000, we consider sample s3. Finally, the most comprehensive sample s6 de- picts the years between 2000 and 2008. In order to limit the description, we only focus on the initial and final year of each phase.
Starting with the monopolization phase from 1972 to 1980, we display the distribu- tion of 13 countries belonging to the sample s1. In 1972, seven Anglo-Saxon and Nor- dic healthcare systems were mainly financed by taxes. Within this group Norway, Swe- den, and the UK had a relatively ideal-typical funding structure. In contrast to this, New Zealand as well as Australia had a moderate private share and contributions still played a significant role in Finland and Denmark. Eight years later, Denmark and New Zealand joined the cluster of nearly completely tax financed healthcare systems. The extraordi- nary strong monopolization in Denmark (∆hi = −49.6 points) is related to the abolition of sickness funds in 1973 (Strandberg-Larsen et al. 2007: 22). In New Zealand the shift
toward ideal-typical funding mainly linked to increased public subsidies for GP fees (Starke 2010). Only Australia and to a lesser extent Finland remained relatively hybrid.
Figure 5: Healthcare funding mix in 13 OECD countries (sample s1) in 1972 and 1980
US UK
CH SE
NO
NZ
NL IC
DE
FR
FI DK
AU
0%
50%
100%
0% 50% 100%
Financing share of contributions
Financing share of taxes
Mainly taxes
Mainly contributions Mainly private
Completely mixed
AU DK
FI
FR DE IC
NL NZ
NO SE
CH UK
US
0%
50%
100%
0% 50% 100%
Financing share of contributions
Financing share of taxes
Mainly taxes
Mainly contributions Mainly private
Completely mixed
The group of contribution-based systems includes four countries in 1972 – three of them Continental European. Due to a significant share of privately insured, Germany and the Netherlands had a relatively hybrid financing structure (Thomson and Mossialos 2006).
France and Iceland came closer to ideal-typical funding. This picture changed in 1980.
Germany and the Netherlands enhanced the role of contributions and moved toward France, whereas Iceland shifted into the direction of tax funding. While in Germany, center-left governments extended SHI coverage to farmers, disabled, students, and art- ists (Bärnighausen and Sauerborn 2002), the Dutch development is driven by an adverse selection process between social and private insurance (Götze 2010: 9).
Finally, Switzerland and the United States shared a strong role of private sources but had already in 1972 a relatively mixed financing structure. In contrast to the other two groups (i.e. tax and contribution based countries), we find no substantial shift to more ideal-typical funding up to 1980 – the US even took a move toward the ‘completely mixed’-sector, largely due to an increasing role of Medicare contributions. Hence, the overall shift to monopolistic funding schemes was predominantly fueled by NHS coun- tries and – to a lesser extent – SHI systems.
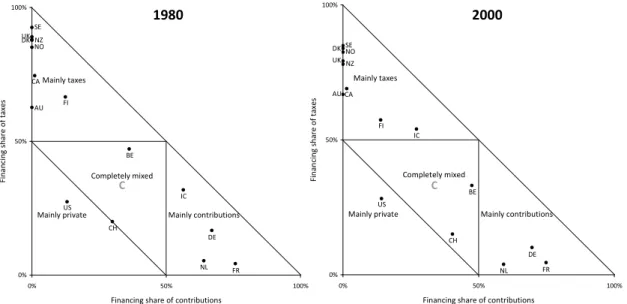
Next, we examine the hybridization phase from 1980 to 2000. For this time span, we can rely on data of 15 countries belonging to the sample s3. In 1980, the mainly tax funded systems included a cluster of unitary Anglo-Saxon and Scandinavian countries close to monopolistic financing as well as now three more hybrid cases since the Cana- dian funding mix relied on a significant share of private sources, mainly devoted to
1972 1980
C C
pharmaceuticals (Cacace and Schmid 2008). Until 2000, the five relatively ideal-typical tax financed systems increased the role of private sources. This effect was more pro- nounced in the two Anglo-Saxon countries compared to the three Scandinavian ones.
The privatization trend also affected the relatively mixed Canadian and Finish health- care systems making them even more hybrid. Only Australia increased the role of taxes but still kept its relatively hybrid character.
Figure 6: Healthcare funding mix in 15 OECD countries (sample s3) in 1980 and 2000
US UK
CH SE
NONZ
NL IC
DE
FR FI
DK
CA
BE AU
0%
50%
100%
0% 50% 100%
Financing share of contributions
Financing share of taxes
Mainly taxes
Mainly contributions Mainly private
Completely mixed
US UK
CH SENO
NZ
NL IC
DE FR FI
DK
CA
BE AU
0%
50%
100%
0% 50% 100%
Financing share of contributions
Financing share of taxes
Mainly taxes
Mainly contributions Mainly private
Completely mixed
With regard to the contribution-based systems, we observe a two-fold development for the period between 1980 and 2000. While France and Germany kept or even enhanced the role of contributions, Iceland and the Netherlands hybridized their funding schemes.
In 1986, the Dutch government abolished the voluntary sickness funds and its former members had to choose (state controlled) private plans (Götze 2010). Iceland even switched over to the predominantly tax financed systems.
Both privately funded cases, Switzerland and the United States follow different paths, although the dominant funding source declined in both countries. The US shared by and large the overall hybridization trend and enhanced the role of taxes and contribu- tions due to increasing Medicaid and Medicare eligibility, respectively (Rothgang et al.
2010: Chapter 7). In contrast to this, Switzerland fostered the role of contributions with the introduction of a mandatory insurance scheme in 1994 at the expense of private premiums and tax subsidies (Gerlinger 2009). Therefore, we observe a marked monopo- lization trend in Switzerland between 1980 and 2000 (∆hi = −7.7 points). By 2000 the country had adopted a completely mixed financing structure, denoted by a shift into the inner triangle. There, we can also find Belgium which belonged to the mixed financing
1980 2000
C C
sector in both observation points. While Belgium experiences a marked substitution of taxes through contributions, still none of the three financing sources is dominating.
Hence, the privatization trend in NHS countries and the Netherlands contributed the lion’s share to the overall hybridization process between 1980 and 2000. Public sources only had a minor (additional) effect. Only Iceland and Finland hybridized due to taxes or contributions, respectively. Quite contrary, the rise of contributions even fuelled the decline of the hybridity index in Germany, Switzerland, and the US. Therefore, the hy- bridization process is mainly a privatization process.
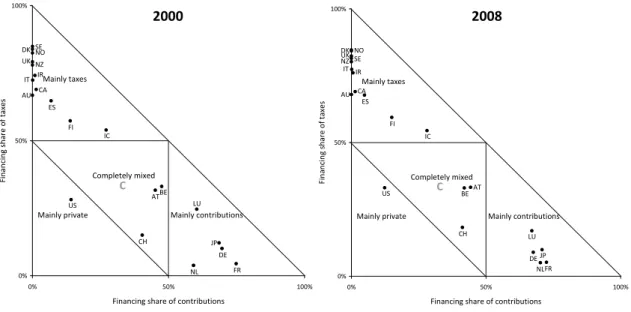
We finally focus on the most recent phase from 2000 to 2008 characterized by an overall backshift to more ideal-typical funding structures. For this period of time we have consistent data for 21 countries forming our biggest sample s6. In 2000, Ireland and Italy were situated between the more tax-based, unitary NHS countries New Zea- land and the UK on the one side and the significantly more private, decentralized pair Australia and Canada on the other. The Spanish healthcare system has a quite hybrid funding scheme as contributions still played a significant role in 2000. In the following eight years, we observe a remarkable shift toward a more ideal-typical funding struc- ture. The former split of the five heavily tax-financed countries into a unitary Anglo- Saxon and a Scandinavian cluster disappeared as center-left governments in New Zea- land and the UK enhanced tax funding while in Sweden the privatization process con- tinued. We also observe an increased role of taxes in more hybrid countries such as Fin- land, Ireland, Italy and Spain at the expense of private sources or – in the case of Spain – also social security contributions due to the SHI heritage, being successively replaced by the NHS (Petmesidou and Guillén 2008). Only Australia and Iceland did not change their position. While Iceland sticks close to a completely mixed financing structure, Australia sustains a financing mix of taxes with substantial private components.
Next, we turn to healthcare systems mainly financed by contributions extended by two cases. In 2000, Japan joins the cluster of countries with a comparatively strong role of social security contributions including Germany and France. Luxembourg had a rela- tively hybrid funding scheme but in contrast to the Dutch healthcare system due to tax funding instead of private sources. Hence, these five SHI countries produce a very scat- tered picture for 2000. Within only eight years this changed completely. Up to 2008, the role of contributions slightly decreased in France and Germany but increased in Japan, Luxembourg, and the Netherlands. Hence, the funding mix within this group became more similar and in sum more ideal-typical.
Focusing on the US as the sole mainly private case in 2000, we find a striking devia- tion from the overall monopolization trend. The hybridity index decreased slightly but not due to a shift back to the private heritage. Instead tax financing grew steadily due to implementation of the SCHIP program (Rothgang et al. 2010: Chapter 7). Finally, the
completely mixed financed systems of Austria, Belgium, and Switzerland, even contra- dicted the general trend toward ideal-typical funding schemes. All three countries shifted closer to the center of the triangle and, hence, became even more hybrid up to 2008. Therefore, the trend toward traditional ideal-typical funding schemes between 2000 and 2008 is restricted to healthcare systems based on taxes or contributions. It also reduced the variance within these groups. This finding indicates ‘clubs of convergence’.
In contrast to this, completely mixed funded systems continued their hybridization process and the private nature of the US system had no revival but declined further.
Figure 7: Healthcare funding mix in 21 OECD countries (sample s6) in 2000 and 2008
AU
ATBE CA
DK
FI
FR DE IC
IT IR
JP LU
NL NZ
NO
ES SE
CH UK
US
0%
50%
100%
0% 50% 100%
Financing share of contributions
Financing share of taxes
Mainly taxes
Mainly contributions Mainly private
Completely mixed
AU
BEAT CA
DK
FI
FR DE IC
IT IR
JP LU
NL NZ
NO
ES SE
CH UK
US
0%
50%
100%
0% 50% 100%
Financing share of contributions
Financing share of taxes
Mainly taxes
Mainly contributions Mainly private
Completely mixed
Summing up, the quantitative analysis suggested us to split the observation period in three phases producing a back-and-forth development in terms of monopolization and hybridization. The graphical representation of these phases allowed us to track these developments. Tax-funded systems contributed most to the dating of the phases not only due to their large number but also because of the most coherent trends. The develop- ment of contribution-based countries was less coherent but redounded by and large to the overall trend. In contrast to this, (former) privately financed countries steadily in- creased the role of contributions throughout the entire observation period, irrespective of any contradicting overall privatization or revival trend. In terms of the dispersion of countries we rather find ‘clubs of convergence’ which correspond to the decreased Bar- ros’ index of similarity than one optimal funding mix.
2000 2008
C C
7 DISCUSSION
The following section deals with two major questions. First, why do we find different levels of hybridization in healthcare financing? And second, what kind of trajectories of change toward ideal-typical or hybrid funding schemes can be identified?
Starting with the different degrees of hybridity in terms of healthcare funding the da- ta indicates a clear order: The more fragmented a healthcare system, the more hybrid its funding mix. Fragmentation describes that parts of the population and/or parts of healthcare services are covered by different schemes. Unsurprisingly, the universal ap- proach of NHS countries favors ideal-typical financing as the entire population is cov- ered by one unitary scheme. In contrast to this, SHI systems are prone to hybrid financ- ing due to their incremental expansion. Historically, most SHI systems were limited to employees and specific healthcare services leaving space for private insurance or a state-funded hospital sector (Saltman, Busse and Figueras 2004: Chapter 2). The state also provided tax subsidies to sickness funds in order to enhance the affordability for low-income workers or to include non-employed. Hence, the tradition of SHI systems supported the development of privately funded substitutive or complementary insur- ances as well as tax financed services or subsidies. The same holds true for PHI systems as especially high-risk or low-income groups have found no coverage in the private market and therefore increased the necessity for tax subsidies or public healthcare pro- grams.
But what are the reasons for the shifts observed above? First of all, the results negate simple functional assumptions as we do not find a steady trend toward one optimal trichotomous funding mix. Instead we find periods of back-and-forth developments and
‘clubs of convergence’ which rather support the interplay of functional requirements, institutional prerequisites, and political factors (see Starke 2010). In order to structure the reasons for the shifts in a systematic way, we use the framework for institutional change provided by Wolfgang Streeck and Kathleen Thelen (2005) who differentiate between displacement, layering, conversion and drift. Due to the theoretical weaknesses we can leave out the fifth mode ‘exhaustion’ as its mode of change does not differ sig- nificantly from drift (see Mahoney and Thelen 2010).
The first trajectory of change is related to a time-lagged effect of displacement. In this case of structural change, policymakers decide to switch over to a different health- care system type and therefore to new principles for coverage and entitlement. The rea- sons for such radical change may be found in a loss of legitimacy or severe financial problems of the existing funding system. Displacement can also be related to external forces such as cross-national policy diffusion or international pressure. Due to the vast volume of healthcare on overall economy, it usually takes several years to fully reallo- cate the financial resources – especially when huge redistributive effects will have to be
controlled for and acquired entitlements will have to be acknowledged. As one financ- ing source incrementally substitutes the other, the funding mix becomes more hybrid in the early stage of the transformation process and afterwards ideal-typical again. Hence, it supports a back-and-forth development due to institutional legacies. This pattern is exclusively related to former SHI countries switching to NHS structures during the first half of our observation period such as Denmark, Spain, Italy, and – to a lesser extent – Iceland. In these veto-free, unitary states the reforms were decided either by center-left governments (Denmark, Spain, and Iceland) or by centrist minority governments toler- ated by the left (Italy).
The second trajectory of change focuses on layering. In this sense, policymakers in- creasingly enhance the role of a relatively uncommon funding source without (initially) challenging the existing principles for coverage and entitlement. As health expenditures continuously rise in most OECD countries, the ‘atypical’ financing source rather com- plements than replaces the dominating one. Hence, layering can be seen as a rather sneaky blame-avoidance strategy for healthcare system change avoiding highly visible structural reforms, potentially entailing substantial change through differential growth.
This pattern is mainly related to the demand-side strategy of cost-containment policies in most NHS and SHI countries between 1980 and 2000 which attempted to lower health expenditure either by delisting of services or by expanding cost-sharing arrange- ments (Abel-Smith and Mossialos 1994; Mossialos and Le Grand 1999). Several gov- ernments – irrespective of their political color – used the economic crises of the early 1980s and 1990s as well as the challenge to meet the Maastricht criteria to justify cut- backs. But it is important to mention that despite the market-enthusiastic beliefs of Thatcherism and Rogernomics as well as veto-free decision structures, the conservative governments in the UK and New Zealand refrained from attempts to abolish the NHS.
In addition, SHI countries increased their tax subsidies to sickness funds to prevent fast increases of contribution rates as they are a highly visible component of labor costs (Ferrera, Hemerijck and Rhodes 2001).
The third trajectory of change takes policy drift into account. In this case, the relative role of financing sources grows due to a deliberate neglect of socioeconomic effects such as demographic change and medical-technical progress. Especially fragmented healthcare systems are prone to drift as the socioeconomic effects might affect occupa- tional groups in a different way or particularly affect costs in certain healthcare sectors.
The US Medicare is a striking example for such a process (for classification as layering see note [6]). The program covers people above the age of 65 years and therefore popu- lation aging enhances the number of people eligible for Medicare coverage (Heffler et al. 2005). In addition, the medical progress especially affects curative and palliative treatment costs for the elderly. As Medicare is financed by contributions and taxes the
funding scheme tends to hybridize. In contrast to this, policy drift in Germany and the Netherlands led to more ideal-typical funding up to the early 1980s. In Germany, the substitution of taxes by contributions between 1980 and 2000 is mainly related to the dualistic hospital funding. While the federal states paid for hospital investments, the sickness funds had to bear their operating costs (Rothgang et al. 2010: 130). This un- equal ‘division of labor’ allowed the federal governments to postpone investments while sickness funds had to pay ever-increasing expenditures on inpatient services leading to the drift between both public sources. With regard to the Netherlands, the risk-structure of sickness funds dramatically worsened due to adverse selection between public and private coverage. Hence, social security contributions increased at a faster pace than premiums for private health insurance (Companje et al. 2009: 263; Götze 2010: 24).
Interestingly, in these veto-ridden countries drift is associated with an expansion of pub- lic spending rather than retrenchment – contrary to the role of drift in the overall welfare state discourse (Hacker 2005).
The fourth trajectory of institutional change concerns conversion. This process de- scribes the transformation of an existing funding source into another one due to gradual changes of its institutional features. The Netherlands are the most prominent example for this mechanism. Within 20 years the Dutch government incrementally transformed its substitutive private health insurance which covered around one third of the popula- tion into a functional SHI under private law (Maarse and Bartholomée 2007). This led to a significant shift toward ideal-typical funding in 2006. Similar happened in Switzer- land where the government changed its predominantly privately funded healthcare into a mandatory SHI for the entire population (Gerlinger 2009). Therefore, conversion processes are related to the second half of our observation period and especially affect the transformation of private to social health insurance schemes in veto-ridden consen- sus democracies.
Summing up, the back-and-forth development of the hybridization process is mainly related to displacement caused by changes in unitary SHI countries which implemented tax financed NHS during the first half of our observation period. These healthcare re- forms were rooted in the political power of left-wing parties. The time-lags involved in these large scale transformations led to back-and-forth development in terms of hybridi- zation. Layering contributed to hybridization especially between 1980 and 2000 when OECD countries introduced cost-sharing arrangements or delisted services.
Conversion processes already hint the limitation of the hybridity index. Due to the qualitative nature of these changes, the quantitative approach applied in this study does not capture these developments for most of the times (e.g. the incremental ‘socializa- tion’ of the German PHI). But if the institutional change surpasses a certain threshold which causes a reclassification of the funding source, it leads to massive shifts in the
financing mix. Hence, the hybridity index underestimates incremental changes due to conversion processes before a reclassification occurs and overestimates the actual change afterwards. Nevertheless, the quantitative approach is strong in case of incre- mental change due to displacement, layering and drift.
8 CONCLUSION
The existing body of literature on the structure of healthcare financing mainly focused on the public-private-mix. Although this measure provides good insights to what extent societies acknowledge healthcare as a collective or an individual risk, it does not capture basic principles of coverage, entitlement, and payment mechanism. Therefore, we ad- dressed this point by splitting the public sources as the biggest component in nearly all OECD countries into taxes and contributions. As each of these three funding sources has its distinct advantages and drawbacks, we asked if there is a shift toward a more hybrid funding mix.
In order to measure these trends, we provided a new indicator – the hybridity index – which captures shifts between ideal-typical and hybridized funding and offers an intui- tive visualization. The empirical analysis of up to 21 OECD countries indicated a back- and-forth development. We observed a monopolization period between 1972 and 1980, followed by two decades of hybridization, and since 2000 a revival of ideal-typical funding schemes. Hence, there is neither an overall hybridization trend nor a shift to- ward an ‘optimal funding mix’ – quite contrary we identified rather ‘clubs of conver- gence’.
As the results did not support a simple functional argument, we structured the find- ings along the concept for institutional change by Streeck and Thelen (2005). While the mechanisms displacement and layering are reflected in the empirical results, conversion processes challenge the quantitative approach: NHS countries tend to earmark their tax- es, contributions are either designed similar to a personal income tax or flat-rate premi- ums, and private health insurances are increasingly obliged to fulfill social goals. An- other limitation of the hybridity index is the fact that it is bound to three funding sources. Hence, it is not possible to represent further disaggregated financing schemes.
Here, the Herfindahl-Hirschman-Index can be used as an alternative surveying the hy- bridity of healthcare financing and delta-convergence for four or more funding sources.
As the main objective of this paper is the development of the hybridity indicator and its application to a refined database, the analysis of causes of changes in the funding mix remained tentative. More research is needed in order to find economic, institutional, or political factors explaining the shifts observed. Although the trichotomous concept demands clearer definitions and higher data quality than the public-private-mix, it al- lows further interesting insights in the interplay of state, society, and economy.