Recent developments in the education system and school-to-work transitions in Croatia
Teo Matković
Teo Matković
Recent developments in the education system and school-to-work transitions in Croatia
Arbeitspapiere – Working Papers Nr. 138, 2010
Mannheimer Zentrum für Europäische Sozialforschung
Teo Matković:
Recent developments in the education system and school-to-work transitions in Croatia / Teo Matković – Mannheim : 2010
(Arbeitspapiere - Mannheimer Zentrum für Europäische Sozialforschung ; 138) ISSN 1437-8574
Not available in book shops.
Token fee: € 3,00
Purchase: Mannheimer Zentrum für Europäische Sozialforschung (MZES), D – 68131 Mannheim WWW: http://www.mzes.uni-mannheim.de
Editorial Note:
Teo Matković is a PhD candidate in Social Policy at the University of Zagreb, currently employed as a junior lecturer in the Social Policy Chair of the Faculty of Law and research assistant on the project
"Social cohesion indicators and development of the Croatian Social Model". His research interests focus on inequalities and policies in spheres of unemployment, employment, and education. His PhD thesis deals with school-to-work transitions in Croatia. During his stay at the MZES, he provided analyses for the Croatian School Leaver Survey.
This paper portrays the transitional developments in the education system, youth labour market and related institutional provisions in Croatia in line with recently published comparative work on transitions from school to work in Europe. The overview is primarily based upon the Croatian Labour force Survey series data ranging from 1996 to 2008.
The Croatian education system, based upon its central-European legacy, underwent, through substan- tive expansion in the 1950s and 1960s, a de-tracking experiment in the 1970s and 1980s, and a sub- stantial but unbalanced expansion of its tertiary education since the mid-1990s. The system re- trenched into a rather stratified system with medium standardization and weak employer linkages at the secondary level. In such a setting, coupled with strong employment-protection legislation, recent school-leaver unemployment in Croatia is high relative to general unemployment and tends to decline relatively slowly with labour market experience. Economic growth in the 2000s combined with partial deregulation of the labour market were followed by improved dynamics of entry, but an increase in the precariousness of the initial employment opportunity. Consequently, around 2008, it still took about five years on average for the school-leaver unemployment risk to approach that of the national aver- age.
In the Croatian case, its stratified education system leads to stratified labour market outcomes, both with respect to integration into the labour market and job quality. Achieved education level plays a cru- cial role in the school-to-work transition process. Unlike in the occupational labour market (OLM) coun- tries, secondary vocational education in Croatia does not enable smooth transitions or better job reten- tion, making the country pattern more akin to that of Mediterranean countries. Early school leavers and youth with only a general secondary education face the worst outcomes, while tertiary education persistently offers the substantive advantage in terms of labour market integration, job quality, and se- curity. Recent expansion in the number of tertiary graduates coincided with a decline in their job- search advantage, and their initial occupational status tends to be slightly lower, with substantive dif- ferences persisting. Once a job has been found, there is a strong tendency among graduates from each track of education to cluster in particular sectoral and occupational niches, while differences be- tween education tracks and levels in status of achieved jobs are as high in Croatia as they are in OLM countries.
1 Introduction... 1
2 Education system ... 2
2.1 Overview of the Croatian education-system legacy of 1945–1990... 2
2.2 The education system after 1990... 4
2.3 Vertical dimension of the education system... 7
2.4 Institutional traits of the education system ... 10
2.4.1 Stratification and track differentiation... 10
2.4.2 Standardisation and quality differentiation... 12
2.4.3 Organization of vocational training... 13
3 Structural and institutional setup of the Croatian labour market ... 14
4 Hypotheses ... 16
5 Data sources and methodology ... 18
6 Transitions from school to work ... 19
6.1 Activity and unemployment ... 20
6.2 Employment structure and job quality... 25
6.3 Precariousness and stability of employment... 28
7 Conclusion... 31
References ... 34
Appendix... 39
1 Introduction
This paper was initially conceived as a catch-up effort, aiming to portray the transitional developments in the Croatian education system, youth labour market and related institutional provisions in a fashion consistent and comparable to the recent major comparative works concerning such school-to-work transitions (Kogan et al., 2008; Kogan and Müller, 2003; Müller and Gangl, 2003). While such a de- scriptive effort provides a necessary background and foundation for further analytical work, the time span and detail of data available within the Croatian Labour force Survey (LFS) allowed for a more analytical approach in this paper. Therefore, this article will aim to position institutional structure and school-to-work transition patterns in Croatia within the contemporary findings for other European coun- tries, while exploring the fitness of the prominent theoretical concepts with respect to the observed de- velopments.
The first section of the paper outlines the education system of Croatia and describes its historical roots since the middle of the 20th century. The educational system receives detailed attention in this paper as there are no external resources that provide comprehensive information about all the elements of the education system in Croatia (some institutional reports exist in Duke et al., 2008; ETF, 2006;
Jafarov and Gunnarsson, 2008; OECD, 2001). The section loosely follows the structure laid out in Europe Enlarged (Kogan et al., 2008), while figures follow the templates provided in the education chapter of Transitions from Education to Work in Europe (Müller and Wolbers, 2003). It starts with a description of institutional heritage. Next, the main tracks and levels in the contemporary Croatian education system are introduced and the dynamics of expansion and vertical structuring of education among recent cohorts are described. This is followed by a discussion focusing on aspects of stratifica- tion, standardization, vocational specificity, and linkages of the education system at secondary and tertiary level.
The second section briefly lays out the structural and institutional dimensions of the labour market, as there is an adequate amount of literature discussing the contemporary Croatian labour market (Cazes and Nesporova, 2004; Crnković-Pozaić, 2007; Franičević, 2008; Matković and Šošić, 2007; Rut- kowski, 2003; Šošić, 2005). The third section lays out the hypotheses for school-to-work transition outcomes based on commonly used concepts and observed dynamics of the education system and labour market. The fourth part specifies the Croatian LFS dataset, target population, variables, and methods used in the analysis.
The final section turns towards the description and analytical observation of the school-to-work transi- tion process for Croatian recent school leavers between 1996 and 2008. It contains three subsections.
In the first, activity and unemployment dynamics are observed. The second subsection deals with early career occupational and sectoral destinations. The third explores the patterns of job precarious- ness and stability. Descriptives are set up so to follow up on LFS-based indicators used by Kogan and Schubert (2003) and Couppié and Mansuy (2003). The differences in career patterns according to achieved education level are explored through pooled cross-sectional accounts of labour market out-
comes grouped by time since leaving education. A cohort change in the entry dynamics is observed by following the outcomes for synthetic school-leaver cohorts who entered the labour market during the post-war recovery period (1995–1996), mounting crisis period (1999–2000) or during Croatia’s protracted recovery period (2003–2004).
2 Education system
2.1 Overview of the Croatian education-system legacy of 1945–1990
As World War II ended and the communist regime came to power, it inherited an education system that had not substantially changed since the Austro-Hungarian education law of 1871 came into force.
Compulsory education was only four years long, and coverage was haphazard, as even in the 1930s, primary school was attended by only two-thirds of the cohort. Selection into one of four strongly strati- fied tracks used to happen at the age of 11, with only elite gymnasium track leading to University edu- cation. As of 1946, compulsory education was made comprehensive and increased to seven years in duration, followed by an upper secondary education cycle of 1–3-year long vocational tracks or four- year long technical or general (gymnasium) tracks. The first post-war decade was a time of great ex- pansion in lower secondary education coverage, followed by an increased participation in upper sec- ondary education from the mid-1950s onwards (Potkonjak, 1980; Steinman, 1965). The federal law on education in 1958 formally standardized the education system and lengthened comprehensive com- pulsory education to eight years. At the same time, secondary education was de-stratified by the intro- duction of an increased permeability between upper secondary education tracks and the removal of barriers for attending tertiary education for upper secondary school graduates from technical tracks.
Early 20th-century tertiary education in Croatia used to provide training for a minority professional elite, organized along the lines of the German university "diploma" tradition. Such an organization persisted, but participation expanded from the late 1940s onwards. The broadening of the primary and secon- dary education base led to substantial expansion of tertiary education in the 1960s. Up until 1956, all higher education in Croatia was located in Zagreb, but in the following years, some faculties were es- tablished in other urban centres, eventually leading to the founding of other universities in the 1970s.
Regardless of expansion, most tertiary education courses suffered from low completion rates and a long duration of study (Steinman, 1956, 1965, 1969). Professional tertiary education was initially very limited in scope and expanded only gradually and unevenly. Education reform and the economic crisis from the mid-1970s to mid-1980s kept the number of entrants to academic tertiary education constant.
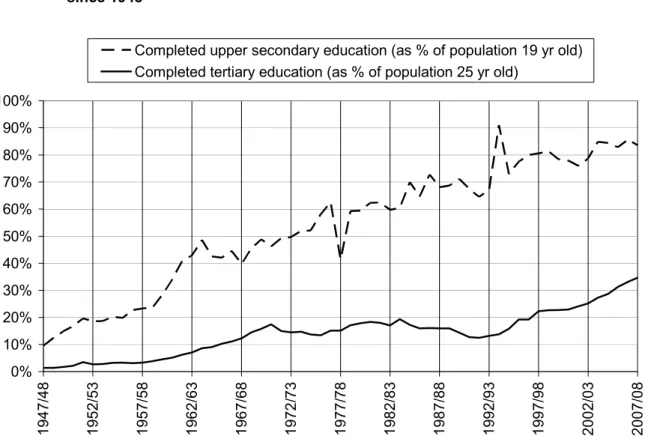
Data on gross completion rates (figure 1) demonstrate that the relative educational expansion in the post-war period was considerable, despite the baby-boom-related demographic pressure. Upper sec- ondary education uptake started in earnest in the early 1960s, when the first cohorts who started edu- cation after the war completed the lower secondary cycle, and this has been growing constantly since.
The education expansion in the 1950s and 1960s has not only greatly expanded coverage with lower and upper secondary education, but has produced what was, at the time, a reasonably sized sector of
tertiary education (Steinman, 1965), with the share of the cohort graduating from higher education ris- ing from 4% to 17%. As demographic pressures weakened in the last two decades of the communist regime, upper secondary education completion continued to improve (see figure 1 and figure 3) rising to about 80% among cohorts born between 1955 and 1970. Yet, the growth in tertiary education placements in the 1970s was slower than the influx of baby boomers. Consequently, the expansion of the participation rate petered out and turned into a contraction by the 1980s. Therefore, a person born between 1971 and 1975 had a worse chance of finishing university level education by 2001 than someone from the cohort born between 1950 and 1955 (figure 3, rightmost plot).
Figure 1. Gross regular upper secondary and tertiary education completion rates in Croatia since 1948
0%
10%
20%
30%
40%
50%
60%
70%
80%
90%
100%
1947/48 1952/53 1957/58 1962/63 1967/68 1972/73 1977/78 1982/83 1987/88 1992/93 1997/98 2002/03 2007/08
Completed upper secondary education (as % of population 19 yr old) Completed tertiary education (as % of population 25 yr old)
Source: Central Bureau of Statistics official statistical data series on education, birth, and infant mortality. Esti- mates for cohorts born prior to 1948 from the 1953 Census and Steinman (1965).
As the normative standardization of education via legal acts increased, the management and oversight of education devolved from being planned and enforced at state level. Decentralization of responsibili- ties for the education system devolved from federal Yugoslav to Croatian republic level as early as 1951. Individual schools were governed by school councils from 1955, reformulated under a self- management principle as "labour communities" in 1963, and were granted additional autonomy in 1974 as "organizations of associated labour" (organizacija udruženog rada – OUR). At the time, schools as providers of education services, together with other OURs representing users of educa- tional services formed the self-management interest associations (samoupravna interesna zajednica –
SIZ), where members jointly resolved issues related to education under the model of "negotiated economy".1 SIZ bodies were formed following the geographical criteria for compulsory education and functional criteria for higher levels of education. Under such institutional settings, schools varied in ways their operational programmes and statutes were designed and applied, as well as regarding the levels of their funding. At the same time, the state did not directly mandate entry quotas or external exams at any level (Potkonjak, 1980). Such decentralization and self-management under Yugoslav socialism stands in clear contrast to the highly centralized education systems in other CEE socialist countries of the time (Kogan et al., 2008).
Education ranked high on the agenda during communism, as the socialist Yugoslav regime itself was founded upon the promise of overcoming social differentiation and promoting mobility and moderniza- tion, while diverging from the standard Soviet recipe. Therefore, hardly a year passed without a new high-level resolution or law concerning education (Klemenović and Milutinović, 2002, 2003). Since the 1950s, the reforms were mainly concerned with overcoming the duality between the vocational and academic tracks of the educational system, enhancing vertical and horizontal mobility, and lifelong learning, while searching for the appropriate formula for self-management of educational institutions.
The most radical reform was conceived in the mid-1970s and fully put into effect in 1981, labelled "ca- reer-oriented education" (usmjereno obrazovanje), as it nominally abolished tracking and school dif- ferentiation after compulsory education.
2.2 The education system after 1990
By the end of the 1980s, "career-oriented education" was slowly abolished in practice, the number of students at the tertiary level was decreasing, and youth without previous work experience comprised about half of all registered unemployed. The gymnasium courses were re-introduced in 1990, and in 1991, the Croatian educational system effectively reverted to its 1958 setup, with three tracks of upper secondary and two tracks of tertiary education in place.
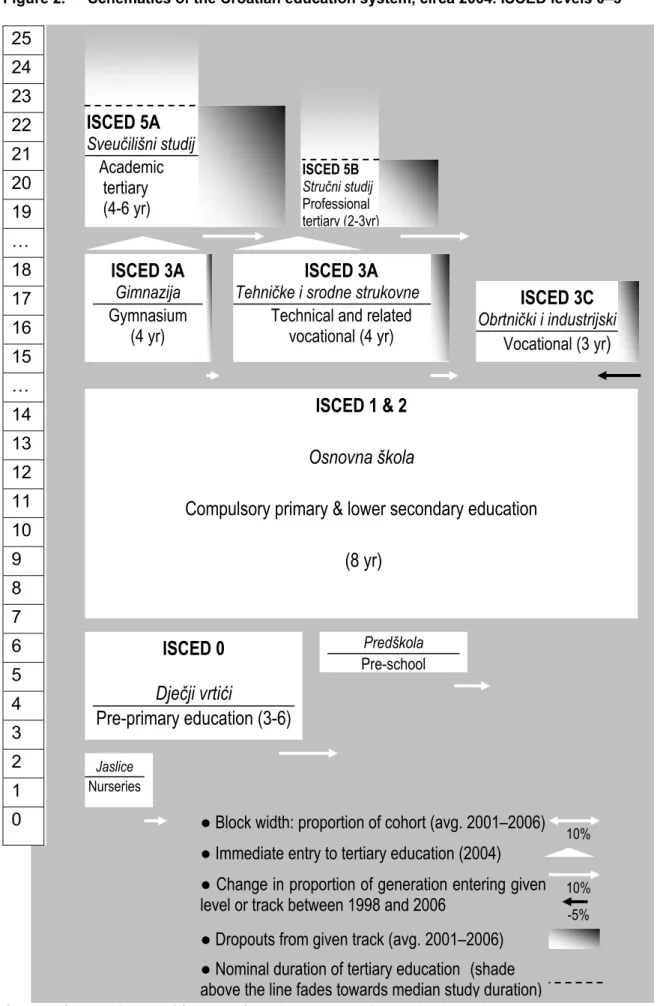
Despite several revisions of the legal framework, between 1992 and 2010 there were no reforms sub- stantially affecting the structure of primary, lower, or upper secondary education (ETF, 2006: 19), apart from the introduction of dual vocational courses in 1997. Tertiary education was reformed in line with the Bologna requirements, but since the first generations involved have only enrolled in 2005, there is little evidence thus far about the outcomes of the bachelor/master cycles. This entire set-up is portrayed in figure 2.
1 For a more detailed discussion about the nature of mature Yugoslav socialism with its "negotiated economy"
and its divergence from centrally planned economies, see Brus and Laski (1991), Lydall (1984).
Figure 2. Schematics of the Croatian education system, circa 2004. ISCED levels 0–5
Sources: Croatian Bureau of Statistics. Statistical reports on Basic schools and kindergartens, secondary schools and students' boarding homes, higher education and students.
ISCED 5A Sveučilišni studij Academic tertiary (4-6 yr)
ISCED 5B Stručni studij Professional tertiary (2-3yr)
ISCED 0 Dječji vrtići
Pre-primary education (3-6)
Predškola Pre-school
ISCED 1 & 2 Osnovna škola
Compulsory primary & lower secondary education (8 yr)
ISCED 3A Gimnazija Gymnasium
(4 yr)
ISCED 3A Tehničke i srodne strukovne
Technical and related vocational (4 yr)
ISCED 3C Obrtnički i industrijski
Vocational (3 yr )
Jaslice Nurseries
● Block width: proportion of cohort (avg. 2001–2006)
10%● Immediate entry to tertiary education (2004)
● Change in proportion of generation entering given level or track between 1998 and 2006
● Dropouts from given track (avg. 2001–2006)
● Nominal duration of tertiary education (shade above the line fades towards median study duration)
10%
-5%
25 24 23 22 21 20 19
… 18 17 16 15
…
14
13
12
11
10
9
8
7
6
5
4
3
2
1
0
Compulsory education in Croatia starts fairly late, between the ages of 6 and 7, preceded by kinder- garten, or a short pre-school preparatory course. Coverage with regular pre-primary education is among the lowest in Europe and is unevenly distributed regionally (Matković, 2007; OECD, 2001).
Primary and lower secondary levels are joined together in eight-year public territorially based elemen- tary schools with a common standardized program. At this level, the presence of private institutions is negligible (0.2%).
Currently, there are three main types of upper secondary education. On the general education track there is a four-year gymnasium (gimnazija), resurrected after the 1981–1990 hiatus. It comes with some variation in curricular accent (general, science-mathematical, language-oriented, classical gym- nasium), but no vocational education component. This track belongs to ISCED level 3A, as it provides general education and is designed to provide competences and credentials for direct access to aca- demic tertiary education.
The technical and related (tehnički i srodni) programmes comprise the second track of upper secon- dary education. Those are four-year courses in fields like business and administration, nursing, ser- vices and engineering. Nominally vocational, technical schools belong under the auspices of the Agency for Vocational Education (Agencija za strukovno obrazovanje – ASO). Courses provide a mix of general and vocational subjects, and their pupils are both better equipped and more likely than gymnasium graduates to enter the labour market or professional tertiary education after graduation, making this track close to ISCED 3B with regard to outcomes. Yet the final exam certificate from tech- nical courses is valid for application to any tertiary education institution, so these graduates are for- mally classified under ISCED 3A (Wisniewski et al., 2003; OECD, 2001; ETF, 2006; ASO, 2006).
Craft and industrial (obrtnički i industrijski) vocational programmes are the final two major options for upper secondary education in Croatia.2 Those are both three-year labour market oriented programs with a substantial amount of practical training and very limited direct access to tertiary education.3 This formally groups both into the ISCED 3C track. Yet the craft vocational programmes lean towards the dual system with an accent on employer-based apprenticeship placements, whereas the industrial programmes are primarily school based.
Both four-year gymnasium and technical upper secondary tracks provide an opportunity for entry into tertiary education. Tertiary education in Croatia follows the binary tradition of professional and aca-
2 About 1% of the cohort participates in special education for disabled children, whereas about 2% of the cohort participates in art (music or dance) schools, but in most cases, simultaneously with some regular upper sec- ondary school. Additionally, there are some regular lower secondary vocational programmes (1 or 2 years), but with less than a hundred placements offered, which mostly remain unfilled.
3 Post-secondary qualifications exclusively connect to craft vocations and provide certificates needed for legiti- mately running businesses in those crafts, legally defined as "related" or "privileged". Master’s degrees are not included in the scheme in fig1, as there are no courses or formal education leading to this level, but only the examination under the oversight of the Chamber of Crafts for these examinations. The number of students passing such certification exams and getting the "master craftsmen" certificate has increased to about 1000 (about 10% of craft-education graduates) (HOK, 2008).
demic tracks, with low permeability between the two. Pre-Bologna academic tertiary education (sveu- čilišni studij) is comprised of four- to six-year courses taught at public universities. The professional studies (stručni studij) had a duration of two to four years and were taught within public or private poly- technics (veleučilišta), schools of professional higher education (visoke škole), or university faculties.
An academic diploma could lead to masters' courses and doctoral candidate status.4
2.3 Vertical dimension of the education system
Since the late 1990s, almost the entire cohort has enrolled in one of the upper secondary courses (see fig. 5, topmost lines). Roma are the only substantially sized minority5 severely underrepresented in school participation, as the majority still fail to complete compulsory lower secondary education, de- spite some improvements seen in the 2000s.
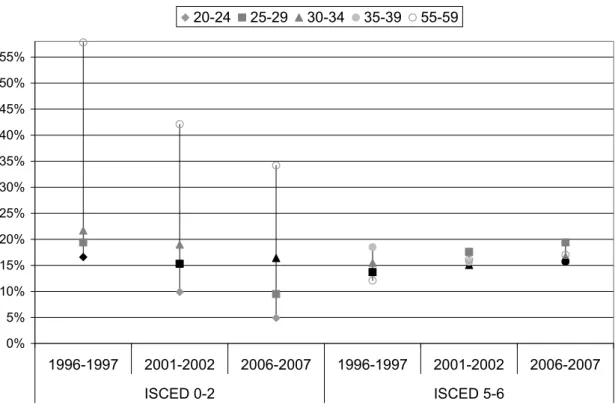
In Croatia, the early transition came coupled with the war (1991–1995), disrupting the education ca- reers of a large number of students and causing considerable migration within and out of Croatia.6 The net result in terms of education for the affected cohorts is shown in figure 3, based upon LFS data taken a decade apart.
Whereas the trend of completion of upper secondary education continued improving slowly even amongst the cohorts aged 15–19 during the war (fig. 1 and fig. 3), it grew considerably among those who entered upper secondary education in the late 1990s, after the war. More recently, LFS estimates of early school leavers in the 2002–2008 period averaged 5.5% of the cohort, positioning the early school-leaver rate in Croatia amongst the lowest in Europe.
As for tertiary education, there were fewer graduates amongst the war-affected cohorts than in any other neighbouring age group – a legacy that follows this cohort a decade later, as their catch-up in tertiary education was rather weak. The overall 1980s decline in tertiary education participation is manifested in the 1996–1997 observation point as a compression of tertiary education achievement over age groups and its lower prevalence among 25–34-year-old cohorts than among those aged 35–
39. This retrenchment led to the point when cohorts born three decades apart (age groups 25–29 and 55–59 in 2001–2) had the same share of tertiary education graduates. This is a pattern shared with neighbouring countries such as Italy or Austria, where after the expansion in 1960s, the share of the cohort with tertiary education remained rather limited (Müller and Wolbers, 2003) up until the 1990s.
There is some evidence of recent improvements among the youngest cohorts, visible in the most re-
4 Institutional setup following the Bologna process implementation is not discussed here as all the educational and labour market outcomes observed in this paper relate to the period prior to entrance of "Bologna gradu- ates" into the labour market.
5 According to census 2001, Roma comprise about 0.2% of population in Croatia, although official estimates stand at about 1%, whereas among school age population this is likely about 2%.
6 Based upon Census data, between 1991 and 2001, about 5.5% of population resident in 2001 immigrated from Bosnia during the previous decade, whereas about 11.5% (480000) emigrated, about half of this figure comprised of Croatian Serb minority (Gelo et al., 2005).
cent observations (figs. 1 and 3), but this will become more evident from the following discussion.
Figure 3. Share of individuals having attained less than upper secondary (ISED 0–2) and tertiary (ISCED 5–6) education by age group and period
0%
5%
10%
15%
20%
25%
30%
35%
40%
45%
50%
55%
1996-1997 2001-2002 2006-2007 1996-1997 2001-2002 2006-2007
ISCED 0-2 ISCED 5-6
20-24 25-29 30-34 35-39 55-59
Note: Black filling represents age group whose education transitions have coincided with the war.
Source: Croatian LFS. Population not in education (cf. Müller and Wolbers, 2003: 38–40).
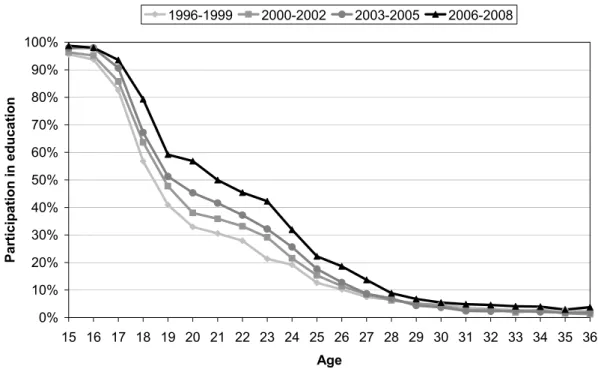
The expansion of educational participation over the past decade is best illustrated in figure 4. When education participation is plotted against age for different periods, the share of 15–16 year olds out of education was halved between the late 1990s and late 2000s. The major expansion happened among those aged 17 and 18, due to an increased participation in four-year long upper secondary courses like technical schools and gymnasiums. The decennial increase in education participation among the 19–24 year olds is even greater and speaks of the recent expansion of tertiary education.7
7 The same comparisons made during the secondary education expansion in the 1950s and 1960 portrayed very similar developments during the decade, but five years earlier in the life cycle (Steinman, 1966: 46). At that time, participation increased in similar patterns among 11–17 year olds.
Figure 4. Education participation by age: recent trends
0%
10%
20%
30%
40%
50%
60%
70%
80%
90%
100%
15 16 17 18 19 20 21 22 23 24 25 26 27 28 29 30 31 32 33 34 35 36 Age
Participation in education
1996-1999 2000-2002 2003-2005 2006-2008
Source: LFS, 1996–2008 (cf. Couppié and Mansuy, 2003: 66–67).
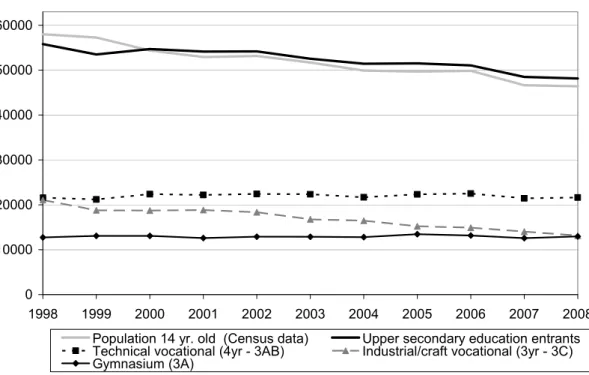
Demographic data corroborate such developments. The absolute number of births started to decrease after 1980, due to a fertility drop coupled with the exit of post-war baby boomers from reproductive age. This resulted in the reduction in size of school-leaver cohorts around the turn of the century, while the 2001 census data indicate that the size of the 18-year-old cohort resident in Croatia was about to decrease by 17% between 2002 and 2009. This trend is to continue into the next decade as war-born baby-busters of the early 1990s come of age. The demographic crunch has led not only to considera- bly more favourable teacher-to-pupil ratios in upper secondary education (ASO, 2006), but also to rapid change in the structure of upper secondary education. While the number of placements offered for all three tracks of upper secondary education during the past decade remained the same year-on- year,8 cohorts born post-1980 were less numerous year-on-year; so producing a persistent "surplus"
of total placements. Candidates were "voting with their applications", preferring to enrol in more selec- tive tracks, so that the entire demographic decline affected only the number of students in the three- year industrial and craft vocational schools, resulting in an considerable 36% decline in the number of entrants to ISCED 3C courses between 1998 and 2008. At the same time, the absolute number of pu- pils in other tracks remained stable, thus increasing their share in the cohort (fig. 5, arrows in fig. 2 for relative changes in composition). In this fashion, the demographic bust upgraded the vertical structure
8 The rigidity in the entry quotas can be traced to the institutional setup of a quota approval system for upper secondary education. Schools themselves propose the quotas to counties, counties forward them to the Minis- try of Education and the ministry approves them (ASO, 2006).
of upper secondary education output towards ISCED 3A. At the same time, the numbers of candidates eligible for entry into tertiary education was not reduced.
The number of tertiary education graduates was in decline from 1983 and persisted during the early transition, dropping by 30% between 1983 and 1996. The turning point arrived with the 1993 Higher Education Act. At this point, a major commercialization momentum was introduced by allowing public institutions of higher education to arbitrarily introduce additional enrolment quotas for fee-paying stu- dents (Juroš, 2006). This, at the same time, eased higher education institution-funding claims on the government and enabled growth of tertiary education with less budgetary strain. In such a fashion, commercialization of tertiary education led to an increase in placements that was met with adequate demand from secondary education graduates. Therefore, a large expansion ensued (see figs. 1 and 4). Whereas in 1996, (the first post-war year) 25,860 upper secondary education graduates entered tertiary education, a decade later this number grew to 38,498. In the same period, the share of tuition- paying for the part-time students grew from 15% in 1994 to 55% in 2006, in developments similar to ones observed in other transition countries (Kogan and Unt, 2005). Due to the long tertiary study cy- cle, the increase in number of graduates picked up only circa 2002, yet from this point it increased by a substantial 44% until 2008, to about 35% of the cohort (fig. 1).
2.4 Institutional traits of the education system
2.4.1 Stratification and track differentiation
Selection to upper secondary education in Croatia is competitive and exclusively merit-based, with schools ranking candidates for admission according to candidate GPAs from relevant subjects in the final two years of lower secondary education. This is a long-standing feature of the Croatian education system that has persisted through the regimes. Therefore, there is a strong selection by school ability at this point. In gymnasiums, the entry threshold is the highest and quotas fill up fastest.9 In technical schools, entry thresholds are moderate and most entry quotas are fulfilled. In many craft and industrial schools, entry is unconditional, yet a considerable number of vacancies remain, as this is the only track that offers no prospects for further education. Once one track is entered, there are minimal op- tions for switching to another track or field of study, and very few students actually make such transi- tions, especially in an upward direction (Wisniewski et al., 2003).
Secondary education tracks are additionally stratified by outcomes. Three tracks vary in completion rates and realized transitions to tertiary education (scaled overview in fig. 2). Dropout rates are rather low and robust over the years with about 4–5% for gymnasium students and 8–9% for technical- school students. Only in the short vocational tracks has the dropout rate increased from 11% in 2001 to 17% in 2008, as numbers of the enrolled dwindle (fig. 5) and selection into this track becomes in-
9 About 1% of the cohort attends private gymnasiums or technical (mostly business) upper secondary schools, conditional on paying considerable tuition fees.
creasingly negative. As for transition to tertiary education, in both tracks that allow for it, immediate transition is a rather common career path. In 2004 and 2005 almost all gymnasium graduates (about 95%) enrolled in tertiary education in the same year, whereas this was true for about 65% of technical- school graduates (ASO, 2006). As numbers of gymnasium graduates has remained constant since the early 1990s, the expansion of tertiary education was fuelled with an increased enrolment of technical- school graduates in tertiary education. This is a marked change in transition patterns compared to the 1957–1962 period, when the transition rate for gymnasium graduates was 86%, but only 32% for technical-school graduates (Steinman, 1965). Consequently, technical secondary schools might have functionally become second-rate general upper secondary schools,10 while technical-school graduates who had chosen not to continue to tertiary education became a minority adversely selected against for a perceived lack of academic competences or motivation.
Figure 5. Entrants to upper secondary education: total and by tracks for 1998–2007
0 10000 20000 30000 40000 50000 60000
1998 1999 2000 2001 2002 2003 2004 2005 2006 2007 2008
Population 14 yr. old (Census data) Upper secondary education entrants Technical vocational (4yr - 3AB) Industrial/craft vocational (3yr - 3C) Gymnasium (3A)
Sources: Croatian Bureau of Statistics. Statistical reports on secondary schools and students' boarding homes.
Therefore, stratification of upper secondary education in Croatia is best described as rather high.
There are three curricularly distinct, clearly ordered tracks that offer little mobility and different oppor- tunities for completion and for entering tertiary education. Yet, there are few factors moderating the stratification. Tracking happens only after eight years of comprehensive education; the dropout rate at
10 The claim that such schools provide field-specific skills usable for tertiary education has some merit, but not for everyone, as only 60–80% (depending on the field of study) of technical-school graduates pick a broad field of study that matches their previous secondary education (ASO, 2006).
upper secondary level is low and an ever-greater majority of pupils graduate from tracks that allow for tertiary education.
Stratification at the tertiary level stems not from formal entry barriers but from low completion rates and the high duality of the system – both long-standing features of the system. The completion rate increased only slightly in the 1990s and has reached about 55–60% in recent years (Matković, 2009a), not much higher than the 40–45% completion rates of the 1960s (Steinman, 1965). Additionally, dur- ing the transitional period, the number of admittances into professional tertiary education has grown faster than those into academic education (see fig. 2), so that by the late 2000s about 40% of first-year students were enrolled into less prestigious and shorter professional studies. Private institutions of ter- tiary education, regulated since 1996, have grown slowly, making up to 6.2% of the student body by 2009, but remain by and large accredited only for professional education.
2.4.2 Standardisation and quality differentiation
Standardization is defined as the extent to which the education system meets the same standards na- tionwide, such as in terms of budgets, curricula, and uniformity of school-leaving examinations or teacher training (Allmendinger, 1989). Up until 2005, standards were seldom revised and rather vague, but entirely administered and controlled by the ministry in charge of education. More recently, a part of standard-setting and the oversight function shifted to the Agency for Vocational Education, in- creasing the scope of the stakeholders involved. Training of teachers for academic subjects is highly regulated, but less so for vocational subjects (ETF, 2006). Funding and staffing decisions are mostly centralized, but to some extent rely on budgets of local government. Individual vocational programs are approved at national level, although some are being taught in just a few schools. A rather detailed curriculum for each programme is set up centrally, but teachers and schools have discretion to choose from an ever-growing array of textbooks for any subject. Pedagogical standards exist, yet individual institutions have sizable autonomy to modify the curricula and skew the standards to fit the resources available (Wisniewski et al., 2003). The final exams (matura in gymnasiums) follow the standardized broad curriculum items, but were, until 2010, conceived and conducted internally by the schools.
Therefore, the standardization dimension is best described as moderate, as the standards are set up centrally, but there is little external oversight or testing, and much discretionary ingerences are left at the local school level.
At the tertiary level, courses are fairly unstandardized. Apart from a broad legal framework specifying nominal duration and formal accreditation provided on a case-by-case basis, the course content is be- ing created at the departmental level while operational procedures are set up via a faculty statute at sub-university level. The Bologna framework has brought even greater heterogeneity of study content and regimes.
As for quality differentiation, traditionally there is a hierarchy of gymnasiums, but it is tacitly signalled by demand (GPA needed to get in), and not by any kind of performance or outcome evaluation. The National Centre for External Evaluation of Education has applied standardized tests among all secon-
dary education pupils since 2005, yet its findings are not released in a manner that could indicate quality differentiation. Among the vocational schools, programmes themselves might signal quality dif- ferentiation with regard to their placement requirement. At the tertiary level there is no formal instru- ment of ranking or quality evaluation of institutions, so ranking by ability of applicants, as well as pres- tige and tradition of institution is likely (e.g. Shwed and Shavit, 2006).
2.4.3 Organization of vocational training
Technical and vocational schools organize and accentuate vocational content in three distinct pat- terns. For one, there are technical and related schools where the curriculum comprises of a disjointed mix of general and professional subjects, and to a lesser extent, classroom and institutional practical training. The curriculum for general subjects is the same as one taught in gymnasiums, although there are fewer subjects included, and they are covered with fewer teaching hours.
Two true vocational tracks, industrial and trade programs and craft programs, are usually lumped in one whole for the purpose of statistical tracking. Both belong to ISCED 3C, labour market oriented education, but there are substantial differences between the two in organization of vocational training.
"Industrial and trade" courses provide a school-based vocational curriculum directed at placements inside industry and sales jobs. The practical workload comprises only about 40% of curriculum con- tent, mostly organized in school workshops and decoupled from real business practice. This regime, typical for vocational schools in most transitional countries (Kogan, 2008; Saar et al., 2008), draws from the model popularized since the 1950s and has remained mostly unchanged since the early 1990s. In recent years enrolment numbers in this track have rapidly decreased.
On the other side, there are "craft" schools that operate in a similar manner to their Slovene peers (Iv- ančič, 2008) along the lines of a dual system, with just a token number of general subjects. About two- thirds of the teaching load comprises of practical on-the-job training and apprenticeships within the crafts (or other licensed businesses). Such courses were the underdogs during communism, shunned by pedagogues and students, but craft schools were first retooled in the fashion of the dual system in 1996 and then reinstated again in 2003 under the auspices of the Croatian Chamber of Trades and Crafts. It took some years for the placement regime to start functioning, as the public response was initially less than enthusiastic (Wisniewski et al., 2003). In recent years, the majority of pupils in craft programmes have extensive experience of contracted apprenticeship training within their occupation (OECD, 2001; ETF, 2006; ASO, 2006) and most vocational programmes were retooled in this fashion.
The level of vocational specificity of the educational system might be approximated by the number of vocational courses available (Shavit and Müller, 2000) and by the dispersion of students among them.
The "career-oriented education" of the 1980s was often criticized for overt specialization and a myriad of oblique profiles it produced. This legacy has continued well into the transition, with 438 specializa- tions listed in 2000, decreasing to 170 active vocational profiles at the secondary level in 2006 (ASO, 2006; OECD, 2001). The average number of pupils per specialization is higher in technical and related
schools than in craft or industrial vocational schools. Coupled with more specific training, this might warrant greater vocational specificity for shorter vocational programs.
Linkages between the education system and employers from either the public or private sector are in practice very weak in all but craft programs. In principle, programs and the curriculums of vocational education are overseen by the National Vocational Councils for each of 13 vocational fields. Their role is mostly consultative, with some influence over the curriculum, but none when it comes to admission quotas. In each field the council includes some employer representatives from key enterprises, while others are represented indirectly by a member of a trade body or chamber of commerce. There is little formalized coordination at the local level, apart from apprenticeship placement listings for craft courses. Despite that, out-of-school training in organizations has persisted at all levels, unlike devel- opments in most transitional countries (Kogan, 2008; Saar et al., 2008). While such training is in no way as workplace-integrated as for craft dual-system apprentices, most pupils attending industrial or technical courses do attend some out-of-school training. On the tertiary level, there are no bodies link- ing education institutions and employers. As business–university cooperation depends solely on the initiative of individual institutions, linkages formed in this way are few and weak.
3 Structural and institutional setup of the Croatian labour market
Croatian labour market developments have been discussed in detail within several recent publications (Crnković-Pozaić, 2007; Franičević, 2008; Xubei, 2007), so this section will only briefly cover the points commonly considered relevant to labour market entry.
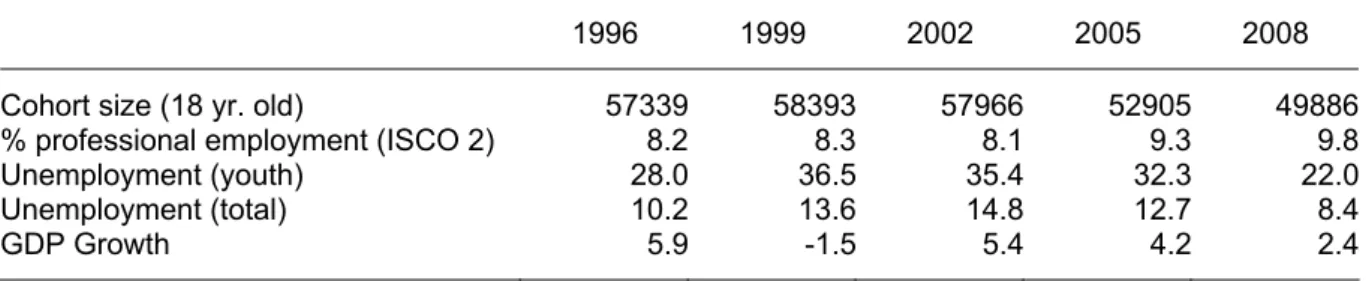
Table 1. Labour market and education indicators 2002–2008
1996 1999 2002 2005 2008
Cohort size (18 yr. old) 57339 58393 57966 52905 49886
% professional employment (ISCO 2) 8.2 8.3 8.1 9.3 9.8
Unemployment (youth) 28.0 36.5 35.4 32.3 22.0
Unemployment (total) 10.2 13.6 14.8 12.7 8.4
GDP Growth 5.9 -1.5 5.4 4.2 2.4
Source: Eurostat, Croatian Central Bank, Croatian Statistical Office.
The first decade of transition was marked by war following the breakup of Yugoslavia (1991–1995), by isolation and delayed transition due to an authoritarian government in power, as well as the crisis of the late 1990s. On the other hand, the second transitional decade was a period of reform implemented and steady economic growth (table 1), as the gross domestic product between 2002 and 2007 in- creased for about 5% annually. The unemployment rate, rising since the mid-1990s, peaked in 2002 at 14.8%, then slowly decreased to 8.4% by 2008 (fig. 6). Such an occurrence is usually beneficial for labour market entrants (Blanchflower and Freeman, 2000; Gangl, 2003a). There is some evidence
that the process of occupational upgrading took place mostly in professional occupations that might offset some displacement pressures from the swelling of the ranks of tertiary education graduates (Gangl, 2003a). The demographic size of the labour market entrant cohort has started decreasing since the turn of millennium, and this process is about to continue, potentially enhancing chances for a smoother labour market entry for new entrants (Blanchflower and Freeman, 2000; Korenman and Neumark, 2000; but cf. Gangl, 2003a).
Slow but steady advances in transition towards the functional market economy since the mid-1990s are visible in the majority of EBRD transition indicators (EBRD, 2009) and World Bank governance in- dicators (Kaufmann et al., 2009). As pre-transitional Croatia had specific regulation of its industrial re- lations designed to fit the self-management paradigm, labour market regulation underwent relatively small changes at the beginning of transition. The first wave of labour-law reforms fully adjusting labour market regulations to the market economy happened in the mid-1990s, yet these regulations remained rigid and highly protective towards insiders (Rutkowski, 2003). In the early 2000s a new batch of laws liberalized the labour market further. The Act on Job Placement and Unemployment Insurance of 2002 introduced stricter job-search and disposition requirements for individuals to qualify as formally unem- ployed persons. In 2001, a new Labour Code was introduced, but it took until the summer of 2003 for some critical issues related to the strictness of provisions regarding hiring and firing to become settled among the relevant social partners, resulting in a first major revision that decreased the Employment Protection Legislation (EPL) Index for Croatia from 3.6 to 2.7 (Matković and Biondić, 2003). Even so, the EPL calculated following the OECD methodology remained one of the most restrictive among transitional countries (Tonin, 2005). The change followed the "partial deregulation" route, as it was most pronounced in temporary employment protection, which dropped from 4.1 to 2.6. Consequently, the prevalence of temporary work among employees has risen from 9.8% in 1996–1998 to about 12.5% in 2006–2008; with seasonal and casual work giving ground to fixed-term contracts (cf.
Crnković-Pozaić, 2007; Matković and Šošić, 2007). High EPL is consistently found to be associated with a greater structuring capacity of education with respect to occupational destinations and pro- tracted job searches, if not coupled with strong employer–education linkages (Breen, 2005; Gangl, 2003d; Van der Velden and Wolbers, 2003; Wolbers, 2007). The minimum wage is known to hinder labour market entry for less educated youth (Ryan, 2001), unless there is a special youth sub-minima.
In Croatia, up until 2008, the minimum wage used to be regulated indirectly in terms of minimal social- security contributions based on 35% of the average wage, with no sub-minima provisions for young workers.
Labour market flexibility is rather high with respect to worker and job turnover and use of temporary contracts, especially in the small and medium enterprise (SME) sector. Almost half (46%) of employ- ees in the private sector are working in micro-enterprises employing twenty or less workers, where ca- pacities for training (and retention of employees in bad times) are limited. Yet, wage flexibility, internal flexibility, job and worker mobility are rather low (Matković and Šošić, 2007). Union-membership den- sity is about 35–40%, mostly in the public sector, while collective bargaining is estimated to affect 50–
60% of employees and is mostly negotiated at the company level (Grdesic, 2008). Public-sector em-
ployment decreased from 64% to 39% of all employees between 1996 and 2008. Self-employment is rather high and stable at about 15% (two-thirds of this in agriculture), while employers comprise about 5% of all persons in employment (Matković, 2009b).
Labour market and social policies are not likely to have had an effect on the dynamics of youth labour market entry, as unemployment benefits are conditional on previous work experience and social assis- tance is household-based. Like in other transition countries (Cazes and Nesporova, 2007), expenses for active labour market policies in Croatia were very modest in scope and expenditure through the transitional decades.11 Though, the measures affecting youth accounted only for a minor part of that (Šošić, 2005; Matković, 2008a).
The evidence for positioning Croatia within either the occupational or internal labour market camp (Marsden, 1999) is inconclusive. In general, employers rank occupational skills provided by the educa- tion system as insufficient, but when recruiting they still state their employee needs in occupational terms. In addition, when surveyed, employers give a fairly high importance to occupation-related skills, but at the same time they highly value some "soft skills" or job-related attitudes (ETF, 2006; Pološki Vokić and Frajlić, 2004). As mentioned before, there is little employer involvement in curriculum devel- opment. There are legally regulated qualifications or certification requirements for work in many occu- pations, from professions in crafts to those in the civil service. Public-sector employment is highly cre- dentialized, but often not overtly occupationally specific.
4 Hypotheses
The following analysis will touch on three sets of questions. The first is related to similarity to countries with shared institutional backgrounds. The second involves questions as to whether labour market en- try dynamics and differences are in line with patterns theoretically expected and empirically estab- lished in other countries based on their institutional traits. Lastly, as the period observed spans over twelve turbulent years, in an environment of changing labour market conditions, structure and regula- tion, the analysis will set forth to establish the differences between entry patterns for cohorts entering the labour market at different time points.
1) Following the assumption of path dependency, common institutional heritage should lead to similar- ity in outcomes. Initially, the Croatian education system was established and shaped within the Austro- Hungarian Empire, with a pronounced Hungarian influence. This should warrant there being similari- ties in the structuring of entry into the Croatian labour market with those structures present in Austria (development model until 1918) and Hungary (political control until 1918, socialist 1945–1991). Later on, during the majority of 20th-century Croatia used to be a part of Yugoslavia (1918–1991), following the socialist path since 1945. As the education system matured and expanded and labour market insti-
11 Activation measures in Croatia involved only about 2-8% of unemployed persons per annum and used up 0.05%-0.2% of GDP (Matković, 2008a).
tutions developed within this common state, substantive similarities are to be expected with Serbia (shared state, 1918–91) and, in particular, with Slovenia (education system developed within the same empires and states all the way up to 1991) due to their historical institutional proximity.
2) Croatian education system has a rather high level of stratification, coupled with high vocational specificity, but next to no linkages with employers and workplace-based training (apart from the rather recently revived "crafts" track). Stratification should lead to high differences in outcomes with respect to job status (Müller and Shavit, 1998; Wolbers, 2007). Despite high vocational specificity, the weak employer linkages and absence of workplace-based training make it unlikely that competencies sig- nalled by vocational credentials will be translated into smooth school-to-work transitions. Coupled with a rather high EPL, the outcomes are likely to be similar to the "Mediterranean" pattern of high youth unemployment and prolonged job search, especially for those without tertiary education (Breen, 2005;
Gangl, 2003b; Iannelli and Soro-Bonmatí, 2003; Müller, 2005; Van der Velden and Wolbers, 2003). As for the outcomes associated with upper secondary education tracks, if the main signal they provide to the labour market is their ability based selection and trainability, then of all the observed outcomes, the most adverse will be found among graduates of the least selective vocational track, followed by tech- nical-school and gymnasium graduates. However, if vocational credentials provide some kind of
"safety net" (Shavit and Müller, 2000) and relevant skills, the more vocationally specific track where
"employment logic" predominates the curriculum (Iannelli and Raffe, 2007) would hold some advan- tage in terms of the speed of job matching.
3) Economic recovery in the mid-2000s, coupled with a decreased cohort size is likely to have sub- stantively improved labour market entry outcomes (Gangl, 2003a; Van der Velden and Wolbers, 2003), while the crisis should have led to difficult entry for the 2000–2001 cohort. At the same time, the partial deregulation of employment protection is likely to have contributed to an increase in the dy- namics of entry into the labour market. This translates into a reduction of unemployment in the early career years, but an increase in job precariousness, weaker entry positions and stronger catch-up for more recent cohorts (Gangl, 2003d; Wolbers, 2007). Due to a limited number of time points, it is not feasible to analytically model or disentangle these structural and institutional effects. Yet, as all three are expected to affect entry dynamics of recent school leavers in a similar way, and since all three hit only after 2002, their effects should be visible for the most recent cohort. With respect to EPL and educational expansion, it is to be expected that Croatia switched from an "Italian" to a more "Spanish"
pattern of labour market entry between the mid-1990s and mid-2000s (Iannelli and Soro-Bonmatí, 2003).
4) During the observed period, considerable educational expansion transformed the educational struc- ture of school-leaver cohorts and some displacement effect is likely (Gangl, 2003a). As educational expansion was faster than occupational upgrading, a decrease in advantage of tertiary education graduates with respect to job-search advantage and job quality is likely. In Croatia, during recent years, the least prestigious tracks are likely to suffer in terms of greater unemployment, unless there is a vocational niche where occupationally specific credentials can shelter them.
These four points of interest will be explored within three topical chapters on school-to-work transition patterns, dealing respectively with (1) activity and unemployment, (2) occupational destinations, and (3) job precariousness and stability.
5 Data sources and methodology
The majority of description and analysis presented in this paper is based upon the Croatian Labour force Survey (LFS) microdata. The LFS was introduced in Croatia in 1996, took up monthly dynamics in 1998 and implemented panel design in 2007. Since 1998, the LFS annually surveys about 1% of the Croatian population. In line with previous research, recent school leavers are defined as persons who left education for the first time up to five years ago. All the analytical effort has been carried out for this group, but some descriptive figures plot year-by-year aggregate outcomes over the entire first decade since leaving education, thus displaying dynamics within the extended period until a stabiliza- tion of career is reached.
The analytical sample sums up to between 1827 and 2389 recent school leavers for each of twelve years observed. Yet, when disaggregated by years of labour market experience (typically not more than 400 in the cohort) and level of education, the numbers plummet and so does the reliability of the estimates. In order to increase reliability and overcome the repeated cross-sectional nature of the LFS data, two approaches are taken. When focusing on dynamics of lifecycle effect with respect to dura- tion since leaving education, all the observations from the most recent period (2004–2008) are pooled.
The pooling itself moderates period and cohort effects, while producing a subsample large enough for reliable comparisons between educational groups, although such an organization of the data is still cross-sectional in nature, and not fit for observing changes due to period or cohort effects (while still being possibly biased by them). To address this issue, the LFS data can be organized to compose the synthetic cohorts from persons leaving education in a certain year, by following the same cohort over the surveys as it gathers labour market experience (Gangl, 2003c), thus forming data which is longitu- dinal at the population level. This approach is used to compare entry patterns of early years on the la- bour market for three entrant cohorts – those entering in the early post-war period (1996–8), at the peak of the crisis (2000–1) and at time of flexibilization, recovery and educational expansion (2003–4).
The critical event for the “recent school-leaver” approach is the time of leaving education and it merits some discussion with respect to LFS design. Since 2004, the year of completing the highest achieved education degree is collected directly via the LFS questionnaire and can be used directly as a fairly valid measure after correcting for completed years for students who dropped out of education. This in- dicator is used when analysing the pooled 2004–2008 data. Before 2004, time of exit from education had to be imputed just as in previous LFS-based comparative work (Gangl, 2003c). The imputation is based on the reported years of completed education, achieved degree and typical graduation age.
Due to the possibility of prolonged education, gap years or return to education, such estimates are
likely to be downward biased for a part of the population under consideration.12 Additionally, imputed values are likely to be less reliable for the tertiary educated because of a greater spread in graduation ages in this group. An imputed measure was used when data from the complete observation frame (1996–2008) was needed. In order to warrant validity, analyses were replicated with reported school- leaving data from 2004–2008 and both measurements proved largely robust with respect to observed outcomes.
Activity, unemployment and employment status were coded as per International Labour Organization (ILO) definitions, while occupational, sectoral and educational categories follow the broadest catego- ries of Croatian adaptations of respective international classifications (ISCO-88, ISIC rev.3 and ISCED). The occupational status is expressed through the International Socio-Economic Index of Oc- cupational Status (ISEI) score (Ganzeboom and Treiman, 1996) derived form 4-digit ISCO codes, while precarious employment was defined following up Kogan and Schubert (2003) as involuntary part-time or fixed-term employment (where respondents stated that they took it up because they could not find a full-time or permanent job), but extended to informal employment and unregistered self- employment.
6 Transitions from school to work
During the socialist period, Yugoslavia had a peculiar decentralised and socialised self-management system where economic activity used to be negotiated among a plethora of economic and political agents, including the quasi-independent banking sector (Grdesic, 2008; Lydall, 1984; Sekulić, 1987).
Unlike the planned-economy model, it did not command full employment and a certain level of unem- ployment was acknowledged and accepted. However, in such a system where workplaces were al- most textbook examples of closed positions (Sørensen, 1983; for Slovenia Ivančič, 2000), youth as outsiders were unlikely to get a job during the mounting economic crisis of the 1980s when the num- ber of jobs stagnated. With the unemployment rate rising to about 10% in the late 1980s, the 19–24 age group accounted for about half of total registered unemployment. At the time, up to a quarter of youth cohorts were unemployed, and this might have left some normative legacy.
Early transition brought a doubling of total unemployment between 1989 and 1991, but for the better part of the 1990s registered unemployment levelled off while the activity rate decreased due to the adopted early retirement policy, stalled privatization and wartime mobilization. Even in such condi- tions, in relative terms the youth were better off, as the registered number of youth in unemployment had barely increased in the first half of the 1990s and their share in the total unemployment category decreased substantially. This is the starting point for the period observed in this paper.
12 When imputation results were validated with reported data for 2004–2008, among persons completing educa- tion ten or less years ago, in 80.7% of cases imputations were correct or one year off, while 9.8% are correct within a two-year deviation. Underestimation of age on leaving education (and thus overestimation of labour market experience) is about twice as likely as overestimation. There is some concern about 5.1% of respon- dents for whom imputation severely underestimates their age of completing education.
6.1 Activity and unemployment
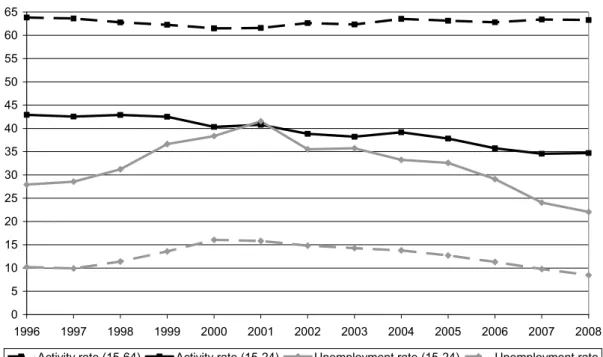
Since 1996, a year after the conclusion of the war in Croatia, the labour market trends are followed via the Labour force Survey. In general, the total activity rate was remarkably stable, dipping slightly only during the peak crisis circa 2000, but this masked two contrary trends. The youth labour market par- ticipation steadily decreased through the period, as education expanded. Though, general activity rate remained stable due to another steady trend of increasing labour market participation of the older co- horts, as retirement requirements became stricter (Matković, 2008b).
Figure 6. Youth and general labour market participation and unemployment rates, 1996–2008
0 5 10 15 20 25 30 35 40 45 50 55 60 65
1996 1997 1998 1999 2000 2001 2002 2003 2004 2005 2006 2007 2008 Activity rate (15-64) Activity rate (15-24) Unemployment rate (15-24) Unemployment rate
Source: LFS.
As for the unemployment rate, after growing for the second part of the 1990s, it declined steadily year- on-year from 14.8% in 2002 to 8.4% in 2008. However, youth remained the most exposed group, the risk of unemployment among youth aged 15–24 being 2.4–2.8 times higher than the general unem- ployment rate, with little evidence of the gap closing. Such outcomes are likely for countries with strin- gent employment protection and little coordination between employers and the education system (Breen, 2005), both conditions being applicable to Croatia. However, this indicator omits a substantial part of the school-leaver group, as the median graduation age is 24 and unemployment in this age bracket does not reflect the position of tertiary education graduates. In order to overcome this bias and compare labour market entrants at similar points in their career cycle, the outcomes are observed for recent school leavers; persons who left their initial education up to five years ago.
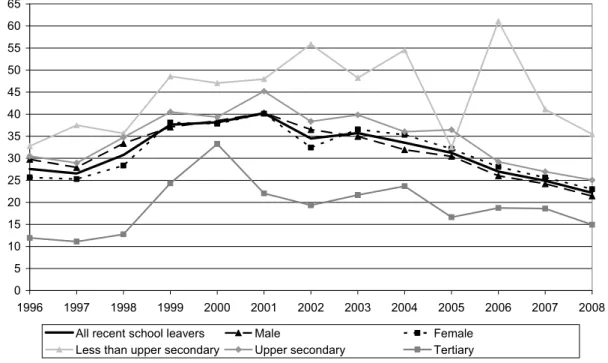
Figure 7. Unemployment rate of recent school leavers, by level of education and gender, 1996–2008
0 5 10 15 20 25 30 35 40 45 50 55 60 65
1996 1997 1998 1999 2000 2001 2002 2003 2004 2005 2006 2007 2008
All recent school leavers Male Female
Less than upper secondary Upper secondary Tertiary
Source: LFS.
Through the observed period, the trend in the unemployment rate of recent school leavers is rather similar to unemployment among 15–24 year olds. With respect to gender, it seems that throughout the period, male recent school leavers gained a slight advantage over their female peers. Variation be- tween graduates with different education levels is far more substantive, clearly separating secondary and tertiary education through this period. Yet, in line with expectations (hypothesis 4), during recent years, the growing ranks of the tertiary educated enjoyed progressively smaller relative advantage in terms of unemployment, while ever-decreasing numbers of entrants without upper secondary educa- tion have ever-worse chances of finding an employment starting point.
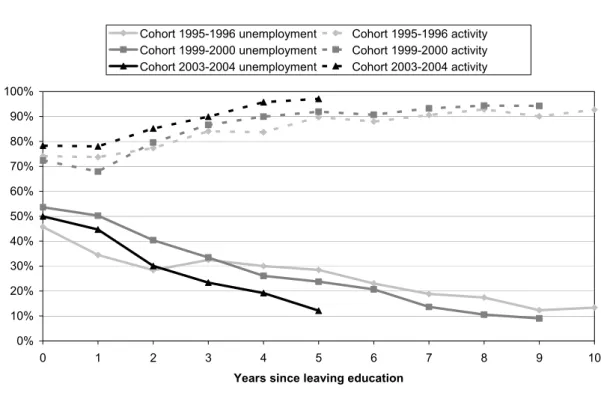
Labour market entry was not equally difficult for cohorts entering the labour market in times of growth or recession (fig. 8, table 2). The cohort leaving education in 1995–1996 did enjoy a rather good start and some benefits of early post-war recovery but their position worsened during the crisis in the late 1990s, both with respect to unemployment and activity rate. Youth who left the education system as the crisis peaked circa 2000 was least likely to become active and find a job during the first few years of their career. However, as the economy picked up in the mid-2000s, they caught up with the 1995–
1996 cohort about 3–4 years after labour market entry, marginally outperforming it. As for the most re- cent observed cohort who entered the labour market in the mature phase of the economic boom (and demographic bust), their activity rate seems to be highest of all. The unemployment rate amongst this cohort, while initially rather high, decreased substantially and continuously over the first five years af-
ter leaving education, up until 2008. Such developments are mostly in line with assumptions stated in hypothesis 3.
Figure 8. Unemployment and activity rates during the first decade of career for three syn- thetic school-leaver cohorts
0%
10%
20%
30%
40%
50%
60%
70%
80%
90%
100%
0 1 2 3 4 5 6 7 8 9 10
Years since leaving education
Cohort 1995-1996 unemployment Cohort 1995-1996 activity Cohort 1999-2000 unemployment Cohort 1999-2000 activity Cohort 2003-2004 unemployment Cohort 2003-2004 activity
Source: LFS.
With respect to gender differences (not shown), regardless of the cohort, the female participation rate starts as equal or higher than male (due to compulsory military service in force up until 2007), but starts lagging about four years after leaving education. Six or more years out of education, the female activity rate is about 86%, about ten points lower than the comparative male labour force participation.
Additionally, 5–9 years after leaving education, about one-tenth of employed women are taking mater- nity leave.