Pure Appl. Chem., Vol. 82, No. 6, pp. 1283–1299, 2010.
doi:10.1351/PAC-CON-09-09-20
© 2010 IUPAC, Publication date (Web): 20 April 2010
Modeling of the plasma chemistry and plasma–surface interactions in reactive plasmas*
Annemie Bogaerts
‡, Christophe De Bie, Maxie Eckert,
Violeta Georgieva, Tom Martens, Erik Neyts, and Stefan Tinck
PLASMANT research group, Department of Chemistry, University of Antwerp, Universiteitsplein 1, B-2610 Wilrijk, Belgium
Abstract: In this paper, an overview is given of modeling activities going on in our research group, for describing the plasma chemistry and plasma–surface interactions in reactive plas- mas. The plasma chemistry is calculated by a fluid approach or by hybrid Monte Carlo (MC)–fluid modeling. An example of both is illustrated in the first part of the paper. The ex- ample of fluid modeling is given for a dielectric barrier discharge (DBD) in CH4/O2, to de- scribe the partial oxidation of CH4 into value-added chemicals. The example of hybrid MC–fluid modeling concerns an inductively coupled plasma (ICP) etch reactor in Ar/Cl2/O2, including also the description of the etch process. The second part of the paper deals with the treatment of plasma–surface interactions on the atomic level, with molecular dynamics (MD) simulations or a combination of MD and MC simulations.
Keywords: computer modeling; fluid model; molecular dynamics; Monte Carlo; numerical simulation; plasma; plasma chemistry; plasma–surface interactions.
INTRODUCTION
Plasmas in reactive gas mixtures are used in a growing number of application fields, such as in materi- als technology and the microelectronics industry, but also for biomedical and environmental applica- tions. In the latter case, the plasma is used as a chemical reactor, for instance, to destroy volatile organic compounds, or to convert greenhouse gases into value-added chemicals. On the other hand, chemical reactions in the plasma also give rise to the formation of species that can react at a substrate, and this forms the basis of the applications in materials technology, such as plasma-etching and deposition of coatings.
To improve these applications, a thorough insight into the underlying plasma chemistry and plasma–surface interactions is of uttermost importance. We try to obtain this insight by computer sim- ulations. Several modeling approaches exist for plasmas, such as analytical models [1,2], fluid models [3,4], the Boltzmann equation [5], Monte Carlo (MC) [6,7], and particle-in-cell MC simulations [8,9], collisional-radiative (CR) models [10,11], as well as hybrid models, which are a combination of the above models [12–14]. For describing the plasma chemistry, fluid modeling is, however, the most suit- able approach, because a large number of plasma species and chemical reactions can be taken into ac-
*Paper based on a presentation at the 19thInternational Symposium on Plasma Chemistry (ISPC-19), 26–31 July 2009, Bochum, Germany. Other presentations are published in this issue, pp. 1189–1351.
‡Corresponding author
count without too much computational effort. This will be illustrated in the first part of this paper, for the application of plasma conversion of greenhouse gases to value-added chemicals.
On the other hand, for simulating in detail the behavior of the fast electrons, which give rise to the formation of the reactive species by ionization, excitation, and dissociation collisions, fluid model- ing is only an approximation, because it assumes that the plasma species are more or less in equilibrium with the electric field, and the latter is not really true for the fast electrons. This problem can be over- come by treating the fast electrons with an MC model, in combination with a fluid model for the other plasma species. Hence, a so-called hybrid model is also very suitable for describing reactive plasmas.
Moreover, some extra modules can be added in a hybrid model, for instance, to calculate the behavior of excited species in a CR model [15], or to calculate the energy and angular distributions of ions reach- ing the electrode, and to describe the etch process [12]. The results of such a hybrid model, as devel- oped by Kushner and co-workers [12], will be presented in this paper as well, including also some etch study results.
A more detailed description of plasma–surface interactions, on the atomic level, can be provided by molecular dynamics (MD) simulations [16,17]. This method, and some typical calculation results, will be illustrated in the second part of the paper, for the application of plasma deposition of thin films.
Moreover, to extend the time scale of MD simulations, they can be combined with an MC method, as will also be explained in this paper.
MODELING THE PLASMA CHEMISTRY Fluid modeling
In a fluid model, the different plasma species (i.e., electrons, various ions, molecules, and radicals) are considered as a group of individual particles. A continuity equation (based on different production and loss processes, defined by the chemical reactions) and a flux equation (based on diffusion and on mi- gration in the electric field, for the charged species) is constructed for each plasma species
In these equations, n, j, and Rstand for the species number density, flux, and production or loss rate. The index isymbolizes the different species. Eis the electric field, and μand Ddenote the mobil- ity and diffusion coefficient of the different species. Note that the mobility is taken as a positive value for the positive ions, and a negative value for the electrons (and negative ions, if included in the model).
For the neutral species, the first term is equal to zero.
For the electrons, also an energy balance equation is solved, based on energy gain from the elec- tric field (first term on right-hand side) and energy loss due to collisions (second term on right-hand side)
where we(= neεe) is the electron energy density and jwis the electron energy density flux, given by
Based on this average electron energy, the electron impact collision rates can be calculated. For the so-called heavy particles (i.e., ions, molecules, radicals) no energy balance equation needs to be
∂
∂n + ∇
⋅
= − ti ji Rprod Rloss ji =μi in E− ∇Di ni∂
∂w + ∇
⋅
= −⋅
+ te jw e je E Rw,lossjw = 5 w E− D ∇w 3
5 μe e 3 e e
solved, as they are considered in equilibrium with the gas temperature. These equations are coupled to the Poisson equation, to obtain a self-consistent electric field distribution in the plasma
where n+and n–are the sum of the positive and negative ion densities, respectively, and neis the elec- tron density.
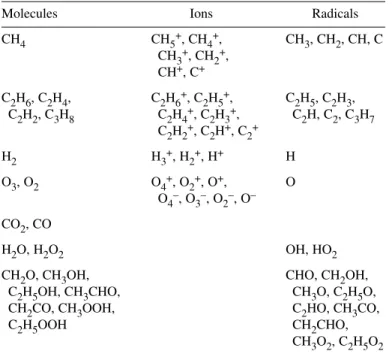
The example given here is for a cylindrical dielectric barrier discharge (DBD), used for the con- version of CH4into value-added chemicals, such as methanol (CH3OH) and formaldehyde (CH2O), by the partial oxidation with O2. To describe the chemistry in a CH4/O2mixture, 65 different species (in- cluding molecules, radicals, ions, and electrons) are taken into account in the model, as outlined in Table 1.
Table 1Overview of the different plasma species included in the fluid model for a CH4/O2gas mixture, besides the electrons.
Molecules Ions Radicals
CH4 CH5+, CH4+, CH3, CH2, CH, C
CH3+, CH2+, CH+, C+
C2H6, C2H4, C2H6+, C2H5+, C2H5, C2H3, C2H2, C3H8 C2H4+, C2H3+, C2H, C2, C3H7
C2H2+, C2H+, C2+
H2 H3+, H2+, H+ H
O3, O2 O4+, O2+, O+, O
O4–, O3–, O2–, O– CO2, CO
H2O, H2O2 OH, HO2
CH2O, CH3OH, CHO, CH2OH,
C2H5OH, CH3CHO, CH3O, C2H5O,
CH2CO, CH3OOH, C2HO, CH3CO,
C2H5OOH CH2CHO,
CH3O2, C2H5O2
In total, 659 different reactions were included in the model, including 112 different electron-neu- tral collisions (i.e., excitation, ionization, dissociation,…), 39 different electron-ion reactions (i.e., re- combination), and 508 different ion-ion, ion-neutral and neutral-neutral reactions. The details of the chemistry set will be published in a separate paper [18].
The fluid model applied for this study forms part of the PLASIMO modeling framework, devel- oped at Eindhoven University [19]. The electron impact reaction rate coefficients, as well as the elec- tron mobility are described as parameters dependent on the electron mean energy. These dependencies are calculated with the BOLSIG+ Boltzmann solver [20], which provides look-up tables for the mean electron energy, the electron mobility, and the reaction rate coefficients as a function of the reduced electric field. During the calculations, the mobility and rate coefficients can be applied, corresponding to the mean electron energy, as calculated with the electron energy balance equation given above. For the ions, the mobilities are calculated using the low-electric-field Langevin mobility expression [21].
The diffusion coefficients of the ions and electrons are calculated from their mobilities, using the Einstein relation. For the neutral species, diffusion coefficients are calculated with the Modeling of plasma chemistry and plasma–surface interactions 1285
∇2 = ⎡⎣ +− −− ⎤⎦
0
V e
n n n
ε e
Chapman–Enskog equation for binary gas systems, using characteristic Lennard–Jones parameters, adopted from [22,23].
Because the model is applied to a DBD, the effect of the dielectrics covering the electrodes needs to be taken into account. Therefore, the Poisson equation is not only solved within the plasma, but also inside the dielectrics, where it is reduced to
∇2V= 0
since no species are present inside the dielectrics.
Furthermore, the influence of charge accumulation on the dielectric materials is considered using Gauss’s law:
where E–
dielectricand E–
gasare the electric field inside the dielectric and in the gas discharge, respectively, u–nis the unit vector pointing normal to the wall with which charge accumulation takes place, and σis the surface charge density on the dielectric, calculated from the charged particle flux directed to the sur- face.
The coupled differential equations are solved by the so-called “modified strongly implicit method” [24], using an extra stabilization method, as explained in [25], until convergence is reached.
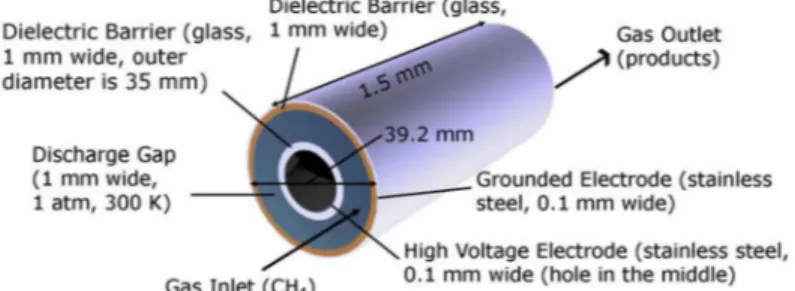
Figure 1 gives a schematic picture of the cylindrical DBD reactor, used in the simulations. It con- sists of two concentric electrodes, made of stainless steel. Both electrodes are covered with a 1-mm- thick dielectric layer (glass). The outer electrode is grounded, and the inner electrode is powered. The gas gap is 1 mm. The gas mixture under study is 80 % CH4and 20 % O2. The applied voltage is 10 kV, at a frequency of 50 kHz.
Typical results obtained with this model include the densities of the various plasma species, as well as the relative importance of their various production and loss processes. Moreover, information can be obtained about conversion of the gases and the yields and selectivities of the various reaction products, for different values of gas flow and length of the reactor (or in other words: residence time).
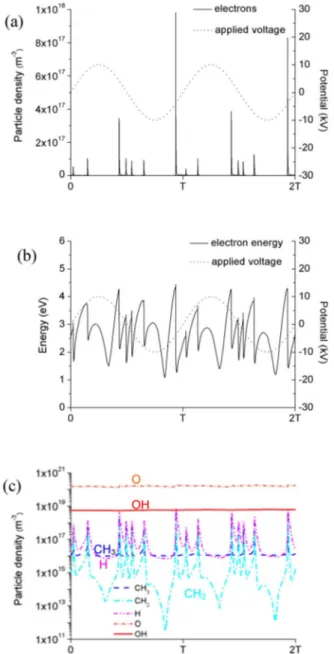
Figure 2 shows the calculated electron density, averaged over the entire reactor geometry, as a function of time during two periods (a), as well as the corresponding average electron energy (b), and the spatially averaged densities of the most important radicals (c). In each case, also the applied volt- age is illustrated (thin dashed lines). It is clear that the electron density (a) exhibits periodic behavior, with a few pronounced peaks per period. In between the peaks, the density does not really drop to zero, but is about three orders of magnitude lower (not seen on this linear scale). This electron density be- havior closely follows the temporal behavior of the electrical current, typically measured in DBD reac- tors [26]. The mean electron energy (b) also exhibits periodic behavior, and oscillates between values of 1 and 4 eV. A similar periodic behavior is also found for the radical densities (c), although the effect
εdielectric dielectricE
⋅
un−εgas gasE⋅
un=σFig. 1Schematic picture of the DBD set-up under investigation in the fluid model.
is more pronounced for some radicals (e.g., H and CH2) than for others, such as O and OH. This dif- ference is related to the different production and loss processes for the species, e.g., species directly pro- duced by electron impact reactions will also show more oscillating behavior than other species pro- duced by heavy particle collisions.
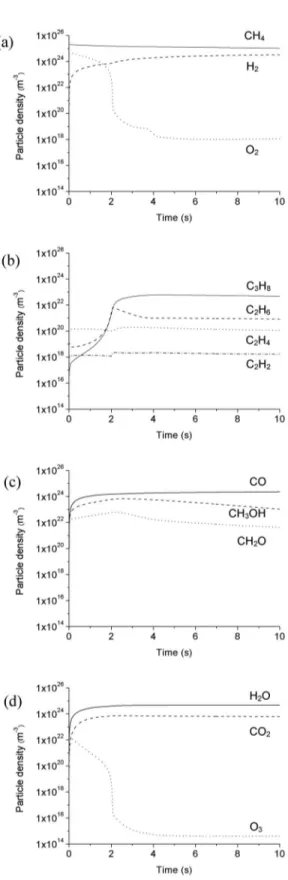
The spatially averaged densities of the different molecules present (or formed) in the reactor are plotted in Fig. 3, as a function of (residence) time. They show only a very weak oscillating behavior during one period, like for some radicals, but because of the longer time scale of the heavy particle col- Modeling of plasma chemistry and plasma–surface interactions 1287
Fig. 2Calculated spatially averaged electron number density (a), mean electron energy (b) and number densities of several radicals (c), as a function of time within two periods, in the DBD reactor shown in Fig. 1, at 1 atm gas pressure (80 % CH4and 20 % O2), at an applied voltage of 10 kV and a frequency of 50 kHz. Also illustrated is the applied voltage as a function of time (thin dashed lines in a and b).
Fig. 3Calculated spatially averaged densities of the various molecules present (or formed) in the DBD reactor, as a function of (residence) time, for the same conditions as in Fig. 2.
lisions, it takes several seconds before they reach steady-state values (note the different scale of the x-axis in Figs. 2 and 3). Figure 3a illustrates that the densities of the reactant gases (i.e., CH4and O2) drop as a function of time, as they become converted into other molecules. The effect is most pro- nounced for O2, which drops more than 6 orders of magnitude. The densities of most other molecules increase as a function of time, as they are created out of the reactant molecules. However, the density of O3drops significantly after an initial increase. This is because most O2has reacted away already, and cannot form any new O3molecules, leading to a drop in density of the latter, similar to the O2density drop. A similar behavior, but to a lesser extent, can be observed for the CH3OH and CH2O densities.
Modeling of plasma chemistry and plasma–surface interactions 1289
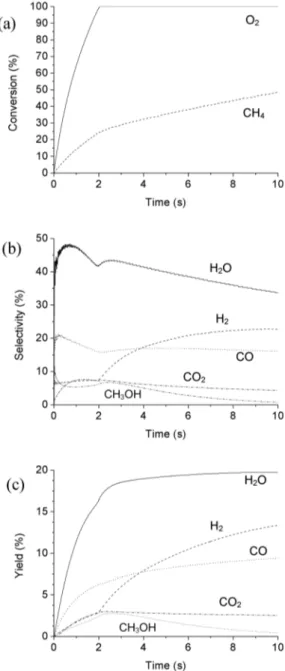
Fig. 4 Calculated conversion of the reactant molecules (a), and selectivities (b) and yields (c) of the various molecules created in the DBD reactor, as a function of (residence) time, for the same conditions as in Fig. 2.
Indeed, they also start decreasing again after about 2 s, because most of the O2has disappeared already.
This means that the conversion of CH4into CH3OH and CH2O will not rise by increasing the residence time above 2 s.
The latter can indeed be deduced from Fig. 4. Indeed, this figure presents the calculated conver- sion of the reactants (a), selectivity (b), and yield (c) of the reaction products. The conversion of CH4 reaches 50 % after a residence time of 10 s (see Fig. 4a). The O2molecules, on the other hand, are al- ready for 100 % converted after 2 s. This means that the selectivity of reaction products containing O-atoms, such as H2O, CO, CO2, and CH3OH, will also reach a maximum at very short residence times, when the O2gas density is still high, as appears from Fig. 4b. Consequently, the calculated yields of these reaction products will not increase at the same pace after the first 2 s, as is clear from Fig. 4c.
Even more, the yield of CH3OH, which is one of the desired end products, is predicted to decrease after 2.5 s. The calculated maximum yield of 2.5 % is quite low, and the yield of CH2O, another desired end product, was found to be negligible. However, the obtained data are first results, which illustrate the possibilities of the fluid model for this application, but they are not yet optimized in terms of operating conditions, gas ratio, etc. For instance, it can be expected that a higher O2fraction in the gas mixture would lead to more optimal selectivities and yields of the desired oxygenates. Nevertheless, this will not be so straightforward in practice, for safety reasons. An alternative would be to reuse the unreacted CH4gas again in the reactor, with new O2supply, so that it can react further into the desired oxygenates.
Finally, it can be deduced from Fig. 4c that besides H2O, H2and CO are also formed to a large extent, i.e., syngas. This can also be a useful end product of the reaction between CH4and O2.
Hybrid Monte Carlo–fluid modeling
The previous example showed that fluid modeling can be very useful to describe the detailed plasma chemistry in a DBD. The latter operates at 1 atm gas pressure, and under these conditions, the energy gained by the electrons due to the electric field will be more or less balanced by the energy lost due to collisions. Hence, it is a reasonable approach to calculate the average electron energy with an energy balance equation in the fluid model. However, for low-pressure discharges, this assumption is not valid.
Indeed, the energy gained by the electrons due to the electric field is then typically higher than the en- ergy lost as a result of collisions. For this reason, it is advisable to treat the electrons with an MC model, which describes the electron behavior on the lowest microscopic level. Indeed, a large number of elec- trons are simulated individually during successive time steps. The electron trajectory, under the influ- ence of the electric field, is calculated by Newton’s laws. The probability of collision during each time step, the kind of collisions, and the new energy and direction after collision are determined by random numbers. By treating a large number of electrons in this way, their behavior can be statistically simu- lated. For the other plasma species, a fluid approach is more reasonable, because they have a larger mass than the electrons, so they do not gain so much energy from the electric field and they can lose their en- ergy more efficiently by collisions with the background gas. Therefore, the electron MC model can be combined with a fluid approach for the other plasma species, into a hybrid model.
An example of such a hybrid model is the so-called hybrid plasma equipment model (HPEM), de- veloped by Kushner and co-workers [12]. This model was used in our group to describe the plasma chemistry in an Ar/Cl2/O2inductively coupled plasma (ICP) reactor used for the etching of Si wafers.
The reactor operates at pressures in the mTorr range, hence explaining the necessity of a hybrid model.
In this model, the species taken into account are the following: electrons, Ar, Ar*, Ar+, Cl2, Cl2+, Cl, Cl*, Cl+, Cl–, O2, O2+, O, O*, O+, O–, and ClO. In total, approximately 120 different electron impact collisions, 26 different ion-neutral, and 10 neutral-neutral reactions were included in the plasma model.
More details about this chemistry can be found in [27].
Figure 5 illustrates the calculated two-dimensional Cl2(a) and electron (b) number density pro- files, in one-half of the cylindrically symmetrical ICP reactor, at typical conditions of 100 sccm Cl2gas,
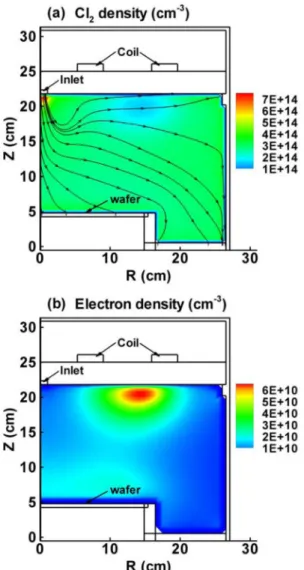
12 sccm Ar, and 14 sccm O2, a total gas pressure of 40 mTorr, a power of 1000 W applied at the coil with frequency of 13.56 MHz, and a radio frequency (RF) bias applied at the wafer, resulting in a DC bias of 500 V. The left axis (R = 0 cm) of Figs. 5a,b is the symmetry axis. The position of the gas inlet, the induction coil, and the wafer are indicated in the figures. From Fig. 5a it can be deduced that the Cl2density reaches its maximum at the gas inlet position, and is depleted in the reactor due to chemi- cal reactions. The density is fairly uniform throughout the reactor. The electrons, on the other hand, reach a maximum density just beneath the coil, as is clear from Fig. 5b. Indeed, this is the region where the electrons gain most energy from the electric field, generated by the coil. The electron density is about four orders of magnitude lower than the Cl2gas density, indicating an ionization degree of about 10–4.
Modeling of plasma chemistry and plasma–surface interactions 1291
Fig. 5Calculated two-dimensional number density profiles of the Cl2molecules (a) and electrons (b) in one-half of the cylindrically symmetrical ICP reactor, at 40 mTorr total pressure (100 sccm Cl2, 12 sccm Ar, 14 sccm O2), 1000 W applied power at the top electrode (at 13.56 MHz) and 500 V DC bias at the wafer. The left axis (at R = 0 cm) corresponds to the symmetry axis. The position of the gas inlet, induction coil, and wafer are indicated in the figures.
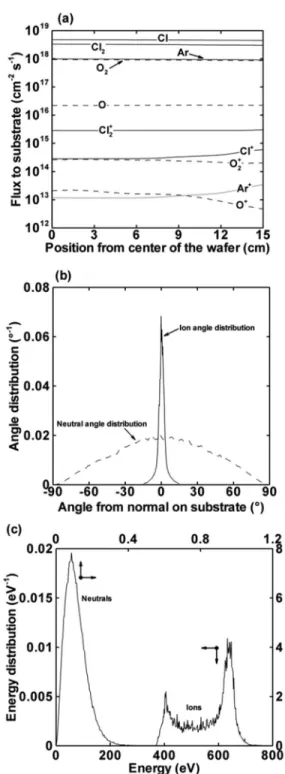
The HPEM code does not only include an MC model for the fast electrons and a fluid model for the other plasma species, but it also uses an MC module to simulate the behavior of the ions and neu- trals in the sheath in front of the wafer. In this way, the energy and angular distributions of these species arriving at the wafer can be calculated in an accurate way, which is needed to describe the etch process (see below). The calculated fluxes of the various species bombarding the wafer, as well as the energy and angular distributions of the ions and neutrals (averaged over all different ion and neutral species, respectively) are illustrated in Fig. 6, for the same conditions as in Fig. 5. It is seen from Fig. 6a that Cl and Cl2are the dominant species arriving at the wafer, which is logical because Cl2is the dominant gas component. Furthermore, it appears that the ion fluxes are about three orders of magnitude lower than the neutral fluxes. However, the ions play an essential role in the fast anisotropic trench etching processes as used in the microelectronics industry (i.e., sputtering). From Fig. 6b, it is clear that the ions are indeed characterized by a very narrow angular distribution, whereas the angular distribution of the neutrals bombarding the wafer is very broad. This is, of course, because the ions are focused in the for- ward direction by the electric field, whereas the neutrals do not experience any influence from this field.
For the same reason, the ions also exhibit a much wider energy distribution, and at much higher ener- gies, than the neutrals, as is observed in Fig. 6c [note the different x-axes for the ions (bottom) and neu- trals (top)]. The ions are characterized by a bimodal distribution. The two peaks arise from the fact that the ions do not only feel the time-averaged DC bias at the wafer, but also a time-specific bias, depend- ing on the phase within the RF cycle when the ions enter the sheath. The peaks at high and low energy therefore correspond to the highest and lowest values of the substrate RF bias amplitude, respectively.
The neutrals, on the other hand, are characterized by a Maxwellian distribution around 0.1 eV.
As mentioned above, from the fluxes and the energy and angular distributions of the species bom- barding the wafer, the etch rates can be calculated based on surface reaction probabilities. In total, 80 different plasma–surface reactions were taken into account in the model, including physical sputter- ing, chemical etching, oxidation, redeposition, etc. Details of the reactions can be found in [27]. The model was used to study the so-called etch stop mechanism in Cl2/Ar/O2discharges. Typically, the Cl atoms give rise to etching, and O2is added to the discharge gas to protect the side walls by forming SiO2, in order to ensure anisotropic etching. However, if too much O2is added, the formation of pro- tecting SiO2layers is more pronounced, preventing the Cl2plasma from further etching. It is indeed ex- perimentally observed that the etch process stops abruptly when adding too much O2to the Cl2/Ar gas mixture, or when increasing the total gas pressure above some critical value (see Fig. 7). It can also be deduced from this figure that our model is well suitable to reproduce these experimental observations.
It is indeed predicted by the model that a SiO2protecting layer is formed on the bottom of the trenches, preventing further etching by the Cl2plasma. The exact composition and thickness of this protecting layer is currently under investigation, both by experiment and by modeling.
Modeling of plasma chemistry and plasma–surface interactions 1293
Fig. 6Calculated fluxes of the different species (neutrals and ions) bombarding the wafer, as a function of position from the center (a), as well as the corresponding angular distributions (b) and energy distributions (c) of the ions and neutrals (averaged over all ions and neutrals, respectively), for the same conditions as in Fig. 5. In Fig. 5c, the top axis gives the energy range of the neutrals, whereas the bottom axis gives the energy range of the ions.
MODELING THE PLASMA–SURFACE INTERACTIONS
The above model has proven to be useful to study plasma–surface interactions, such as plasma-etching, but it needs the surface reaction probabilities as an input in the model. The latter can be obtained either from experiments, or by detailed atomistic simulations, such as MD. In MD simulations, the behavior of a large number of atoms in the simulation box is followed as a function of time by Newton’s laws.
In our case, this refers to the atoms of the substrate surface, as well as atoms impacting on the surface.
A simulation box is typically cubic with sides of a few nm, and consists of a few thousand atoms. In the x-yplane (i.e., parallel to the substrate surface), periodic boundary conditions are applied in the xand ydirection. In the zdirection, the lowest atoms of the substrate are kept fixed, and atoms (or more general: plasma species) bombard the substrate surface from the top. The movement of the atoms within the simulation box is dictated by an interatomic interaction potential between all atoms. This is the most critical part of the MD simulations, as it determines the accuracy of the calculation results. The most accurate potential would originate from quantum mechanical calculations, but in practice this is not convenient because of too long calculation times, limiting thereby the time scale and number of atoms that can be followed in the system. Therefore, in practice we make use of empirical potentials, based Fig. 7Measured (solid lines) and calculated (dashed lines) etch rates at the wafer, as a function of O2gas flow (a) and total gas pressure (b). The other conditions are kept the same as in Fig. 5. Reproduced from [27] with kind permission of Institute of Physics Publishing.
on a large number of parameters, which are typically fitted against density functional theory calcula- tions. The potentials used in our studies will be mentioned below.
As explained above, MD simulations allow one to describe the interactions of the plasma species at the surface in full detail, without predefined reaction probabilities. Indeed, the latter follow automat- ically from the calculations. Examples of such calculated surface reaction probabilities were illustrated, for instance, in [28,29].
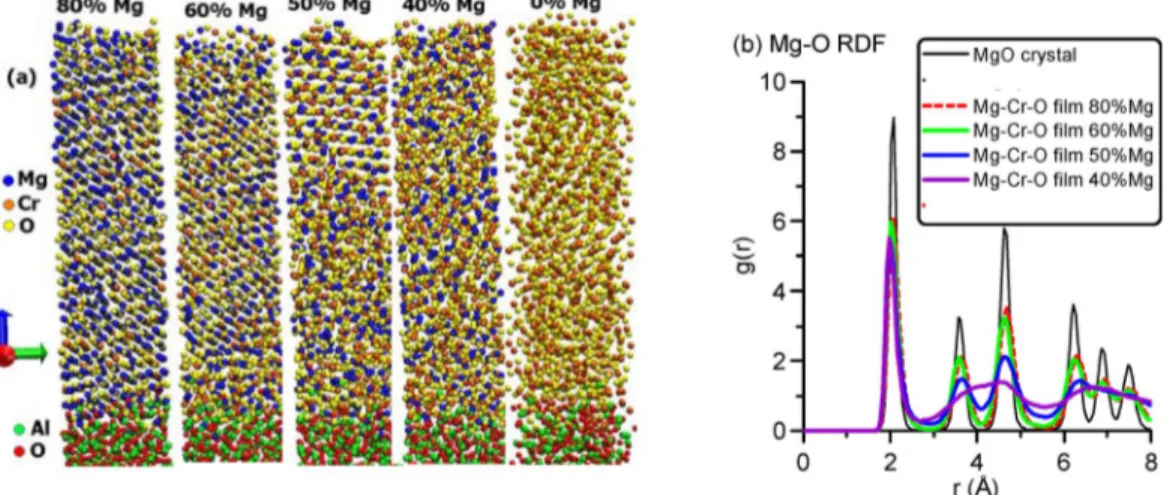
Furthermore, by simulating successive impacts of plasma species on the substrate, the film growth can be described. Figure 8 presents the simulated microscopic structure (a) and the calculated Mg–O radial distribution functions (RDFs) (b) of thin MgxCryOzfilms, deposited on an amorphous Al2O3sub- strate by magnetron sputter-deposition, for different ratios of Mg/Cr. The interatomic interaction po- tential used for such metal oxide systems is a classical pairwise ionic potential, i.e., the sum of a long- and a short-range part [30]:
where qi, qjare the charges of atoms iand j, rijis the distance between the atoms and A, ρ, and Care the parameters fitted for each pair of ions. The first term is the Coulomb interaction, the exponential term represents the short-range repulsion and the term (–rij–6) accounts for the van der Waals attraction.
The film is grown to a thickness of approximately 6–7 nm. As is clear from this figure, the grow- ing film appears to be crystalline with MgO structure (cubic, S.G. Fm 3–
m) with Cr in solid solution at high Mg content, and it gradually becomes amorphous when more Cr is added. The Cr2O3film is a mix- ture of polycrystalline and amorphous phases. Similar results were also obtained for MgxAlyOzfilms and were confirmed by X-ray diffraction and transmission electron microscopy, as is explained in de- tail in [31].
The simulation time per impact in these MD simulations is 2–4 ps, followed by 2–6 ps of relax- ation before the next impact takes place. Note that this yields far too high deposition rates and does not allow sufficient time for thermal surface diffusion. However, in the case of magnetron sputter-deposi- tion where the growth process is assisted by energetic ion bombardment, thermal surface diffusion prob- Modeling of plasma chemistry and plasma–surface interactions 1295
U q q
r A r C
ij r
i j ij
ij ij
= + ⎛−
⎝⎜ ⎞
⎠⎟ −
4πε0 exp ρ 6
Fig. 8Snapshots of simulated MgxCryOzfilms at different Mg/Cr metal ratio (a) and calculated Mg–O RDFs (b) for the presented films. For comparison, the RDF of a MgO crystal is also presented. The RDFs show a clear transition from a crystalline MgO phase to a more amorphous film.
ably does not play a significant role in the simulation of film growth, if the surface temperature is low compared to the activation energy barrier for surface diffusion [32]. For other applications, however, like the plasma-enhanced deposition of nano- and ultrananocrystalline diamond (NCD, UNCD) thin films, thermal surface diffusion and surface relaxation probably play an important role, for pursuing the diamond structure. Therefore, pure MD simulations will not be able to simulate such film growth.
To solve this problem, we have coupled the MD model with a metropolis Monte Carlo (MMC) method, which accounts for the slower adatom surface processes. In brief, the MMC method lets the system evolve from state to state. The energy of the new configuration is compared with the old con- figuration (ΔE= Enew– Eold). If ΔE≤0, the new configuration is accepted. If ΔE> 0, a probability for going to the new configuration is calculated as: Pold→new= exp(–ΔE/kT). This probability is compared to a random number between 0 and 1. If the probability is higher than this random number, the new con- figuration will also be accepted. A more detailed description of this procedure, as well as the coupling to the MD model, is presented in [33]. Figure 9 illustrates the results of such combined MD/MMC cal- culation for the impact of a C atom and a C2H2 molecule (i.e., important growth species for UNCD films) on a partially hydrogenated diamond (111)1 × 1 surface. In this case, the so-called Brenner po- tential for hydrocarbon systems was employed [34].
Snapshot a shows the result of the MD simulation, which forms the starting point of the MMC calculation. Snapshots b–d illustrate some accepted MMC configurations. The final MMC configura- tion is depicted in snapshot e. The red C atoms illustrate the formation of a new diamond six-ring, which means that the diamond crystal structure is pursued. To verify the results, additional longer time-scale MD simulations have also been carried out in [33]. The resulting structures were found to be very sim- ilar to those obtained by the MMC simulations, but the MMC simulation time was typically one order of magnitude shorter than the MD simulation time, or in other words, a boost factor of one order of magnitude was achieved [33].
A similar (combined MD/MMC) approach can also be used to simulate the growth of carbon nano tubes (CNTs) by plasma-enhanced chemical vapor deposition (PE-CVD). It is well known that the growth of CNTs by PE-CVD is catalyzed by metal nanoclusters (e.g., Ni). The hydrocarbon source gas Fig. 9Selected snapshots illustrating the movement of a C atom and a C2H2molecule on a partially hydrogenated diamond (111)1 × 1 surface, as calculated with the MMC algorithm (color online). The white, gray, and red spheres indicate H atoms, crystalline C atoms, and C adatoms, respectively. Part a shows the side view (and the three topmost layers) of the MD result after the impact of a C atom and a C2H2molecule, which forms the starting point of the MMC simulation. Parts b–d represent the three topmost layers of the structure after 484, 1564, and 3675 MMC cycles, respectively. Part e illustrates the side view (and the three topmost layers) of the final MMC structure;
here, the red spheres indicate the new C six-ring that is formed during the MMC simulation. Reproduced from [33]
with kind permission of the Royal Society of Chemistry.
(e.g., C2H6, C2H2, CO2, CH3OH,…) is assumed to dissociate immediately upon impact on the nano - particle, so that MD simulations can be used to describe the interaction of C atoms with the Ni nano - cluster. The interatomic interaction potential used for these simulations is the Shibuta potential [35].
The growth process is simulated by consecutive “impacts” of C atoms on the nanocluster, con- sisting of 108 Ni atoms. The time step in such MD simulations is in the order of femtoseconds, and the integration time per impact is in the order of picoseconds. Because in reality, the time between two C
“impacts” (as defined by the flux) is much longer (typically in the order of microseconds), the MD method needs to be combined again with MMC simulations to account for diffusion and relaxation ef- fects between two impacts.
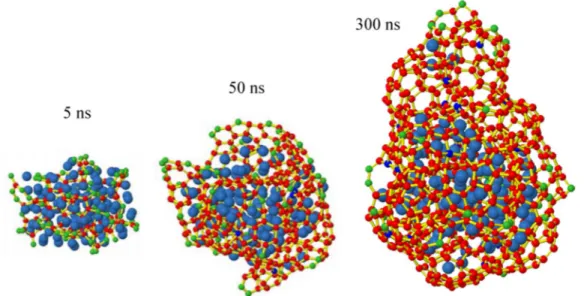
Figure 10 presents the results of MD/MMC simulations of consecutive C atoms impacting on a Ni108nanocluster, after a growth time of 5, 50, and 300 ns. Obviously, this time is still too short for CNT growth, but the start of a CNT cap is already visible. The simulations give more insight in the mechanism of CNT growth, or at least the cap formation. It is found that the cap formation proceeds by the following steps: (1) dissolution of C atoms in the Ni particle; (2) formation of linear C-chains in the Ni particle after about 5 ns; (3) formation of a graphene-like network, which emanates from the Ni sur- face after about 50 ns; and (4) CNT cap formation, which grows into the start of the CNT after about 300 ns.
CONCLUSIONS
We have shown several examples of computer simulations, both for describing the plasma chemistry and plasma–surface interactions. The plasma chemistry can be modeled in detail by means of a fluid approach, as is illustrated for the partial oxidation of CH4by O2in a DBD reactor. This kind of reactor operates at atmospheric pressure, where a fluid model can be considered as a valid approximation. At lower gas pressures, the fluid assumptions will break down, especially for describing the energetic elec- trons. This problem can be overcome by treating these electrons with a MC model, while describing the other plasma species with a fluid approach. An example of such a hybrid MC-fluid model is illustrated Modeling of plasma chemistry and plasma–surface interactions 1297
Fig. 10Simulated configurations after 5, 50, and 300 ns, as a result of MD/MMC trajectories of consecutive C
“impacts” on a Ni108nanocluster at 1200 K (color online). Ni is blue; the C bonds are yellow; the red and green balls are three- and two-coordinated C atoms, respectively.
for an Ar/Cl2/O2ICP reactor, used for etching applications. In this hybrid model, the etch process can also be simulated by means of an MC model, based on predefined surface reaction probabilities.
A more detailed description of plasma–surface interactions can be provided by MD simulations.
This is illustrated for the magnetron sputter-deposition of thin metal oxide films. In some cases, when surface relaxation is important during film growth, pure MD simulations are, however, not sufficient, because of their limited time scales. This can be solved when coupling them to MMC simulations to describe the surface relaxation, as is illustrated for pursuing the diamond structure in (U)NCD thin film growth, as well as for CNT growth.
The output of the plasma models, more specifically the fluxes of the various species bombarding the substrate, as well as their energy and angular distributions, can be used as input in the plasma–sur- face simulations. Vice versa, the MD results can be used as input in the plasma simulations, i.e., to de- fine the boundary conditions for the plasma modeling. Therefore, we believe that by combined effort of simulations of both the plasma behavior and plasma–surface interactions, a more complete picture of reactive plasmas can be obtained.
ACKNOWLEDGMENTS
M. Eckert and S. Tinck are indebted to the Institute for the Promotion of Innovation by Science and Technology in Flanders (IWT-Flanders) for financial support. E. Neyts acknowledges financial support from the Fund for Scientific Research Flanders (FWO). This work is also supported by two IWT (SBO) projects and an IAP project of the Prime Minister’s Office. Finally, the calculation support of the core facility CALCUA, provided by the University of Antwerp, is gratefully acknowledged.
REFERENCES
1. S. V. Berezhnoi, I. D. Kaganovich, L. D. Tsendin, V. A. Schweigert. Appl. Phys. Lett.69, 2341 (1996).
2. Y. T. Lee, M. A. Lieberman, A. J. Lichtenberg, F. Bose, H. Baltes, R. Patrick. J. Vac. Sci. Technol.
15, 113 (1997).
3. J.-P. Boeuf. Phys. Rev. A 36, 2782 (1987).
4. J. D. P. Passchier, W. J. Goedheer. J. Appl. Phys. 73, 1073 (1993).
5. D. Loffhagen, F. Sigeneger, R. Winkler. J. Phys. D: Appl. Phys. 35, 1768 (2002).
6. M. J. Kushner. IEEE Trans. Plasma Sci. 14, 188 (1986).
7. Z. Donko, K. Rozsa, R. C. Tobin. J. Phys. D: Appl. Phys. 29, 105 (1996).
8. M. Surendra, D. B. Graves. IEEE Trans. Plasma Sci. 19, 144 (1991).
9. E. Bultinck, S. Mahieu, D. Depla, A. Bogaerts. New J. Phys.11, 023039 (2009).
10. J. Vlcek. J. Phys. D: Appl. Phys. 22, 623 (1989).
11. A. Bogaerts, R. Gijbels, J. Vlcek. J. Appl. Phys. 84, 121 (1998).
12. M. J. Grapperhaus, M. J. Kushner. J. Appl. Phys. 81, 569 (1997).
13. A. Bogaerts, R. Gijbels, W. J. Goedheer. J. Appl. Phys. 78, 2233 (1995).
14. Z. Donko. Phys. Rev. E57, 7126 (1998).
15. A. Bogaerts. Plasma Sources Sci. Technol.8, 210 (1999).
16. J. J. Végh, D. B. Graves. Plasma Process. Polym.6, 320 (2009).
17. E. Neyts, A. Bogaerts, R. Gijbels, J. Benedikt, M. C. M. van de Sanden. Diamond Relat. Mater.
13, 1873 (2004).
18. C. De Bie. Paper in preparation.
19. <http://plasimo.phys.tue.nl>.
20. G. J. M. Hagelaar, L. C. Pitchford. Plasma Sources Sci. Technol.14, 722 (2005).
21. E. W. McDaniel, E. A. Mason. The Mobility and Diffusion of Ions in Gases, John Wiley, New York (1973).
22. R. C. Reid, J. M. Prausnitz, B. E. Poling. The Properties of Gases and Liquids, 4thed., McGraw- Hill, New York (1987).
23. R. A. Svehla. Estimated Viscosities and Thermal Conductivities of Gases at High Temperatures, National Aeronautics and Space Administration, Washington, DC (1962).
24. G. E. Schneider, M. Zedan. Numer. Heat Transfer4, 1 (1981).
25. G. Hagelaar. Modeling of Microdischarges for Display Technology, Ph.D. Dissertation, Eindhoven University of Technology (2000).
26. Yu. B. Golubovskii, V. A. Maiorov, J. Behnke, V. G. Behnke. J. Phys. D: Appl. Phys. 36, 39 (2003).
27. S. Tinck, W. Boullart, A. Bogaerts. J. Phys. D: Appl. Phys.42, 095204 (2009).
28. E. Neyts, M. Tacq, A. Bogaerts. Diamond Relat. Mater.15, 1663 (2006).
29. M. Eckert, E. Neyts, A. Bogaerts. Chem. Vap. Deposition14, 213 (2008).
30. C. R. A. Catlow, C. M. Freeman, R. L. Royle. Physica B&C131, 1 (1985).
31. V. Georgieva, M. Saraiva, N. Jenanathan, O. I. Lebelev, D. Depla, A. Bogaerts. J. Phys. D: Appl.
Phys.42, 065107 (2009).
32. P. R. Willmott. Prog. Surf. Sci. 76, 163 (2004).
33. M. Eckert, E. Neyts, A. Bogaerts. CrystEngComm.11, 1597 (2009).
34. D. W. Brenner Phys. Rev. B42, 9458 (1990).
35. Y. Shibuta, S. Maruyama. Comp. Mater. Sci.39, 842 (2007).
Modeling of plasma chemistry and plasma–surface interactions 1299