Research Collection
Working Paper
Mobility Responses to the Establishment of a Residential Tax Haven: Evidence From Switzerland
Author(s):
Martínez, Isabel Z.
Publication Date:
2021-10
Permanent Link:
https://doi.org/10.3929/ethz-b-000463387
Rights / License:
In Copyright - Non-Commercial Use Permitted
This page was generated automatically upon download from the ETH Zurich Research Collection. For more information please consult the Terms of use.
KOF Working Papers, No. 490, January 2021
Beggar-Thy-Neighbour Tax Cuts:
Mobility After a Local Income and Wealth Tax Reform in Switzerland
Isabel Z. Martínez
ETH Zurich
KOF Swiss Economic Institute LEE G 116
Leonhardstrasse 21 8092 Zurich, Switzerland Phone +41 44 632 42 39 Fax +41 44 632 12 18
Beggar-Thy-Neighbour Tax Cuts:
Mobility After a Local Income and Wealth Tax Reform in Switzerland ∗
Isabel Z. Martínez
†KOF Economic Institute ETH Zurich
January 13, 2021
Abstract
I analyze mobility responses to the unique introduction of regressive local income schedule in the Swiss Canton of Obwalden in 2006, which was aimed at attracting the top 1%. Difference- in-Differences estimations comparing Obwalden to all other cantons confirm that the reform successfully attracted rich taxpayers: by 2016, the share of rich in the canton more than doubled and average income per taxpayer was 16% higher relative to 2005. Using individual tax data and an instrumental variable approach, I find a large elasticity of the stock of rich taxpayers of 1.5–2 with respect to the average net-of-tax rate. The corresponding flow elasticity ranges from 6.5 to 10. However, the reform did not yield any Laffer effects. Finally, I find positive effects on local employment: the number of jobs per 1,000 inhabitants rose by an estimated 2.3% relative to other cantons and compared to 2005. However, these employment effects are likely driven by a simultaneous reduction of the corporate tax rate.
JEL-Classification: H24, H31, H71, H73, R23
Keywords: Mobility; Personal income tax; Local taxes; Tax competition; Regressive income tax
∗I thank Alan Auerbach, Marius Brülhart, Aline Bütikofer, Henrik Kleven, Reto Foellmi, Emmanuel Saez, Lukas Schmid, Arthur Seibold, Michael Siegenthaler, Charles Varner, Danny Yagan, Cristobal Young, Josef Zweimüller, Gabriel Zucman, and Seminar participants at UC Berkeley, the University of Lausanne, the Paris School of Econonomics, Strathclyde University, the AEA and EEA Annual Meetings 2016 as well as two anonymous referees for fruitful discussions and helpful comments. Special thanks go to Marianne Nufer and Reto Achermann from the Cantonal Tax Administration of the Canton of Obwalden in Sarnen, as well as Ben Jann and Reto Föllmi, for helping obtain data access. Individual federal income tax data have been made accessible within SNSF Project No. 130648. This work has benefited from financial support through SNSF Doc.Mobility grant No.158823 for a research stay at UC Berkeley.
†KOF Economic Institute at ETH Zurich, Leonhardstrasse 21, 8037 Zurich, Switzerland. E-mail:
1 Introduction
How responsive are top earners’ location decisions to taxation when personal taxes differ across regions? And how much do especially small regions gain in terms of increased tax base and revenue from entering competition for rich households through low taxes?
A growing empirical literature on the spatial mobility in response to taxation espe- cially of rich taxpayers has addressed these questions (see review by Kleven et al., 2019).
Existing estimates by Kleven et al. (2013, 2014) Agrawal and Foremny (2019), Young et al. (2016), and Young and Varner (2011) differ substantially across countries and insti- tutional settings. This suggests that the mobility elasticity is not an exogenous structural parameter, but depends on a series of factors.
I add to this literature by analyzing a very unique, regressive local tax reform in central Switzerland, which explicitly aimed at attracting rich taxpayers from surrounding large urban areas, including Zurich. While tax cuts aimed at attracting the rich are not uncommon, I am not aware of any other instance of an introduction of a regressive income tax scheme. In 2006, the canton (state) of Obwalden in central Switzerland changed its tax code and introduced falling marginal tax rates for incomes beyond 300,000 CHF (approximately 300,000 USD). This corresponds roughly to the income threshold to belong to the top 1% of Swiss taxpayers. The regressive scheme implied that for the richest taxpayers, effective average income tax rates fell from 30% to 26%, while for the upper middle-class the effective average tax rate remained at 25%. The annual wealth tax became regressive for net wealth exceeding 5 mio CHF. The reform therefore allows to exploit a sharp, sizable and (as I will show) salient decrease in marginal and average tax rates. Since in Switzerland taxation is residence based, it was sufficient for taxpayers to move to Obwalden to take advantage of the low tax rates. I exploit variation over time, across cantons and across different groups of taxpayers to identify the pull effect of this pro-rich tax policy in Obwalden. The Swiss setting is particularly interesting, as it comes close to Tiebout’s (1956) model world, where taxpayers can freely relocate and vote with their feet. The income tax applies to all forms of income, without distinction
between labor and capital incomes. Employees, self-employed and rentiers can therefore all take advantage of local income tax differences by relocating.
The analysis of the reform proceeds in four steps. Using federal income tax data, I first analyze the population share of income-rich taxpayers living in a canton, and net income per taxpayer in Obwalden in comparison to other cantons in a Difference-in- Differences (DiD) setting. The results indicate that the reform had the intended effect:
by 2016, the share of rich taxpayers in Obwalden had grown by 0.65 percentage points relative to other cantons. This is an increase of 123% compared to Obwalden’s initial share of top earners. Net income per taxpayer rose by 16% on average. While income growth was strongest among rich taxpayers, I find that real income per taxpayer also rose among those below the regressive threshold relative to other cantons.
Next, I use individual cantonal income tax data from Obwalden for the period 2001–
2010 to estimate the elasticity of rich taxpayers in the canton with respect to the average net-of-tax rate using a instrumental variable approach. I find a large elasticity of in- migration of up to 10 in the short-run and 7.2 in the five years after the reform. Moving responses were immediate and flattened out somewhat over time. The elasticity of the stock of rich taxpayers lies in the range of 1.5–2.
There are several explanations for these large elasticities. First, the results show that in absence of institutional restrictions location responses of high earners are large—even when not focusing on especially mobile groups like football players (Kleven et al., 2013) or star scientists (Akcigit et al., 2016). The institutional setting in the U.S. may explain why Young and Varner (2011) and Young et al. (2016) find only small moving responses in the U.S. context. Only some states have reciprocal agreements, allowing to tax individuals in their place of residence. In many instances, labor income taxation is source-based, reducing the possibilities for tax planning through relocation for individuals. Second, the results indicate that within-country elasticities are larger than in the international context studied by Klevenet al. (2013, 2014) and Akcigit et al. (2016). This is supported by a recent study by Agrawal and Foremny (2019) who find similar elasticities within
Spain. Finally, the magnitude of the elasticity has to be understood in the context of the size of the migration flows prior to a tax reform. Starting from a situation with low spatial mobility, a small increase in the number of in-movers corresponds to a large relative change.
Next, I turn to revenue effects. While the reform was successful at attracting rich taxpayers, DiD estimates of the change in cantonal tax revenue show that the reform did not yield Laffer effects. Revenue losses from the rich were slightly mitigated from inflows of other taxpayers after Obwalden lowered rates for broader population groups.
Comparing the effective top marginal tax rate with the revenue-maximizing rate shows that Obwalden already was on the left side of the Laffer curve prior to the reform, which explains the adverse revenue effects despite the large inflows. With the exception of Agrawal and Foremny (2019), who also find negative revenue effects, the empirical literature has not addressed the revenue effects of reducing tax rates for top earners.
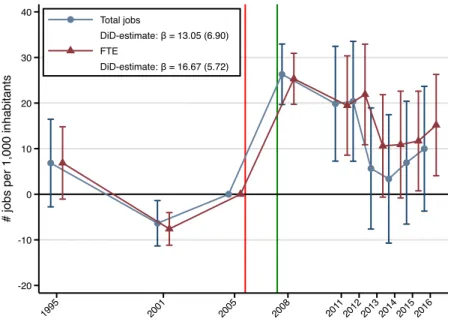
My findings raise an important question from a policy perspective: what do jurisdic- tions gain from tax competition if not tax revenue? Local job creation and structural change may be one such gain. DiD results suggest an increase of 2.3–4% in cantonal employment. Job growth took place in high-skill professional jobs, low skill service jobs, and construction and real estate services. However, this effect on job creation is most likely driven by the simultaneous reduction of the corporate income tax and cannot be attributed to the personal income tax reform. The bottom line therefore is, that there does not seem to be much to gain from a regressive top income tax.
The paper is organized as follows. Section 2 gives an overview of previous research on tax mobility. Section 3 describes the tax reform in Obwalden. In Section 4, I present a simple model of how individuals can react to local differences and changes in taxation.
The two main data sets used in this study are presented in Section 5 along with some descriptive evidence on the effects of the reform. Empirical results are described in Section 6. Section 7 concludes.
2 Literature on Location Choice and Taxation
Income segregation of high-income taxpayers is a well documented phenomenon in Switzer- land (Kirchgässner and Pommerehne, 1996; Feld and Kirchgässner, 2001; Schmidheiny, 2006; Schaltegger et al., 2011; Roller and Schmidheiny, 2016). Roller and Schmidheiny (2016) show that in Switzerland this segregation leads to a de-facto regressive tax scheme, where taxpayers with incomes above 1 million CHF face falling average tax rates due to strategic choice of their location.
Despite this compelling evidence, only few studies on migratory responses to income taxation exist in the Swiss context. Schmidheiny (2006) develops an extensive location choice model and shows that for relocating households in the area of Basel in 1997, low tax levels attract high income individuals. Liebig et al. (2007) use the 2000 census and find that migratory responses are small and concentrated among Swiss college graduates.
Unfortunately, their study is based on estimated labor incomes and excludes capital incomes. For the more mobile high-income earners, the latter are an important source of income.
I fill this gap using very rich administrative federal and cantonal tax data, where income and wealth are captured in high detail and the exact moving date is reported, and exploit a unique, regressive income tax reform. The present paper therefore adds to the growing literature relying on large tax changes to estimate the mobility of rich taxpayers (see for example Young and Varner, 2011, Young et al., 2016, and Moretti and Wilson, 2017 for the U.S.; Agrawal and Foremny, 2019, for Spain; Kleven et al., 2014, for Denmark).
In contrast to some of the studies estimating the migration elasticity with respect to taxes, the focus here is not limited to high-income foreigners (Kleven et al., 2014;
Schmidheiny and Slotwinski, 2018) or highly mobile international professionals such as star scientists (Akcigit et al., 2016) or football players (Kleven et al., 2013). These papers all report relatively large mobility elasticities of one or more with respect to the average net-of-tax rate. Due to the highly mobile nature of these types of workers, Kleven et al.
(2013) argue their estimates should be seen as upper bounds. My results show that this is not necessarily true and that within-country mobility elasticities may well be larger (as Moretti and Wilson, 2017 show for star scientists within the U.S., or Agrawal and Foremny, 2019 find for top earners in Spain). Elasticities are larger (i) in settings which come close to a Tiebout (1956) model world without restrictions with respect to profession, income source, nationality or origin to take advantage of lower taxes in an other jurisdiction; (ii) in jurisdictions starting from low levels of migration.
A related strand of literature has studied location choice responses to taxation on wealth. Brülhart and Parchet (2014) study the effect of abolition of bequest taxes in Switzerland and find limited effects on location choice, as do Bakija and Slemrod (2004) for the U.S. It seems that these taxes only have an effect on the super rich, as shown in Moretti and Wilson (2019), who study U.S. billionaires. In the case of recurring wealth taxes, (Brülhart et al., 2020) find a large semi-elasticity of the wealth tax base of 0.46, i.e., in response to a 1 percentage point change in the wealth tax rate, the tax base changed by 0.46%. However, less than one third of this response can be attributed to taxpayer mobility. For Spain, Agrawal et al. (2020) find that the stock of wealthy taxpayers in Madrid rose by 10% relative to other regions after 5 years during which Madrid levied no wealth tax while other regions did.
3 Income and Wealth Tax Reform in Obwalden
In 2006, the canton of Obwalden introduced a regressive tax schedule with marginal rates declining at taxable incomes above 300,000 CHF, and at taxable wealth of 5 million CHF, outlined in Figure 1. While tax cuts for high incomes are not unusual, the introduction of a regressive tax scheme is very unique, also in the Swiss context. Like in a Tiebout (1956) model, income and wealth taxation in Switzerland is residence based, and cantons compete—especially over rich taxpayers. Municipalities levy an additional income tax, which is defined as a multiple of the cantonal tax. Hence, the municipality multiplier
shifts the cantonal tax curve up or down.1 This results in substantial variation in tax rates at the cantonal and municipal level. Obwalden’s aim explicitly was to attract high-income and wealthy individuals and to keep up with the competitive tax rates of the neighboring cantons, especially Zug, Nidwalden and Schwyz (the map in Appendix Figure A1 shows average tax rates across Swiss cantons and municipalities as of 2005). Appendix Figure A3 illustrates this beggar-thy-neighbor tax strategy, comparing the evolution of tax rates in Obwalden to that in the two neighboring cantons Nidwalden and Lucerne.
Prior to the reform, Obwalden was a relatively poor canton, with a comparatively large share of firms and jobs in the first sector. Unemployment was substantially below the Swiss average and so was inequality as measured by the Gini index of federal taxable income. Table A1 shows these and further macroeconomic characteristics for Obwalden, low- and high-tax cantons in the region, as well as similar cantons in other regions, the two largest cantons Zurich (ZH) and Bern (BE), and Switzerland as a whole in 2005.
Note that while Obwalden is small, hosting less than 0.5% of total Swiss population, quite a few cantons host less than 1% of the Swiss population.
To lower the overall tax load, the cantonal parliament had suggested a two-step tax strategy. First, Obwalden was to strengthen its position by actively engaging in inter- cantonal tax competition for high-income taxpayers and firms.2 In a second step in the near future, the overall tax load was to be lowered.3 Due to its geographic location at the heart of Switzerland and the small size of the country, mobility costs are low and commuting times to urban centers like Lucerne, Zug and Zurich lie within a reasonable range of one hour or less. It was deemed feasible to attract high-income taxpayers even if their workplace was outside Obwladen.
Initial losses in tax revenue were to be financed through exceptional payouts each
1For a detailed overview of the Swiss tax system, see Appendix A in Martínez (2017).
2The tax on corporate earnings, formerly in the range of 9-11%, was reduced to a unique cantonal rate of 6.6%, the lowest in the country. I leave the question of corporate income tax effects on mobility, revenue, and job creation for future research. The Swiss tax system for local corporate taxation is rather complex and diving into it would go beyond the scope of this paper.
3This line of reasoning was shared with the voters in the official information material for the popular referendum on the new tax law: "Abstimmungsbotschaft Kantonale Volksabstimmung vom 11. Dezember 2005", Kanton Obwalden.
canton had received from large gold sales by the Swiss National Bank in 2005.4 Most cantons used this windfall gain by large for debt reduction, sometimes combined with (future) tax reductions. In Obwalden, 23.5 out of the 134.5 million CHF the canton had received, were allocated to financing initial losses in municipalities’ tax revenue over the first five years after the reform. This sum corresponded to almost 50% of cantonal tax revenue, approximately 50 million CHF per year at that time.
The introduction of the regressive tax scheme had been decided by the cantonal par- liament in October 2005 with 39 against 4 votes, and was confirmed by 86% of the voters in the mandatory popular referendum held on December 11, 2005. The scheme immedi- ately became effective as of January 1, 2006. However, to take advantage of the low taxes it was sufficient to officially reside in Obwalden as of December 31, 2006, the reference date defining the location of the tax liability. Hence, individuals from other cantons had roughly 12 months to relocate to Obwalden and benefit from the low tax in the first year already.
Change in Tax Rates. Panels a) and c) of Figure 1 depict marginal and average in- come tax rates, respectively, in terms of taxable income, for different years for Sarnen, the canton’s main town and largest of seven municipalities. Under the regressive scheme introduced in 2006, the average income tax rate (excluding federal taxes) reached a max- imum of 16.6% at 300,000 CHF and was down to 12.4% at 1.8 mio CHF. Hence, income earners with incomes above 300,000 CHF taxable income benefited substantially from the tax cut in 2006 (red line), while those with incomes below that threshold faced similar or slightly lower marginal tax rates than before the change. With the introduction of the flat rate tax in 2008, taxable incomes below 340,000 CHF saw a decrease in marginal rates, while incomes exceeding this threshold were now again taxed at a higher rate than during the regressive period—yet not as high as before the 2006 reform. Also for top earners, this cut in marginal rates translated into lower average tax rates post 2008 (Figure 1.c).
Only incomes above 555,100–658,600 CHF (depending on the municipality, due to the
4Each canton received a share of the total windfall gain corresponding to its population share.
different municipality tax multipliers) were taxed at a slightly higher average rate . For wealth (Fig. 1 b) and c), in 2006 the average rate reached its maximum of 2.58‰
at 5 mio CHF. For a net fortune of 10 mio CHF, the average rate was 2.04‰. The cuts in the—comparatively low—wealth tax rate were substantial at all wealth levels in both, the 2006 and 2008 reforms.
In principle, municipalities could have tried to counteract the reform by increasing municipality tax rates. However, as the tax rate schedule is set at the cantonal level and municipalities can only change the tax multiplier, they would not have been able to circumvent the regressive schedule but would have had to increase taxes for their residents across the board, by increasing their multiplier. In all seven municipalities in Obwalden, the multipliers remained stable after the reform (see Figure A2 in the Appendix).
Salience. Starting in October 2005, the proposal and the introduction had gained large media attention in the whole country and this attention grew considerably once the introduction had been decided upon at the ballot. Left-wing politicians across the country protested heavily against this new tax law and brought the case to the Federal Court.
The canonical view in the media and academia, however, was that the Federal Court had no say in this and was not going to rule, due to the large set of rights the constitution guarantees to cantons in taxation matters. It therefore came as a surprise for many observers including the President of the Cantonal Conference of Financial Directors when on June 1, 2007 the court ruled in favor of the plaintiffs, obliging Obwalden to change its tax schedule. To guarantee legal certainty, the regressive schedule remained valid for the tax periods 2006 and 2007. Keeping the promise of lowering taxes for everyone and offering attractive conditions for high-income households, the canton was then the first to introduce a flat rate tax, with a general exemption of 10,000 CHF, effective January 1, 2008. To respond to this change, it was again sufficient for individuals to move by December 31, 2008.
Fake Moves. The law and many cantonal and federal court rulings attempt to inhibit fake moves for tax avoidance. Taxpayers who wish to register for a second residence and claim weekly residency undergo an interview with the authorities of the municipality where one is not going to be resident for tax purposes but only for work or other practical reasons. The municipality establishes the tax liability based on where the taxpayer’s center of life is, taking into account size and cost of the second residency, where someone is part of a sports or social club, at which of the two homes one spends the weekends, where the children attend school and the like. The data show that among the rich who moved to Obwalden, only 2.1% claimed week-day residency elsewhere.
Rate-determining vs. Taxable Income. The Swiss tax system draws an important distinction between taxable and rate-determining income. Incomes earned abroad as well as real-estate income from other cantons are taxed at the source. To avoid double taxation, these incomes are not subject to the income tax in the canton of residence and are hence excluded from the taxable income definition. To ensure that the average tax rate nevertheless reflects the economic potential (wirtschaftliche Leistungsfähigkeit) of the taxpayer, the tax rate is calculated using rate-determining income, which takes all incomes into account as if they were earned in the canton of residence and allowing for all applicable deductions (e.g., maintenance cost of real estate). This average tax rate is then applied to the taxable income. Since it is rate-determining income which puts taxpayers either above or below the regressive part of the tax scheme, in what follows the treatment and control groups are defined according to their rate-determining income.
4 Theoretical Model
Cutting local taxes affects the income distribution and the potential for raising revenue through two channels. First, individuals may decide to move to the area if the average tax is lower than in their current place of residence (the extensive margin). Second, residents affected by the tax cut may adjust their taxable income as a reaction of lower marginal
tax rates (the intensive margin). This implies two different elasticities with respect to taxation: a mobility elasticity and an elasticity of taxable income (ETI). In the following, I describe and combine both behavioral responses to show the overall effect a tax change has on the canton’s tax base.
4.1 The Elasticity of Reported Income
Tax Scheme. Assume a progressive, piece-wise linear tax scheme with a marginal tax rate ⌧b, which is constant within each income bracket b = 1, . . . , B but differs across brackets. Integrating the area under the tax curve f(z) gives the amount of taxesTj(z) due in a given canton j on reported income z .
Utility Maximization. In each period t, individuals i living in canton j maximize a utility function Ujti(ct, zt, µijt) =ct hi(zt) +µijt , wherect is consumption in periodt,zt
is the individual’s reported income, andhi(zt)denotes the labor supply cost of earningz.
There are j = 1, . . . , J cantons to choose to move to (while still keeping a given job), and individuals have preference parameters µijt = µi1t, . . . , µiJt for each canton (analogous to the location-choice framework in Kleven et al., 2013). The unobservable components of this decision,µijt, are assumed to increase the moving costs for the household.5 Individuals maximize utility with respect to the budget constraintct=zt Tj(zt) =zt(1 ⌧jt) +Rjt, whereRjt = (zt⌧jt Tj(zt))denotes virtual income from the non-linear tax schedule (see Gruber and Saez, 2002, for details).
The Elasticity of Reported Income. Abstracting from income effects,6 the result- ing “reported income supply function” reads as zit(1 ⌧jt). This function is crucial to
5Ifµijt was zero, so that the moving decision would be fully explained by the tax difference and the distance to the new location, this would imply unrealistically high tax-induced mobility.
6With the exception of Gruber and Saez (2002), the ETI literature usually abstracts from income effects. Empirical estimates suggest that income effects are small, especially in the case of reported income (see for example the estimates in Kleven and Schultz, 2014). For a discussion of the relevance of income effects in the estimation of the ETI the reader is referred to Gruber and Saez (2002) and (Saez et al., 2012, especially pp.5–6); for an overview on income effects in labor supply models see Blundell and MaCurdy (1999).
determine the elasticity of reported income with respect to the marginal net-of-tax rate, defined as
e= (1 ⌧jt)
zit · @zit
@(1 ⌧jt). (1)
4.2 The Mobility Elasticity
Migration Decision. From the reported income supply function (1), it is possible to determine the individually optimal reported incomezit? for each locationj. The household chooses the canton that yields the highest utility, so that moving to j is optimal if Ujti(zi?(1 ⌧jt)) +µijt >max Uji0t(zit?(1 ⌧j0t)) +µij0t , 8j0 6=j.
The Mobility Elasticity. The presented utility framework can be interpreted as a random utility model (RUM), where utility is decomposed into a deterministic and an unobservable part: Ujti (c, z) =Vjti(c, z) +µijt (for an overview of RUMs, see Train, 2009).
Assuming that the individual-specific unobserved term µijt follows some extreme value distribution, it is possible to determine the probability of moving, Pjti. The elasticity of moving with respect to the net-of-tax rate is then given by:
"ijt = dlogPjti
dlog(1 ⌧jt). (2)
In the present context, where tax rates also vary between municipalities within cantons, individuals theoretically have around 3,000 municipalities to choose from when deciding where to relocate. Therefore, and because no panel data is available on the universe of Swiss taxpayers, rather than estimating a location-choice framework, I rely on a combined two-stage least squares (2SLS) and DiD approach to estimate the reduced form mobility elasticity in Section 6.2.
5 Data
5.1 Federal Income Tax Data
I make cross-cantonal comparisons and run DiD estimations to assess the effect of the reform on the share of rich taxpayers and on average income in Obwladen using federal income tax data. The individual federal income tax data has the advantage that it allows comparing incomes across cantons and over time, since the definition of taxable income is identical across cantons and has remained remarkably stable over time. I base the analysis on the period 1994–2016, which allows controlling for pre-reform trends. 7
While this data is encompassing in time and space, it is limited in scope. The available income variables are taxable and net income (called Revenu net or Reineinkommen).
Net income is net of social security contributions and itemized deductions, but not net of social deductions nor taxes. Income includes labor and capital incomes. Realized capital gains are not part of the income definition, as they are untaxed in Switzerland.
Available individual characteristics are marital status, number of children, employment status (employee, self-employed, non-working), and municipality of residence. Married couples have to file jointly and a taxpayer may therefore be an individual or a married couple. Because individual identifiers are set at the cantonal level, it is not possible to track individuals over time once they leave their canton of residence. Wealth is taxed at the cantonal and municipal level only, hence the individual federal tax data do not contain information on wealth.
Descriptive Statistics Obwalden (OW) experienced a large increase in rich taxpayers after 2005: within one year, the number of rich taxpayers rose by 50%, by 2010 their number doubled relative to 2005. The total number of taxpayers remained constant, hence the increasing number of rich taxpayers was not driven by overall population growth. No other canton experienced a similar increase during this period (see Figure A4.a) in the
7Prior to 2001, Switzerland had a biennial praenumerando tax system, hence data is available only bi-annually. For details on the praenumrando tax system and the change to the postnumerando system
Appendix for an overview). The income sum in the top bracket (Figure A4.b) rose even slightly more than the number of taxpayers, implying that the rich had higher average incomes than before the reform.
The steep rise observed in Obwalden after 2005 is therefore a unique phenomenon, unlikely due to spurious correlation caused, for example, by a positive income shock in 2006 affecting the top 1% in the whole country.
5.2 Obwalden Cantonal Income and Wealth Tax Data
To overcome some of the limitations of the federal income tax data, I use individual income tax data from the Canton of Obwalden for the period 2001–2010. What makes the data unique is that the records contain the exact date when a taxpayer registered with the municipality, along with their municipality of origin—or the country of origin if they moved-in from abroad. This allows to shed light on the moving behavior of taxpayers.
The panel data further contain the full information collected in the annual income tax returns, such as all sources of income and all claimed deductions, as well as some basic information about each tax unit (age, nationality, marital status, number of dependents, self-declared occupation, industry code).
In turn, the data are limited to taxpayers with a tax liability in the canton of Obwalden during the period 2001–2010. Because individuals have a cantonal rather than a national tax id, it is not possible to link individual tax data from different cantons. I therefore lack information on wealth and incomes earned before moving to Obwalden or after leaving the canton. Unfortunately, I cannot identify the intentionally treated non-movers living in other cantons.
Obwalden being a small canton, the number of observations is relatively small. The total population is roughly 35,000 individuals in 2010 (0.5% of the Swiss population), corresponding to 18,000–22,000 taxpayers each year. All Swiss cantons engaging success- fully in tax competition are small in terms of population and geographical area. This is in line with theory and makes sense intuitively: a small, open economy can expect
large relative gains in its tax base from cutting taxes, but faces relatively small losses in foregone revenue (for theory on asymmetric tax competition where countries differ in size, see Bucovetsky, 1991, Wilson, 1999; for empirical evidence see Winner, 2005, Buettner, 2003). Obwalden’s proximity to the cities of Lucerne, Zug, and Zurich harbors potential to attract rich taxpayers seeking a reasonably centrally located place of residence with favorable tax climate, surrounded by natural amenities.
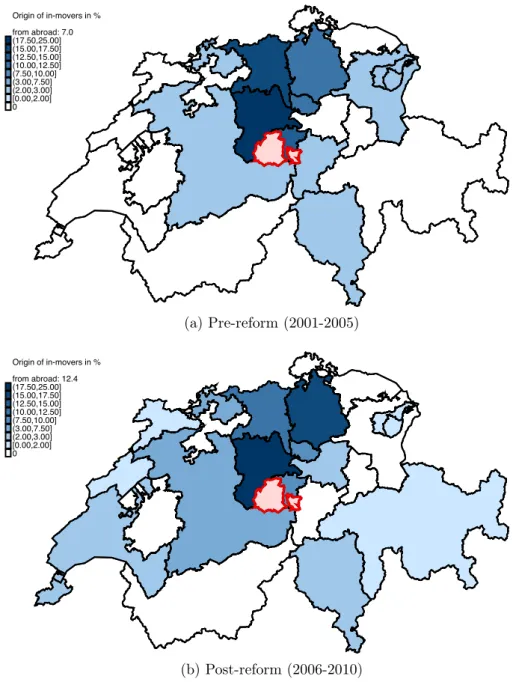
Descriptive Statistics. Income and wealth of in-movers increased sharply right after the 2006 tax cut. Decomposing income into mobile capital incomes and “immobile”
income from labor further shows that those moving to Obwalden after 2005 also had large labor incomes and were not only depending on highly mobile capital incomes. Although information on the location of the workplace is not available, assuming that the tax cut did not create a substantial number of new, high-paying jobs taken by in-movers, this suggests that the canton of Obwalden has the potential to attract taxpayers relying on labor incomes and not only wealthy rentiers. Rich taxpayers moving to Obwalden also come from further away after the reform, as can be seen by comparing the maps in the Panels a) and b) in Figure 2.
6 Empirical Analysis
This section presents the empirical results. I first analyze aggregate effects on Obwalden’s tax base, namely the share of rich individuals in the canton and average income per taxpayer, compared to other Swiss cantons in an event study framework. Second, I estimate the stock and flow elasticities of rich taxpayers using a longitudinal two-stages least squares approach. Third, I study revenue effects the reform had for the canton of Obwalden. Fourth, I shed light on the effects of the reform on employment in the canton.
6.1 Effects on Obwalden’s Tax Base
This section provides evidence that reform was successful in increasing the share of rich taxpayers and average taxable income in Obwalden compared to other cantons. I exploit the federal setting in Switzerland with a DiD approach to estimate the effect of the reform on Obawlden’s tax base. Using the federal income tax data described in Section 5, I compare (i) the share of rich—defined as taxpayers with federal taxable income above 300,000 CHF—in percent of total taxpayers, and (ii) net income per taxpayer.
The first outcome is a direct measure of whether the reform was successful in attracting and retaining rich taxpayers, the second one sheds light on how the reform affected the income tax base on average.
Identification Strategy
Difference-in-Differences Design. Using the following Difference-in-Differences (DiD) approach, I compare the evolution of the share of rich and average income per taxpayer in Obwalden to that in all other cantons in Switzerland:
Yg,c,t=↵+ ·(T R·P R) + ·T R+ ·P R+ t+⌘g+✏g,c,t . (3)
Yg,c,t denotes the outcome at time t in a municipality g belonging to canton c. T R =
[c= 1]is the treatment group dummy which take on the value of 1 for all municipalities in Obwalden and zero otherwise. P R = [t 2006] is a dummy indicating the post- reform period. The coefficient of interest is the DiD estimator measuring the effect of the reform on the outcome. All regressions include time and municipality fixed effects t
and ⌘g, respectively.
Level of Analysis and Statistical Inference. Both outcomes of interest can be measured either at the cantonal or the municipal level. This raises the question of the appropriate unit of analysis.
As tax rates vary at the the municipality level, it seems appropriate to carry out the
analysis at the municipality level.8 In addition, it is very likely that a substantial part of the unexplained variation that is captured by the error term comes from municipality characteristics, such as, e.g., the availability of land or its proximity to lakes, mountains, and other natural amenities, which are valued by rich taxpayers (Young et al., 2016).
Municipality fixed effects ⌘g control for unobserved heterogeneity at the state level, at which the intervention happens.
An argument against carrying out the analysis at the municipality level is that this would artificially increase the number of observations and hence lowers the standard errors. I therefore also specify an alternative model with more conservative standard errors where the unit of analysis is the canton (equation (3) remains unchanged except for the unit fixed effect which becomes ⌘c).
In both specifications it is likely that observations within the same canton are cor- related. Especially in the specification at the municipality level clusters of units, rather than units, are assigned to treatment, which makes clustering an experimental design issue (Abadie et al., 2017). Following the important work by Bertrand et al. (2004) and suggestions in Cameron and Miller (2015), I therefore report robust standard errors clus- tered at the canton level, which is the standard in such panel analysis by geographical areas.
With a total of 26 cantons, however, the number of clusters is relatively small, and although there is no consensus in the literature about how many clusters are necessary, cluster-robust standard errors are susceptible to bias, too, when the number of clusters is small. I address the issue of a small number of clusters by also reporting wild boot- strap confidence intervals as suggested in the literature (e.g., Angrist and Pischke, 2009;
Cameron and Miller, 2015).
As final remark on this discussion about the correct inference, it is important to note that in the present case, I observe the universe of taxpayers across all Swiss municipalities and cantons. Therefore, no uncertainty is introduced through sampling, on which classical
8Importantly, municipalities did not increase their multipliers in response to the cantonal reform, as explained in Section 3 and shown in Figure A2 in the Appendix.
inference is based. “Random sampling assumptions are not natural when considering states or counties as units of observation,” as Manski and Pepper (2018) put it.9
To take into account the varying size of municipalities (cantons), I weigh each ob- servation by the number of taxpayers in a municipality (canton) in the regression using analytic weights.10
Parallel Trends. The key identifying assumption of the DiD estimation framework is that Obwalden and the rest of Swiss cantons would have followed parallel trends in outcomes if Obwalden had not introduced a regressive tax scheme for top earners. Figure A5 in the Appendix shows the evolution of the difference between Obwalden and the rest of Switzerland for both outcomes. The graphs suggest trends were diverging prior to the reform and Obwald was becoming poorer compared to the rest of Switzerland: the share of rich taxpayers (Panel a) and average income per taxpayer (Panel b) were decreasing compared to other cantons. After the 2006 and 2008 reforms, the gap narrowed and by 2013, income per taxpayer in Obwalden was above the Swiss average. Similarly, the share or rich taxpayers started rising after 2005 and Obwalden caught up with the rest of Switzerland. This suggests that if the reform had an effect, it actually reversed the negative trends in the outcomes. In this case, differing pre-reform trends, would lead to an understimation of the true size of the effect of the reform on Obwalden’s tax base.
To correct for potential differences in pre-existing trends, I adjust the outcome variable as follows: I first regress outcome Yg,c,t for all years prior to the reform on canton fixed effects and canton-specific time trends. Next, I regress the outcome variable Yg,c,t on the predicted values form this first regression, Ydg,c,t, over the whole sample period to finally
9Abadie et al. (2020) develop an alternative concept for drawing inferences when one observes the entire population, where the uncertainty stems from unobservability of some of the potential outcomes.
They show that in this case, in large samples robust standard errors are too conservative. Unfortunately, there is no simple finite-population correction to the robust variance estimator for causal estimands, which is the correction that would be needed in the present case.
10Analytic weights are appropriate precisely to work with group means, as it is the case here. They lead to the same point estimates as frequency weights, but the approach is more conservative as standard errors are larger. The number of degrees of freedom ism (k+1), wheremis the number of municipalities.
Using frequency weights, the number of degrees of freedom isn (k+ 1), withndenoting the number of individuals.
replace the LHS variable in equation (3) with the residuals of this second regression (this approach, suggested by Freyaldenhoven et al., 2019, is similar to the one applied by Kleven et al., 2014, who use the de-trended variable as outcome). I refer to this correction as residualized outcomes
Event Studies. I estimate the reduced-form effect of the tax reform on Obwalden’s tax base using an event study to i) study the validity of the parallel trends assumption required for the DiD approach, and ii) asses the timing of the responses. I consider the following specification:
Yg,c,t=↵+ X11
k= 11
k·Rkc,t+ t+⌘g+✏g,c,t (4)
Yg,c,t, t,⌘g, and ✏g,c,t are defined as in equation (3) above. Important are the covariates Rc,tk for k = 11, ..,11, which represent a sequence of event study dummies that are k years away from the 2006 tax reform in Obwalden. The coefficients of interest are the k
that capture the deviation in the outcomekyears before and after the reform in Obwalden for municipality g in canton c. The year 2005, just prior to the reform, k = 1, serves as reference period. The plausibility of the identifying assumption of parallel trends in outcomes can be tested with the event study design by checking whether the dummy coefficients well before the reform k = 11, ..., 2 are equal to zero. Furthermore, the event study provides transparent illustration of how the reduced-form effect is distributed over time and how the correction of pre-trends described above affects the results.
Results: Effect on Share of Rich Taxpayers
Panel a) of Figure 3 shows the event study graphs of the share of rich taxpayers in Obwalden compared to all other cantons in Switzerland, as described in equation (4).
Standard errors used to compute the 95% confidence intervals are clustered at the cantonal level. Like Appendix Figure A5.a), the graph shows that prior to the reform Obwalden’s share of rich taxpayers was falling (blue line with circles). The estimates suggest that the
reform reverted this trend, as compared to 2005 the share of rich increased steadily after the tax reforms in 2006 and 2008. After correcting for the per-trend, the event study estimates are not statistically significant before 2005, hence the identifying assumption of parallel trends in outcomes prior to the treatment holds. By 2016, the share of rich had increased by 0.65 percentage points (0.5 pp without pre-trend correction) compared to other cantons. This corresponds to an increase of 123% relative to Obwalden’s share of rich in 2005.
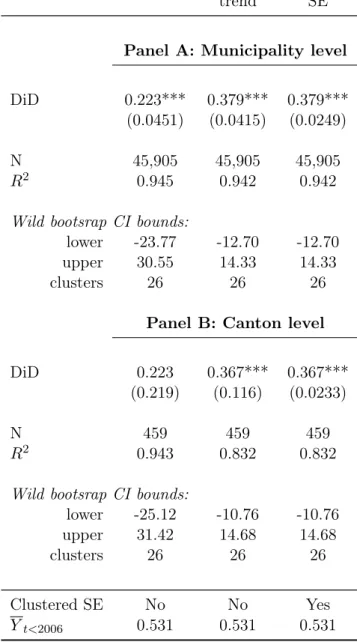
Table 1 shows the corresponding DiD estimates of the share of rich taxpayers with taxable income above 300,000 CHF in each municipality, estimated according to equation (3) and extensions thereof. Top Panel A shows results at municipality level, the more conservative approach based on canton level data is shown in bottom Panel B. Results are highly robust to changing the level of analysis. Overall, the estimates suggest that the share of rich was about 0.38 percentage points higher than in other cantons over the 2006–2016 post-reform period thanks to the reform. That is a 72% increase compared to Obwalden’s pre-reform average. Results are statistically significant under normal as well as under cluster-robust standard errors. Wild bootstrap cluster confidence intervals turn out to be implausibly large: while the share of rich taxpayers ranges between zero and 16.23% post 2005 across all municipalities, with an average of 1.15% and a P99 of 8.61%, the wild bootstrap confidence interval lies in the range [-10.76, 14.68]. This questions the validity of the wild bootstrap cluster for inference in the present case. The problem is that with only one treated cluster, the wild bootstrap clustering does not perform well and severely under-rejects the null, as discussed in MacKinnon and Webb (2020).
If rich taxpayers moved to Obwalden from other cantons because of the reform, the control groups were negatively treated and the coefficients in Table 1 would be upward biased. Using information on the origin of the post-reform in-movers form cantonal tax data from Obwalden described in Section 5.2, I correct the federal income tax data by adding the number of movers back to their municipality of origin before computing the share of rich. Due to the small size of Obwalden compared to the other cantons who
sent taxpayers to Obwalden, however, the resulting estimates (not shown) are identical to those reported in Table 1.
Results: Effect on Average Income per Taxpayer
The estimated effect on the evolution of net income per taxpayer over time is shown in Panel b) of Figure 3. Note that while the outcome is income per capita, the shown estimates are re-scaled relative to average income in Obwalden in 2005, such that they represent percentage changes relative to that year. The event study graph does not indicate diverging pre-existing trends between Obwalden and the rest of Switzerland, and hence the pre-trend correction hardly changes the results. The effect of the reform is visible from 2006 onward, as income per taxpayer in Obwalden rose compared to all other cantons in Switzerland in the post-reform years. In 2016, real average income per taxpayer was an estimated 8,658 CHF higher than in the rest of Swiss cantons due to the reform (note that I omit the 2015 estimate from the graph and subsequent regressions, as it is driven by a large outlier, see Panel b) of Figure A5 in the Appendix). Compared to an average income per taxpayer of 53,750 CHF in 2005, this is an estimated increase of 16%.
Table 2 shows the regression results. Baseline estimates suggest that real income per taxpayer in Obwalden increased by about 10% with respect to the pre-reform average relative to other cantons. Including 2015, the estimate increases the estimate to approx- imately 8,500 CHF, implying a 15.8% increase in average income per taxpayer over the entire post-reform period. The increase was considerable not only among the rich (Col- umn 5) but also among those with taxable income < 300K CHF (Column 4). However, the relative effect was larger among the rich, suggesting that the group of rich taxpayers was richer on average in the post-reform period relative to the rich in other cantons. Note that Columns 4 and 5 do not exclude 2015: the sample of non-rich in Column 4 is not affected by the outlier. Since it is characteristic of top earnings to be very volatile, I include the outlier from 2015 in Column 5. The point was precisely to attract this kind
of taxpayers.
Column 6, rather than using municipality (canton) as the unit of analysis, uses munic- ipality (canton)cells of average income per taxpayer for different socio-economic groups, defined by their civil status (married, single parents, married with children, and single tax- payers with no dependents as reference category), and employment status (self-employed, non-working, retiree, and employee as reference category). Since these characteristics are correlated with different income levels and the socio-economic composition of taxpayers may vary across jurisdictions, this specification controls for variations in municipalities’
(cantons’) socio-economic composition. Controlling for these factors lowers the estimated increase in income per taxpayer relative to other cantons to approximately 3,300 CHF, implying an increase of 6.1%.
6.2 Stock and Flow Elasticities of Rich Taxpayers
To estimate the elasticity of the in-flow and the stock of rich taxpayers in the canton with respect to the average net-of-tax rate, I use the detail-rich individual cantonal income tax data from Obwalden described in Section 5.2. This data allows to identify movers who moved to Obwalden in a given year. I follow a DiD approach commonly used in the literature estimating tax elasticities by comparing income groups affected differently by a tax change (see for example Kleven et al., 2014; Kleven and Schultz, 2014; Sillamaa and Veall, 2001; Auten and Carroll, 1999). As control group I define taxpayers with income just below the regressive threshold of the tax scheme. To take into account potential endogeneity of tax rates, I instrument the tax rates using an instrumental variable (IV) approach and estimate a two-stage least squares (2SLS) model.
Identification Strategy
Reduced-Form Difference-in-Differences Estimation. To estimate the effect of the reform on the stock and inflow of rich taxpayers, respectively, I aggregate the indi- vidual data into year t, treatment groupi={0,1}cells and estimate a DiD model of the
form:
Ni,t =↵+ ·(T R·P R) + ·T R+ t+✏i,t ,
where Ni,t denotes the number of taxpayers in group i, T R = [i = 1] is the treatment group dummy,P R = [t 2006]is the post-reform dummy, and t are year fixed effects.
The coefficient of interest is the DiD estimator on the average annual increase in the number of residents or in-movers, respectively, after the introduction of the tax reform in 2006. To isolate the effect of the regressive income tax reform, in a first specification I exclude years after 2007 and hence the 2008 flat rate tax reform. With seven years of observations (five pre- and two post-reform), and two groups, this leads to 14 group-year cells for the regression analysis. In a second specification, I include all post-reform years to estimate the overall effect of the two reforms, in which case the regression analysis is based on 20 observations.
Definition of Control Groups and Parallel Trends. The control group is defined as having rate-determining income below the regressive threshold, yet the income range to be considered to obtain a valid control group depends on a number of considerations.
Theoretically, one would want to use taxpayers just below the threshold. In practice, however, it may not always be clear to the taxpayers themselves whether their rate- determining income will be just below or just above the threshold. Taxpayers just below the threshold might have expected to be above the threshold or expected to reach higher income levels in the near future, in which case they were affected by the treatment. Or their former canton (or country) of residence’s income definition resulted in a higher taxable income than the taxable income they had according to Obwalden’s tax laws.
Defining the control group through an income range which is further away from the threshold is a way to ensure the control group did not respond to the treatment due to the aforementioned reasons. In addition, the control group must be sufficiently large.
Finally, for the control group to be valid, it must fulfill the parallel trends assumption in the pre-reform years.
Figure 4 shows event study graphs for four different definitions of control groups for the stock (Panel a) and the inflow of rich taxpayers (Panel b). The control group with incomes in the range of 60%–80% of the threshold clearly fulfills the parallel trends assumption in the years prior to the reform and I use this group as the main control group in all specifications (I report results on other control groups for robustness). Figure A6 in the Appendix further shows the absolute number of treated taxpayers compared to the control control group over time.
Balance of Treatment and Control Groups. Table 3 presents descriptive statistics for the treatment and control groups. While they differ from the average taxpayer living in or moving to Obwalden, they are similar to each other in most characteristics. Taxpayers in the treatment group are more likely to be foreigners, and they derive a larger share of their income from capital and self-employment than the control group. They also moved to Obwalden from places further away. Only a very small number of taxpayers benefit from some sort of weekly residency elsewhere. Their share is lowest among the treated, with 0.6% in the stock and 2.1% among the inflow of taxpayers. The rich in Obwalden are therefore not just residents for tax purposes with a main residence elsewhere. Although I lack information on taxpayers’ workplace, self-reported occupations or professions reveal that these rich taxpayers are professionals including doctors, lawyers, and economists.
52% are employees, and about 15% are self-employed. The remaining 33% are retirees or non-active in the labor market.
In the total population there where no shifts in the origin of taxpayers, but the composition of the treatment and the control groups experienced some changes after the reform: in the treatment group, the share of taxpayers coming from Zurich, Bern, and from abroad increased in the post-reform years, and rich taxpayers moved to Obwalden from 19 different cantons compared to 12 prior to the reform (see Figure 2). In the control group, in-movers came from 15 different cantons after the reform, and from 13 in the years 2001–2005. This suggests that the reform was successful in attracting especially rich taxpayers from further away.
Two-Stages Least Squares (2SLS) Estimation. To account for potential endogene- ity of the tax rates, I estimate the elasticity of the number of rich taxpayers with respect to the average net-of-tax rate using a 2SLS instrumental-variable approach, following Kleven et al. (2014). This approach takes into account that the treatment, i.e., the tax reform, may not have perfectly determined migration decisions (for similar applications see Angrist, 1990; Waldinger, 2010). I aggregate the individual data to year-group cells for the period 2001–2007. The second stage takes the form:
logNi,t =↵+⌘·log(1 ⌧¯i,t) + ·T R+ t+✏i,t , (5)
where (1 ⌧i,t) is the net-of-tax rate of group i. I estimate the stock and the flow elasticities, ⌘S and ⌘F, with respect to the average net-of-tax rate, ⌧¯. In the first stage, I instrument for the net-of-tax rate with the treatment interaction dummy DiD2006 = T R· [t 2006]. The identifying assumption here is that the reform affected tax rates, i.e., the treatment, but that it did not have a direct effect on the number of rich taxpayers living in or moving to Obwalden. The first stage therefore takes on the form:
log(1 ¯⌧i,t) = ·DiD2006+ ·T R+ t+ui,t. (6)
In a second set of regressions I add an instrument for the 2008 reform to equation (6) to make use of the whole time frame available. The first stage is accordingly modified to:
log(1 ⌧i,t) = 1·DiD2006+ 2·DiD2008+ ·T R+ t+ui,t. (7) DiD2006 = T R· [2006 t < 2008] is the original DiD treatment interaction dummy, and DiD2008 =T R· [t 2008] identifies the second reform.
First Stage. The identifying variation in the average net-of-tax rates, 1 ⌧¯, created by the 2006 and 2008 tax reforms is shown in Figure 5. In 2006, treated residents (Panel a) faced an increase of ' 4% in their average net-of-tax tax rate, for the control group
the net-of-tax rate rose by < 2%. In turn, the 2008 flat rate tax reform benefited the control group substantially more than the rich. Overall, the Figure shows three clearly distinguishable tax regimes over the period 2001–2010. For in-movers (Panel b) the graph is more noisy, with results of the same qualitative nature: the 2006 reform substantially increased the net-of-tax rate of the treated, the 2008 reform led to largest increases in the net-of-tax rate among the control group. The remaining difference in (1 ⌧¯) after introduction of the flat rate tax in 2008 stems from the progressive federal tax. All first stage regressions are highly significant with large F statistics, and the DiD interaction term is a strong predictor of the net-of-tax rates.
Results: Elasticity of the Stock of Rich Taxpayers
The results for the stock of rich taxpayers are summarized in Panel A of Table 4.11 The reduced form estimates (Columns 1 and 2) suggest that in the first two years after the introduction of the regressive tax the number of taxpayers increased by 31, or by 4.5%
when estimated in logs (although the latter is not statistically significant) compared to the control group. The corresponding short run elasticity with respect to the average net- of-tax rate, ⌘S, is 1.5 (Column 3) and therefore in the range of the short-run elasticity estimates of 1.3–1.8 found in Kleven et al. (2014). The medium-run elasticity, based on the estimation instrumenting for both reforms described in (7), leads to very similar point estimates. Using an alternative control group with incomes in the range of 60–95% of the income threshold leads to slightly larger elasticity estimates (Column 6 of Table 4): the short-run stock elasticity increases to 2, the medium run elasticity is 1.9.
Results: Elasticity of the Inflow of Rich Taxpayers
Panel B of Table 4 reports analogous results for the annual inflow of taxpayers moving to Obwalden. Due to the small numbers in each group, the underlying time series are more volatile and estimates are less precise. The reduced form estimates in Columns 1
11Detailed regression results are reported in Tables B1–B3 in the Appendix.
and 2, respectively, suggests that compared to the control group, roughly 8 additional high-income taxpayers (orexp(.291) = 34%) arrived in each of the two post reform years 2006 and 2007 due to the reform, yet the point estimates are not statistically significant (standard errors in parentheses are robust to heteroskedasticity). The corresponding flow elasticity estimate,⌘F, is large and amounts to 6.5.
In contrast to the stock elasticity estimates, the inflow elasticity estimates are affected by different definitions of the control group. Since the control group might be responding to the treatment when their income is sufficiently high, redefining the control group as those with income of 55%–75% of the threshold avoids contamination of the control group by the treatment. The resulting estimates become more precise and larger. The elasticity of in-movers with respect to the average net-of-tax rate, ⌘F, lies between 7.2 and 10. These estimates are 4–6 times larger than what Kleven et al. (2014) find for Denmark, and comparable to elasticity estimates of 10 found in Agrawal and Foremny (2019) across Spanish regions.
That medium run estimates are smaller than in the short run suggests moving re- sponses were strongest right after the introduction of the reform. This stands in contrast to the findings in Kleven et al. (2014), where the elasticities build up over time. The ex- planation for this contrast lies in the different settings: in Denmark, foreigners first had to find a high-paying job in the country to qualify for the tax scheme, while in Obwalden eligibility did not depend on the income source nor the nationality. For taxpayers who considered moving to Obwalden it therefore made sense to do so right away and thereby increase the time horizon of their investment.
Robustness
A robustness check using simple OLS without instrumenting the tax rate leads to similar elasticites (see Columsn 4 and 6 in Tables B1 and B2 in the Appendix). Hausman tests for exogeneity indeed suggest endogeneity is not an issue here.
Running the regressions reported in Table 4 using as dependent variable the share
instead of the number of taxpayers in each year-group cell (defined as the percentage of the total number of taxpayers in the canton) leads to almost identical elasticity estimates (reported in Appendix Table B3).
The estimates would be upward biased if the number of high-income taxpayers rose because these taxpayers moved to Obwalden in response to the wealth tax reduction, rather than the regressive income tax. Event studies comparing taxpayers who have income and wealth in the regressive part of the tax schedule to taxpayers who have both, income and wealth just below the respective regressive thresholds, however, do not indicate any effect of the reform.
The large elasticities are in part the result of the small size of the canton with low initial inflows and residence-based taxation (as opposed to taxation at the source). In addition, thanks to the Agreement on Free Movement of Labor with the EU, the pool of potentially treated is large. The estimates serve as a reference point for similar set- tings with no restrictions on migration, especially for small jurisdictions or metropolitan areas within state border regions. They show that workers’ willingness to relocate for tax reasons is high. Note, however, that large elasticities are not only found in small jurisdictions. Akcigit et al. (2016) find that for top 1% superstar inventors in the U.S.
the mobility elasticity lies above 3 and Agrawal and Foremny (2019) find an elasticity of 10 across Spanish regions.
6.3 Revenue Effects
Panel a) in Figure 6 shows the evolution of cantonal income and wealth tax revenue in Obwalden in millions of CHF (right scale) and its share in cantonal income and wealth tax revenue collected in all Swiss cantons (left scale). Personal tax revenue dropped slightly after the reform but picked up again after 2008 and has surpassed pre-reform levels. The share in cantonal tax revenue, however, fell sharply after 2005 and has remained below pre-reform levels (with the exception of 2015, when a large one-time effect doubled income tax revenue in the municipality of Sarnen). The drop in corporate income tax revenue
(Panel b) of Figure 6) was even more substantial, both in absolute and relative terms.
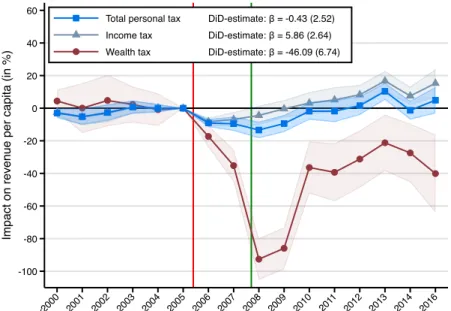
Difference-in-Differences Estimates. To analyze the effect of the reform on cantonal tax revenue, I use the cantonal revenue statistics covering the period 1990–2014.12 Figure 7 shows event studies described in equation (4) for the effect of the reform on revenue from all personal tax, income taxes, and wealth taxes, respectively, per person.13 I account for potential pre-existing trends prior to the reform by residualizing the outcome variable as described in Section 6.1. With this correction for pre-trends, I find a positive effect on income tax revenue per capita 7 years into the tax reductions. The DiD estimate (see Equation (3)) suggests that post-reform income tax revenue per capita was on average 5.9% higher relative to other cantons. This would imply that the income tax cuts did yield Laffer effects. In contrast, wealth tax revenue dropped substantially compared to other cantons. The estimated reduction corresponds to a loss of 46% in wealth tax revenue per person compared to wealth taxes collected in 2005. This effect is exacerbated by the years 2008/2009, when the Great Recession greatly reduced asset values of the wealthy. But even excluding those years, the estimated loss in wealth tax revenue is 34%
compared to other Swiss cantons. Combined with the large and persistently negative effect on wealth tax revenue, the overall effect on total personal tax revenue per capita is approximately zero. Results hold for log revenue at the aggregate rather than the per capita level. Estimated effects on income tax revenue are even smaller at the aggregate level.
Altogether this analysis shows that the 2006 and 2008 tax reforms did not increase revenue in the medium run. In the presence of economies of scale in providing public goods, e.g., schools and roads, taxpayers in Obwalden could nevertheless be better off in a new equilibrium with larger population and lower tax payments per capita. Keller- mann (2007), however, finds that large cantons (in terms of population) also have larger
12Finanzstatistik der Kantone, including cantonal and municipal tax revenues, available online from the Federal Finance Administration: http://www.efv.admin.ch. Results are robust to using only cantonal tax revenue.
13Population data: Swiss Federal Statistical Office, BFS.
expenditures per capita, even after controlling for structural factors. She finds an overall population elasticity of 0.14, such that doubling the population increases expenditures per capita by 14%. This speaks against the economies of scale argument.
Mechanical Revenue Effects and Laffer Rate. Table 5 shows the gains due to new taxpayers attracted and revenue losses on residents.14 This simple accounting exercise shows that net revenue losses were especially large on rich taxpayers already residing in Obwalden. Obwalden benefited from inflows of middle-class households after the 2008 flat rate tax reform, which somewhat helped compensate the losses. The analysis also shows that in the first five years after the reform, the reduced wealth tax accounted for most of the net revenue losses, both among the rich as well as the non-rich taxpayers.
Similar as in aggregate analysis described in Figure 7, the net effect from the income tax was slightly positive. This was achieved thanks to the inflow of non-rich taxpayers.
A simple estimate of the revenue-maximizing tax rate—corresponding to the max- imum of the Laffer curve—suggests that Obwalden was not on the wrong side of the Laffer curve prior to the reform. For the top bracket, Piketty and Saez (2013) show that the revenue-maximizing top rate can be expressed in terms of the elasticity of taxable income (ETI),e, the alpha parameter from the Pareto distribution, a, and the migration elasticity, ⌘S:
⌧⇤ = 1
(1 +a·e+⌘S) (8)
In the case at hand, a = 1.74 (the average value in Switzerland for the period 2000–
2010 and the value in Obwalden in 2005, see Föllmi and Martínez, 2017). Assuming an ETI e = 0.25—a reasonable assumption following the literature reviewed in Saez et al.
(2012) and the meta-analysis by Neisser (2018)—and abstracting from migration effects, (8) yields an estimate for ⌧⇤ of 69.7%. Taking into account the large migration elasticity
⌘S = 2, the optimal rate could be as low as 29.1%. However, given that the top rate was around 30% before 2006, revenue losses from the rich could be expected after further
14The cantonal income tax data from Obwalden does not contain tax payments. I calculate the tax burden for each individual based on rate-determining and taxable income.
reductions of the tax rate.
The empirical finding that Obwalden was not on the wrong side of the Laffer curve is in line with the theoretical analysis by Keen and Kotsogiannis (2003). If the Federal and local government collude to set efficient taxes, they will end up on the upward-sloping side of the Laffer-curve.15 However, the finding is interesting from a political economy perspective, as Laffer effects and the need to keep up with tax competition are one of the reasons put forward in favor of reducing cantonal taxes in Switzerland (see, e.g., Brülhart and Parchet, 2014). Empirical evidence from other countries on Laffer effects remains scarce. Agrawal and Foremny (2019) show that the Spanish Province of Madrid lost revenue when cutting its top marginal income tax rate to attract rich taxpayers—despite successfully triggering large inflows of rich taxpayers from other provinces.
Another reason why Obwalden likely was not able to significantly increase tax revenue despite attracting rich taxpayers is that many of those with rate-determining income above the regressive threshold had substantially lower taxable income (see Table 3).
Stated differently: some of the rich who moved there did not necessarily increase the tax base by their total net worth but rather to a smaller amount.
Due to the inflow of rich taxpayers, the tax base rose enough to substantially reduce transfers Obwalden used to receive from the inter-cantonal fiscal equalization scheme NFA. The scheme is based on canton’s resource potential, defined by the tax base, and not on actual tax revenue, thereby limiting incentives for a race-to-the-bottom tax compe- tition. While in 2008—the year of the introduction of the new fiscal equalization scheme—
Obwalden recieved 62.4 million CHF (1,890 CHF per capita), in 2016 the amount had fallen to 22.3 million CHF (622 CHF per capita). In 2019, Obwalden had to start con- tributing towards the scheme. This indirect effect of the tax reduction therefore hurt the financial situation on top of any direct, mechanical tax revenue losses.
15The theoretical literature (e.g., Milligan and Smart, 2019) has shown that a vertical tax structure with overlapping tax bases and revenue sharing mechanisms like the ones in place in Switzerland can be welfare improving (Köthenbürger, 2002; Keen and Kotsogiannis, 2003).