Doctoral Thesis
Investigation of Water and Gas Distribution in Proton Exchange Membrane Water Electrolyzer
Author(s):
Zlobinski, Mateusz Publication Date:
2021
Permanent Link:
https://doi.org/10.3929/ethz-b-000461234
Rights / License:
In Copyright - Non-Commercial Use Permitted
This page was generated automatically upon download from the ETH Zurich Research Collection. For more information please consult the Terms of use.
ETH Library
Investigation of Water and Gas Distribution in Proton Exchange Membrane Water Electrolyzer
A thesis submitted to attain the degree of DOCTOR OF SCIENCES of ETH ZURICH
(Dr. sc. ETH Zurich)
presented by Mateusz Zlobinski
Mgr. inż., Lodz University of Technology
born on 27.12.1991 citizen of Poland
Accepted on the recommendation of Prof. Dr. Thomas J. Schmidt, examiner Prof. Dr. Thomas Lippert, co-examiner
Dr. Pierre Boillat, co-examiner
2021
3
Summary
Ongoing shift towards clean sources of energy and sector decarbonisation have triggered new challenges that have to be tackled to keep the energy grid stable and sustainable. The operation of renewable sources of energy is, however, intermittent, depending on the weather conditions. High shares of these sources in overall energy grid will lead to high fluctuations of power and grid destabilization. In order to overcome this problem, large-scale energy storage solutions have to be implemented. Converting excess energy during production peaks and utilizing it while facing a valley will maximize the yield of the renewable sources and stabilize the network at the same time. A convenient way of storing high amounts of energy is by converting it into hydrogen gas through electrolysis, which can later be used in mobility, heating and power sectors. Polymer electrolyte water electrolyzers (PEWEs) are one of the most promising among storage devices. High efficiency, dynamics and power density make PEWE especially suitable for coupling with renewables.
There are, however, challenges, which have to be addressed before the market penetration can occur. Currently, the operation and capital costs are too high for the PEWE to be able to compete with fossil fuel based hydrogen production technologies. The research presented in this thesis is aiming to influence both factors. Topic wise, this work can be divided into two sections. The first is focusing on the water and gas distribution within the porous media and novel material designs to optimize the two-phase transport. The other half of the dissertation discusses cationic contamination and mitigation strategies of the PEWE cells.
Potential cost reductions can be discovered by analyzing the two-phase flow within the titanium porous transport layers (PTLs) and further optimizing their design. Novel sintered titanium PTLs are significantly more expensive than commonly used titanium mesh PTLs but also perform much better. Optimization and material modifications can lead to the situation where the operation cost decrease associated to performance improvement will outweigh the capital cost.
The other significant issue reported by industry is associated to the contamination of the
membrane by cationic impurities present in the feed water. The contaminants usually originate
from the corrosion of the metallic parts of the system. However, inefficient purification system
4
can also be a cause of failure. Over the time, the cations accumulate in the membrane and
decrease its conductivity, what finally leads to excessive losses. In this work, the influence of
the cationic impurities on the PEWE is discussed and possible in-situ regeneration methods are
presented. A new method of detection of the presence of the impurities in the electrochemical
cell is also proposed.
5
Zusammenfassung
Die fortschreitende Verlagerung hin zu sauberen Energiequellen und die Dekarbonisierung des Energieproduktionssektors bringen neue Herausforderungen mit sich, die angegangen werden müssen, um das Energienetz stabil und nachhaltig zu halten. Der Betrieb erneuerbarer Energiequellen ist jedoch fluktuierend, abhängig von den Wetterbedingungen. Ein hoher Anteil dieser Quellen am Gesamtenergienetz würde zu hohen Stromschwankungen und zur Destabilisierung des Netzes führen. Eine Möglichkeit um dieses Problem in den Griff zu bekommen, ist eine groß angelegte Implementierung von Energiespeichern in das Stromnetz.
Die Speicherung von überschüssiger Energie bei Produktionsspitzen und ihre spätere Nutzung in Zeiten niedriger Energieproduktion würde den Ertrag der erneuerbaren Quellen maximieren und gleichzeitig das Netz stabilisieren. Eine effektive Art der Speicherung hoher Energiemengen ist die Umwandlung in Wasserstoffgas durch Elektrolyse, das später im Mobilitäts-, Wärme- und Stromsektor eingesetzt werden kann. Polymerelektrolyt-Wasser- Elektrolyseure (PEWEs) gehören zu den vielversprechendsten Technologien für diese Anwendung. Aufgrund ihrer hohen Effizienz, Dynamik und Leistungsdichte eignen sich PEWE besonders für die Kopplung mit erneuerbaren Energien. Ein weiterer wesentlicher Vorteil von Elektrolyseuren ist die Fähigkeit, den saisonalen Speicherbedarf zu sichern, sofern genügend Volumen zur Speicherung von Wasserstoff vorhanden ist.
Es gibt jedoch Herausforderungen die bewältigt werden müssen bevor eine Marktanteil erreicht werden kann. Derzeit sind die Betriebs- und Kapitalkosten jedoch zu hoch, als dass PEWE mit anderen, weniger umweltfreundlichen Technologien konkurrieren könnte. Die in dieser Arbeit behandelte Forschung zielt darauf ab, diese beiden Faktoren zu verbessern. Thematisch kann diese Arbeit in zwei Abschnitte unterteilt werden. Erstens konzentriert sie sich auf die Wasser- und Gasverteilung innerhalb poröser Medien und deren Gestaltung. Zweitens behandelt sie kationische Kontaminations- und Minderungsstrategien in PEWE-Zellen.
Die potenziellen Kostensenkungen und Leistungssteigerungen können durch die Optimierung
der Zweiphasenströmung innerhalb der porösen Transportschichten (PTLs) aus Titan und
weitere Optimierung ihres Designs entdeckt werden. Neuartige gesinterte Titan-PTLs sind
deutlich teurer als die üblicherweise verwendeten PTLs aus Titannetzen, erbringen aber auch
wesentlich bessere Leistungen. Optimierungen und Materialmodifikationen können dazu
6
führen, dass die mit der Leistungsverbesserung verbundene Senkung der Betriebskosten die Kapitalkosten aufwiegt.
Ein weiteres wichtiges Problem, in industriellen PEWE Zellen, stell die der Verunreinigung der
Membran durch kationische Verunreinigungen, die im Wasser vorhanden sind. Die
Verunreinigungen entstehen in der Regel durch Korrosion von Metallteilen im System, jedoch
kann auch ein ineffizientes Reinigungssystem die Ursache sein. Im Laufe der Zeit reichern sich
die Kationen in der Membran an und verringern ihre Leitfähigkeit, was schließlich zu Grossen
Effizienz Verlusten führt. In dieser Arbeit wird der Einfluss der kationischen Verunreinigungen
auf PEWE diskutiert und mögliche in-situ Regenerationsmethoden vorgestellt. Eine neue
Methode zum Nachweis der Anwesenheit der Verunreinigungen in der elektrochemischen Zelle
wird ebenfalls vorgeschlagen.
7
Acknowledgements
This thesis was realized in the Neutron Radiography of Electrochemical Systems group of the Electrochemistry Laboratory at Paul Scherrer Institute and was partially founded by Bundesamt für Energie (BFE) in Switzerland.
At the very beginning, I would like to express my gratitude towards Prof. Dr. Thomas J. Schmidt for giving me the opportunity to realize presented hereby PhD thesis. The amount of time and availability Prof. Schmidt provides is something for what every student would be grateful. I would also like to acknowledge how approachable he is, making students feel comfortable around him, what I believe has a very positive impact on scientific discussions and personal relations at work.
Secondly, I wish to thank my direct supervisor Dr. Pierre Boillat for his guidance during my doctoral studies. The amount of freedom and independence he provided me at my work while maintaining a high level of support helped me develop many skills. I would also like to express how much I appreciate the fact that Pierre is not only a supervisor to his students but also a friend. I enjoyed my time under his leadership and I am proud to be a part of his group.
Special thanks go to Prof. Dr. Thomas Lippert for agreeing to act as a co-examiner on relatively short notice and for very insightful discussions.
I would also like to thank Dr. Lorenz Gubler and Dr. Felix Büchi for their support and valuable input into my work, which definitely increased the quality of the science I did.
Many thanks go to my former master student Meriem Fikry for her hard work and high motivation.
I wish to acknowledge my groupmates Magali Cochet, Dirk Scheuble, Muriel Siegwart, Victoria Manzi, Jong Min Lee, Antonia Ruffo, Wenmei Liu and Ricardo Carreon. You were always for me when I needed help and were always ready to sacrifice your time in order to assist me. You were a great company and a team that anyone could dream of.
A very special place in the acknowledgment section has to be dedicated to my
officemates: Adrian Mularczyk, Steffen Garbe and Ugljesa Babic (order is random… or is it?).
8
During the studies, we all face joyful and hard times but I could always count on you. There was not a single day that I would not enjoy our more and sometimes less constructive discussions and ideas. I could not wish for anything better when it comes to the company and the office spirit that we all managed to create.
I wish to thank my family, Sara and all others that are close to my heart for their endless support, love and encouragement during my PhD journey. They made me believe in myself when it mattered the most.
“Above all else, guard your heart, for everything you do flows from it.”
Proverbs 4-23
9
Contents
SUMMARY ... 3
ZUSAMMENFASSUNG ... 5
ACKNOWLEDGEMENTS ... 7
CONTENTS ... 9
DECLARATION OF SELF-CITATIONS ... 13
1 INTRODUCTION ... 15
1.1 M
OTIVATION... 15
1.2 B
ACKGROUND ON WATER ELECTROLYSIS... 16
1.3 S
CIENTIFIC BACKGROUND AND STATE OF THE ART... 20
2 METHODOLOGY ... 24
2.1 N
EUTRON TRANSMISSION RADIOGRAPHY... 24
2.2 T
RACING OF IONIC IMPURITIES PRESENCE IN THEPEM
USINGG
ADOLINIUM ANDN
EUTRONR
ADIOGRAPHY... 34
2.3 E
LECTROCHEMICAL ANDT
HERMODYNAMIC FUNDAMENTALS... 36
2.4 C
URRENT–
POTENTIAL RELATION AND OVERPOTENTIALS BREAKDOWN... 42
2.5 E
LECTROCHEMICAL IMPEDANCE SPECTROSCOPY... 44
2.6 C
ELL HARDWARE... 46
10
3 TRANSIENT AND STEADY STATE TWO-PHASE FLOW IN ANODIC POROUS TRANSPORT
LAYER OF PROTON EXCHANGE MEMBRANE WATER ELECTROLYZER. ... 48
3.1 A
BSTRACT... 49
3.2 I
NTRODUCTION... 49
3.3 E
XPERIMENTAL... 53
3.4 R
ESULTS AND DISCUSSION... 56
3.5 C
ONCLUSIONS... 66
3.6 A
CKNOWLEDGEMENTS... 67
3.7 S
UPPLEMENTARY MATERIAL... 67
4 ELUCIDATION OF FLUID STREAMLINING IN MULTI-LAYERED POROUS TRANSPORT LAYERS FOR POLYMER ELECTROLYTE WATER ELECTROLYZERS BY OPERANDO NEUTRON RADIOGRAPHY. ... 70
4.1 A
BSTRACT... 71
4.2 I
NTRODUCTION... 71
4.3 E
XPERIMENTAL... 74
4.4 R
ESULTS AND DISCUSSION... 77
4.5 C
ONCLUSIONS... 87
4.6 A
CKNOWLEDGEMENTS... 88
4.7 S
UPPLEMENTARY MATERIAL... 89
11
5 CO
2-ASSISTED REGENERATION OF A POLYMER ELECTROLYTE WATER ELECTROLYZER
CONTAMINATED WITH METAL ION IMPURITIES. ... 91
5.1 A
BSTRACT... 92
5.2 I
NTRODUCTION... 92
5.3 E
XPERIMENTAL... 94
5.4 R
ESULTS AND DISCUSSION... 97
5.5 C
ONCLUSIONS... 110
5.6 C
ONFLICTS OF INTEREST... 111
5.7 A
CKNOWLEDGEMENTS... 111
5.8 A
PPENDIX... 111
5.9 S
UPPLEMENTARYM
ATERIAL... 112
6 DYNAMIC NEUTRON IMAGING AND MODELING OF CATIONIC IMPURITIES IN POLYMER ELECTROLYTE WATER ELECTROLYZER. ... 117
6.1 A
BSTRACT... 118
6.2 I
NTRODUCTION... 118
6.3 E
XPERIMENTAL... 120
6.4 R
ESULTS AND DISCUSSION... 125
6.5 C
ONCLUSIONS... 134
6.6 A
CKNOWLEDGEMENTS... 135
6.7 A
PPENDIX... 135
12
7 CONCLUSIONS AND OUTLOOK ... 137
7.1 S
UMMARIES AND RECAP... 138
7.2 P
ERSPECTIVE AND OUTLOOK... 140
8 REFERENCES ... 142
9 GLOSSARY OF TERMS ... 155
10 PUBLICATION LIST ... 157
10.1 P
UBLISHED PEER REVIEWED ARTICLES... 157
10.2 C
ONFERENCE CONTRIBUTIONS... 157
10.3 P
ATENT APPLICATION... 158
10.4 P
OSTER PRESENTATIONS... 158
10.5 PSI E
LECTROCHEMISTRYL
ABORATORYA
NNUALR
EPORTS... 158
11 CURRICULUM VITAE ... 159
13
Declaration of self-citations
This PhD thesis is based on four peer-reviewed articles published in the scientific journals. Each of the manuscripts is implemented as a separate standalone chapter. A brief introduction and summary is given at the beginning of each of these chapters. The final formatting of the chapters may have been modified within the bounds of the CC BY 4.0 license in order to match the document style. The list of publications and their respective chapters are given below:
ID Publication Chapter
1 M. Zlobinski, T. Schuler, F. N. Büchi, T. J. Schmidt and P. Boillat, Transient and Steady State Two-Phase Flow in Anodic Porous Transport Layer of Proton Exchange Membrane Water Electrolyzer, Journal of The Electrochemical Society, 167, 084509 (2020).
3
2 M. Zlobinski, T. Schuler, F. N. Büchi, T. J. Schmidt and P. Boillat, Elucidation of Fluid Streamlining in Multi-layered Porous Transport Layers for Polymer Electrolyte Water Electrolyzers by Operando Neutron Imaging, Journal of Electrochemical Society, 168, 014505 (2021).
4
3 U. Babic, M. Zlobinski, T. J. Schmidt, P. Boillat and L. Gubler, CO
2-Assisted Regeneration of a Polymer Electrolyte Water Electrolyzer Contaminated with Metal Ion Impurities, Journal of The Electrochemical Society, 166, F610 (2019).
5
4 M. Zlobinski, U. Babic, T. J. Schmidt, L. Gubler and P. Boillat, Dynamic Neutron Imaging and Modeling of Cationic Impurities in Polymer Electrolyte Water Electrolyzer. Article submitted and accepted to the Journal of Electrochemical Society, 167, 144509 (2020).
6
I hereby declare that the thesis is my own original work carried out as a PhD student at Paul Scherrer Institute and ETH Zürich. All other sources used for the thesis have been fully and properly cited. The thesis has not been submitted for a degree to any other University or Institution.
Date: 14.09.2020
Signature: Mateusz Zlobinski
14 Individual contributions of co-authors:
(1) Mateusz Zlobinski. – designed, realized and analyzed experiments and experimental data. Presented data and authored respective manuscripts.
(2) Pierre Boillat. – supervised the work, reviewed, evaluated and co-authored the manuscripts, assisted in the experimental design and provided constant feedback.
(3) Thomas J. Schmidt. – supervised the work, discussed results and experimental designs.
Reviewed, evaluated, and co-authored the manuscripts.
(4) Lorenz Gubler. – assisted in experimental design, discussed results, provided supervision, evaluated and co-authored manuscripts ID-3 and ID-4.
(5) Felix N. Büchi. – discussed results, evaluated and co-authored manuscripts ID-1 and ID-2.
(6) Ugljesa Babic. – performed data analysis, co-designed experiments, and illustrated results for publications ID-3 and ID-4. Co-authored (equal contribution) the manuscript ID-3.
(7) Tobias Schuler. – performed data analysis, co-designed experiments, and illustrated results for publications ID-1 and ID-4.
(8) Meriem Fikry. – assisted data analysis and illustration, co-authored the manuscript
ID-4.
15
1 Introduction
The basic concepts and principles shown in this chapter provide necessary descriptions on the topic of Polymer Electrolyte Water Electrolyzers (PEWEs) and neutron imaging. At the very beginning, the PEWE is placed in the perspective of energy storage in the modern energy grid with its benefits and issues that have to be addressed. The fundamentals of PEWE and electrochemistry are introduced directly afterwards providing a more in-depth view on the physical phenomena which are focused on in this study. Basic information on neutron imaging is also found in this chapter, as it was the main method used to obtain the presented results. The chapter’s final paragraphs discuss the scope, relevance of this work and points at the potential improvements to the technology that could possibly be triggered by presented the results.
1.1 Motivation
Heat, electricity and mobility became part of the primal needs of today’s world. We would
face a worldwide crisis if any of these three were to be compromised. The problem of energy
grid sustainability is usually taken lightly as nobody can imagine the scenario when the power
supply fails since it is an abstract construct for the majority. The population is growing and so
is the energy demand (1). Steadily increasing energy consumption is followed by excessive
emissions, which are bound to the generation process. In order to fight the world pollution,
however, the energy sector is undergoing a transition towards clean, renewable technologies
(2). In Germany, this process is already in an advanced state as, according to the data published
online by Fraunhofer ISE (3), over 50 % of electricity is produced through renewable sources
of energy. There are however also negative implications of such arrangement which have to be
addressed in the near future. Windmills and solar panels, which are currently the most exploited
renewables in Germany, are highly dependent on weather conditions on hourly, daily and
monthly scale. This high intermittency destabilizes the grid and calls for quick response power
delivery systems and storage. The severity of the situation can be very well seen on the
commonly available data provided by power grid operators (3). It is clear that, when renewable
sources of energy become the main supplier, energy storage on large scale in terms of power
and capacity will be necessary. Polymer electrolyte water electrolyzers (PEWE) are capable of
both and could be a part of the solution (4-7).
16
1.2 Background on water electrolysis
Water electrolysis is the process in which the water undergoes splitting into hydrogen and oxygen with the use of electrical energy. If renewable sources of energy supply the electricity, the hydrogen produced in this way can be called “green” because no combustion and CO
2emissions are associated with the electrochemical reaction. Water electrolysis itself is a mature technology as it dates back to the 18
thcentury even though Michael Faraday made its formal introduction, only in the 19
thcentury. Until now, however, water electrolyzers were filling in niche markets where the purity of the gas and other specific to electrolyzer features justified high costs (e.g. space applications, research). There are three types of electrolyzers currently available on the market. Alkaline electrolyzers, being the most mature technology, are the most common and the least. This type is however unable to operate under intermittent conditions and poses a potential threat to the environment due to its liquid and corrosive electrolyte. What also has to be noted is that it is not possible to run alkaline electrolyzers under differential pressure conditions due to the cell separator permeability. Potentially best performing are solid oxide electrolyzers (SOEs) that are still under development. SOEs must , however, operate at high temperatures (above 700
oC) which makes them suitable only for continuous production. Finally, the polymer electrolyte water electrolyzers (PEWEs) are arguably the most versatile and suitable for use with renewable sources of energy due to their dynamic capabilities. The intermittent operation and power fluctuations do not reduce the durability of the PEWE significantly (8). Moreover, the gas purity and performance of the cell are of the top tier. In this work, we aim to bring further improvements to the PEWE, which are promising devices that can become a backbone of the sector coupling and stable green energy system.
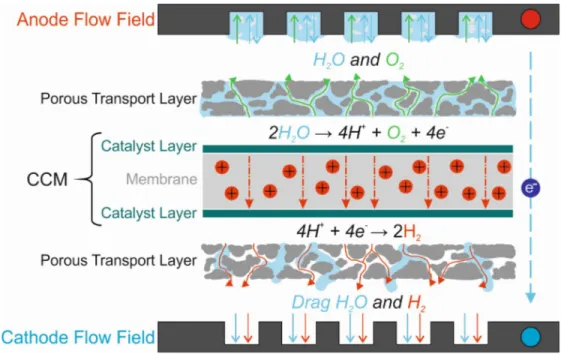
1.2.1 PEWE cell
PEWEs use a solid polymer electrolyte also called proton exchange membrane (PEM)
which once humidified is ion conductive. The reactions in the electrolyzer happen in catalyst
layers (CLs) which are coated on each side of the PEM. The catalyst-coated membrane (CCM)
is compressed between porous transport layers (PTLs) which are responsible for water and gas
delivery and extraction as well as electron conduction. The PTLs are then pressed between flow
fields and compression end plates. The graphical representation of electrolyzer principles is
17
shown in Figure 1-1. From the electrochemical point of view, the cell comprises two half-cells (anode and cathode sides) in which respective reactions take place. Detailed information on the reactions and electrochemical mechanisms will be presented further on.
Figure 1-1. A graphic showing main PEWE cell components and reactions with the depiction of fluids and their flow directions
1.2.2 PEWE components
Each side of the cell (anode and cathode) feature the same types of components. The material and the composition however vary depending on the design and needs of the system – in particular, the anode and cathode catalysts have different compositions. The main components starting from the centre of the cell and their brief descriptions are listed below.
Catalyst coated membrane (CCM). – The proton exchange membrane (PEM) coated
with catalyst layers (CLs) is the main component within which all the reactions take place. The
membrane itself is a non-permeable and electrically insulating material usually based on
perfluorosufonic acid (PFSA). The most common is Nafion developed by DuPont®, which has
been a pioneer in the proton exchange membranes industry for years (9). The proton conduction
is possible thanks to the sulfonic acid groups (SO
3-) which accommodate positively charged
ions when hydrated. Even though PEM is a very good ion conductor (0.1 S∙cm
-1) it is still the
18
biggest contributor to the losses in the whole electrolyzer cell (5). The areal resistance of the PEM is sharply decreasing with temperature and linearly increasing with the membrane thickness. There are however limitations as thin membranes are susceptible to gas cross over leading to dangerous hydrogen-oxygen mixtures. Moreover, increasing temperature negatively affects the durability of the membrane. Therefore, developing a high temperature system utilizing thin membranes while maintaining safety regulations is a topic of discussions nowadays (10-12). Currently, membrane thicknesses between 150 µm – 200 µm are a standard (5, 9).
The CL for PEWE is a porous media with nanometer scale pores, which is usually coated directly on the PEM. CL comprises catalyst particles, ionomer and electrically conductive support. On the anode side, Iridium-based catalysts are used (eg. IrO
2/TiO
2) whereas on the cathode side Platinum supported on Carbon (Pt/C) is usually found. The typical thickness of the CL lies between 10 µm-20 µm and the loadings of noble metals varies from 1 mg/cm
2to 2 mg/cm
2(5, 9, 13).
Porous transport layer (PTL). – PTLs (sometimes also known as current collectors) were intensively investigated in recent years. Two-phase transport of fluids together with electrical and heat conduction functions make optimization a complex task. There are multiple types of porous media available on the market that are suitable for PEWE. Due to high potentials on the Anode side, PTLs are made of Titanium and can be fabricated in various ways (13). State of the art PTLs are manufactured through powder sintering but due to the high cost, coarser Titanium meshes which perform significantly worse (9, 13) are also often used. The cathode side, however, due to the low potential, can also utilize other materials like for example carbon based gas diffusion layers (GDLs) which are commonly used in polymer electrolyte fuel cells (PEFCs) as the cathode PTL (14).
Flow fields (FFs). – Depending on the design of the cell, the flow fields can be an
integral part of compression plates or standalone elements. The design can feature different
channel geometries (e.g. parallel, grid, spiral) to ensure stable delivery and extraction of the
gasses and water. Moreover, the flow field act as electrical contacts between adjacent cells.
19 1.2.3 PEWE degradation mechanisms
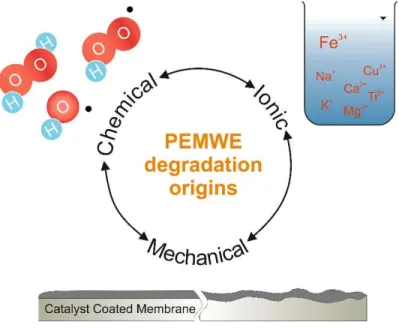
The durability and performance preservation are crucial for successful market penetration of the technology, which is why numerous studies were performed to understand and mitigate the degradation of electrolyzer cells. There are three main mechanisms leading to PEWE deterioration: mechanical, chemical, and ionic contamination. These mechanisms can be triggered by various factors (e.g. unfavorable operating conditions, customer contamination, manufacturing defects). Increasing the PEWE reliability and overall techno-economical attractiveness is one of the key directions that have to be taken in order to successfully integrate PEWE into the energy grid.
Figure 1-2. Degradation mechanisms in PEWE.
Mechanical degradation. – Manufacturing of the cell components according to the
strict standards is crucial for PEWE cells. The alignment of the parts and the compression is
usually controlled by the element spacing and torque on the bolts that compress the whole cell
together. In the worst-case scenario, the CCMs can be subjected to tearing and puncturing by
the porous media or housing edges when the compression is uneven or exceeded. The
mechanical parameters of the CCM are highly dependent on the temperature and the humidity
in which they operate. The higher the temperature the softer the PEM gets thus increasing the
risk of failure, especially for thin membranes.
20
Chemical degradation. – The CCMs in PEWE are vulnerable to radical attacks leading to decomposition and polymer chains scission. Gases crossing over are the main cause of the presence of radical species such as HO HO H O ,
2,
2 2. Quantification of the chemical degradation phenomena is realized by measuring the fluoride release rate (FRR) present in the electro- osmotic drag water. According to studies, the chemical degradation is significantly stronger on the cathode side where oxygen reacts with adsorbed hydrogen forming reactive species (15- 17). Moreover, elevated temperatures have unfavorable impact on the integrity of the CCM (15). Considering that the crossover gases are responsible for chemical degradation it is necessary to further research suppression methods. Overall, before these improvements are made, it seems to be beneficial to operate PEWE at elevated differential pressures, use thick membranes and avoid operation at low current densities.
Ionic contamination – As mentioned in the previous paragraphs the ohmic resistance of the PEM belongs to major overpotential sources. The proton exchange characteristic of Nafion® makes it susceptible to cationic impurities present in the feed water such as
2 2 2
, , ,
Na Mg
Cu
Fe
(18). These impurities usually originate from system corrosion, absence of ion exchangers in the loop (19) and possibly user contamination. The ions occupy the exchange groups in the membrane, which could otherwise be used for proton transport, therefore decreasing the conductivity. The ionic contamination is reversible (9, 18-21) and re- protonation can be done in situ by injecting regenerative media on the cathode side (21) on which further information and details are given in the dedicated chapter in this work.
1.3 Scientific background and state of the art
This subchapter presents the existing challenges in the PEWE field and current state of the art solutions. The focus will be put on the selected areas, which are related to this work in order to show the big picture of the project’s motivation.
1.3.1 Techno-economic considerations
Figure 1-3 presents the contributions of the components to the purchase cost of 1MW
PEWE stack according to the report released by National Renewable Energy Laboratory
(NREL), one of the leading companies in electrolyzer industry (14). It is very well visible that
21
the CCM and PTLs make almost 50% of the overall price. Research institutes work on improving catalyst layers (5, 9, 22-29), membranes (17, 30-33), and crossover suppression techniques (10-12, 34-37) in order to bring down the CCM cost.
Figure 1-3. Component contributions to the cost of 1 MW PEWE electrolyzer stack. (14) The reduction of the capital cost however is not always an optimal solution. It is necessary to investigate the durability and the operation costs as well to determine the most efficient system. The membrane thickness and PTL type are subjected to such considerations in particular. Decreasing the membrane thickness will indeed decrease the cost and ohmic losses of the stack at the expense of durability and safety, unless high quality novel PTLs are used, which are however very expensive.
1.3.2 2-phase flow in the porous transport layers
Water delivery to, and gas extraction from the anode catalyst layer of a PEWE is one of
the processes whose impact on the cell operation is yet to be determined. The water and the
oxygen gas compete with each other for the pore space as the cell operates. Titanium, a
hydrophilic material, promotes water uptake while constantly produced gas is making its way
through the pore network to the outlet of the cell. The presence of the gas at the surface of the
catalyst layer limits the access of the PTL water to CL potentially reducing the catalyst surface
utilization. On the other hand, the CCM itself is soaked with water from where the reactant
22
water is possibly drawn. These problems have been an object of numerous studies in recent years (38-53) in order to determine optimal PTL and flow field’s designs.
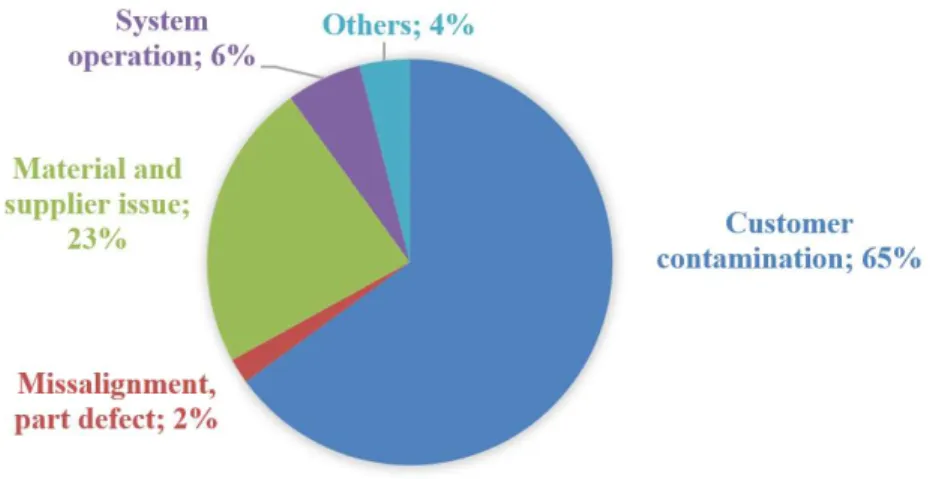
1.3.3 Cationic contamination of the CCM
The contamination of the PEM is a common cause of industrial electrolyzer stacks failures (54) (Figure 1-4). The ions present in the feed water usually come from electrolyzer components corrosion. The other possibility is that the purity of the water fed to the electrolyzer is not sufficient. In order to mitigate the severity of ion release to the water, ion exchangers are installed in the system. The exchangers however cannot operate at elevated temperatures, which enforces either operation at lower performance points or the installation of heat exchangers.
Figure 1-4. Causes of commercial PEWE stack failures. Graph reproduced with the authors consent (54).
Over extended periods, even efficient systems will give in and the resistance of the
membrane will increase due to cationic presence. Once the PEM is contaminated, the losses
become so high that operation is no longer profitable and the stack undergoes expensive
reassembly procedure. This could potentially be avoided, provided a good solution for in-situ
regeneration is developed.
23 1.3.4 Scope of this work
The content of this work can be divided into two subjects: water and gas distribution in PTLs and cationic contamination of the CCM. Both projects rely on neutron imaging results to tackle separate issues. The motivation behind both of these research directions was to underline the sources of losses within the PEM on the fundamental level and identify possible cell performance and durability improvement areas.
In the first chapter, the reader will find basic information regarding topics related to PEWE
research. Chapter 2 explains how the measurement techniques work and how they were
implemented including the image processing steps and cell performance analysis. Chapter 3
describes transient and steady state 2-phase flow mechanisms in the PTLs. The flow character,
gas pathway establishment and re-imbibition of these pathways with water are discussed in
detail. Chapter 4 follows with introduction of microporous layer on top of the PTL and its
influence on water management in the PEWE cells. Water and gas distribution is later on
analyzed in the frame of fundamental understanding of 2 phase flow in porous media and its
implications related to the potential impact on the durability and performance. Chapter 5 makes
a transition into a different area of PEWE research and presents the cationic contaminants
distribution in the CCM based on neutron images. Using Gd
3+ions, it was possible to obtain
enough contrast and trace the accumulation of positively charged ions in the CCM while the
cell was operating. Thanks to the results, a novel approach of operando regeneration of the
PEWE cell was developed and led to the presented proof of concept. Chapter 6 can be
considered as a continuation of the study presented in chapter 5 but on a more fundamental
level. This chapter focuses on transient phenomena and electro diffusive motion of the cationic
species in the contaminated CCM. The simulation designed using the data input from neutron
imaging was successfully correlated with the results from previous experiments potentially
identifying new diagnostic tool for PEWE. The final Chapter presents open-ended questions,
suggestions and experiments that still have to be followed to provide further advancements in
the field.
24
2 Methodology
The Methods used in this work can be divided into imaging related and electrochemical related sections. At the very beginning, the image-processing pipeline and essential experimental steps necessary for complete data processing will be presented. The following section links the imaging and electrochemical parts and describes the principles of ionic presence detection in the membrane and the behavior of ions under the effect of the electric field. Afterwards, electrochemical methods are introduced which include different techniques of performance assessment.
2.1 Neutron transmission radiography
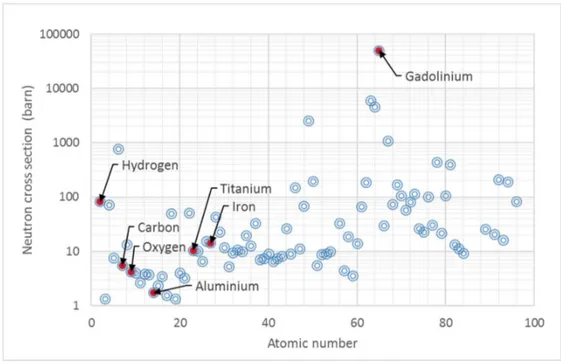
Neutron imaging allows investigating complex structures without the necessity of disassembly and compromising the integrity of the investigated structure. Different sources of perturbations in the images makes raw data difficult to analyze and quantify therefore image processing is necessary. In this section, the theoretical and practical details on the data extraction will be shown.
2.1.1 Introduction to neutron imaging
Imaging techniques provide unique opportunities to investigate the phenomena occurring
inside representative samples in a non-destructive way. There is a wide range of applications
for neutron imaging including biological, medical and engineering fields. The attenuation
coefficient of elements for neutron beam does not scale with the atomic number as it is in case
of X-ray, and it is a rather statistical function, which involves the probability of interactions of
neutrons with the nuclei. Because hydrogen has relatively high neutron cross section comparing
to Carbon, Oxygen and Aluminum but also Iron or Titanium, as seen on Figure 2-1, it makes a
very useful technique for investigating samples in which water content is of interest.
25
Figure 2-1. Neutron cross sections as a function of atomic number with highlighted elements that are relevant to the experiments. The cross section values were taken from (55).
2.1.2 Fundamental information on neutron imaging
Neutrons can be extracted either from a nuclear reactor or using a spallation source, and
are then moderated to reach desired neutron energies useful for imaging experiments (56). The
imaging is usually performed using either cold (8.5 meV) or thermal (25 meV) neutrons. Both
energy ranges have their advantages and the choice has to be made based on experimental
considerations, materials and measurement techniques. Neutron guides and flight tubes deliver
neutrons to the measuring end station. Upon entry, the beam is shaped and collimated if
necessary and then travels directly through the sample to the detector, as shown on Figure 2-2.
26
Figure 2-2. Simplified schematic illustrating the Neutron Imaging setup.
The amount of water or other neutron attenuating compounds in the sample can be quantified using Beer-Lambert law, which relates the attenuated beam to the incident beam with an exponential function according to the following equation:
0 N b
I
att I e
(2.1)
Where N cm (
3) is the number density, ( barn ) the microscopic neutron cross-section, and ( )
b cm the sample thickness. The number density N can also be expressed with general material properties:
Figure 2-3. Beam attenuation after penetrating the sample as a function of object thickness.
N N
AA
(2.2)
27
Where ( / g cm
3) is the material density, ( / A g mol ) the atomic weight, and N
A(1/ mol ) is Avogadro number. More information on instrumentation and measuring with neutrons can be found elsewhere (56).
2.1.3 Application
Neutron imaging is a technique exceptionally suitable for researching water and gas distribution in the porous media and flow channels of PEWE and PEFC due to the good contrast ow water and the high transparency of cells housing components. Moreover, the non-invasive nature of neutron radiography enables measurements of steady state processes over extended periods without influencing the performance of the cell. In recent years, multiple articles were released which focused on the electrochemical devices designs and materials (38, 40, 44, 48, 51, 57, 58) utilizing neutron imaging. Some of the results and highlights from these studies will be presented in the next chapter.
2.1.4 Extracting data from raw images
Let us consider the operating PEWE single cell. The beam attenuation will include the contributions of the water, PTLs, housing elements, and any other object that was put in the field of view during the experiment. In principle, one could use Beer-Lambert law right away and consider each single of these objects, but the geometry, and exact composition of each of the elements, as well as their precise interaction with the neutron beam, would need to be determined with very high accuracy, which is not a very practical approach. A significant simplification is made by taking reference image, which is usually a dry cell. This way, by dividing operating and reference images by each other pixel-wise, we are able to isolate the water contribution to the neutron beam attenuation. In most cases, after referencing, the only component that will is left in Beer-Lambert’s equation is water. Mathematical and graphical explanations are shown below.
For the sake of simplicity, the Beer-Lambert’s Equation 2.1 can be expressed by using
the linear attenuation coefficient N . Assuming that
cellis the weighted average linear
attenuation coefficient for the dry cell components and rearranging the equation in a way that
fluxes are on one side we obtain the following form:
28
bcell 0
cell cell
I e
I
(2.3)
Once there cell is filled with water during the experiment the new term in the exponential factor appears yielding the equation:
exp b bcell
0
water water cell
I e
I
(2.4)
Dividing the two equations (2.3 and 2.4) by each other will give us the difference of the factors in the exponents, which will lead to the situation where the cell components are canceled out and only the contribution related to the water is present.
cell cell
b b
exp b
b water water cell
water water cell cell
I e e
I e
(2.5)
Since the linear attenuation coefficients for water has a known value for the NEUTRA beamline, the water thickness through which the beam passed through can be calculated using the following equation:
log
exp cell waterwater
I b I
(2.6)
The graphical representation, which better illustrates the image processing as it happens, is
shown on Figure 2-4. Assuming that the amount of water in the cell is of the interest, one can
easily isolate the signal and then apply Beer-Lambert’s law using only the parameter for water
in the exponential factor.
29
Figure 2-4. – Demonstration of the objective of the image processing.
Simple referencing of the experimental image is however, the last step of the processing. Firstly, one has to account for various sources of background contributions and noise.
2.1.5 Image processing
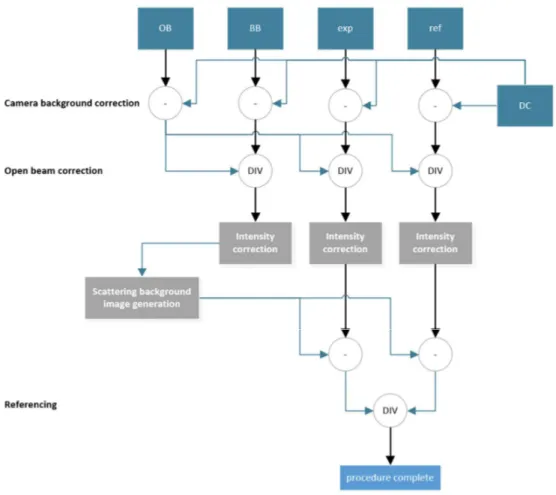
There are various types of images that are taken in addition to the reference and experimental ones for the corrections due to mentioned background influence. Table 2-1 shown below lists all types of acquisitions and gives a short description of each of them.
Each of the image types listed above contains a stack of images which can be averaged
together in order to improve the quality of data at the cost of temporal resolution. The averaging
and merging steps happen as late as possible but always before the image is used for the
correction of other images. The general processing procedure excluding merging steps and
filtering which is usually, case dependent is shown on Figure 2-5.
30
Table 2-1. – Image types obtained during neutron imaging experiments.
Image type Abbreviation Description
Experimental Exp Image of the sample in the state of the interest.
Reference Ref Reference image, which will serve as a divisor in order to compensate for the beam attenuation due to the cell structure.
Open beam (or white beam)
OB Image taken without any object in the beam path in order to characterize the neutron detector or scintillator and obtain the spatial distribution of I
0Dark current DC Image taken without neutron beam and with the camera shutter closed. This image returns the background of the camera due to dark current or other biases.
Black body BB Image taken with the grid of objects that highly attenuate neutrons in the beam. This image will allow estimating the contribution of the scattered neutrons to the transmission image.
The camera background subtraction corrects for the dark current and other biases.
Afterwards BB, Exp, and Ref images are divided by OB (which corresponds to the
0
I
I division
in Equation 2.1). The intensity of the images is corrected to take into account the source
intensity temporal fluctuations, which is done by measuring the average intensity in a so-called
non changing area (NCA) in which the presence of water can be excluded. The final correction,
which has to be done before the referencing of experiment images, is scattering background
(SBKG) correction that is generated using the BB image. A grid of dots made of highly
attenuating material is placed in the beam before the sample. The signal intensity behind these
dots is measured and by using an interpolation function, an image of the scattered background
is created. The SBKG image is subtracted from experiment and reference images. The final step
consists in dividing the experimental image by the reference image pixel-wise after which the
31
processing is complete and Beer Lambert’s law can be directly applied as explained in the previous chapter.
Figure 2-5. – Simplified image processing flow chart.
2.1.6 Neutron imaging setup
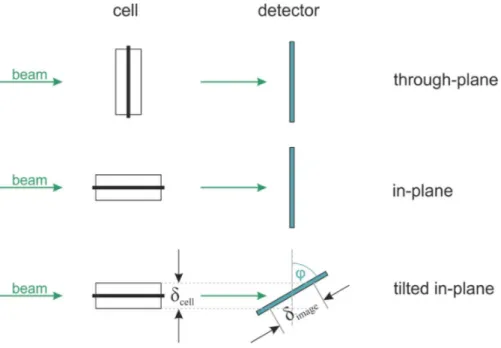
Imaging of PEFC and PEWE cells is usually done using one of the two typical
configurations considering the beam direction with respect to the cell orientation: a through-
plane mode where the beam vector is parallel to the CCM plane vector or an in-plane mode
where the vectors are perpendicular with respect to each other. Another less common
configuration, which was used in most of the studies shown in this work, is a variation of in-
plane configuration which was developed by Boillat et al. (59). The scintillator is placed at an
angle with respect to the beam direction (Figure 2-6). The rotation of the scintillator results
32
in increasing the spatial resolution by stretching the image in the tilted direction. In this particular setup, the tilt angle was 80
o ,which results in a magnification factor of 5.7.
Figure 2-6. – Neutron imaging configurations common for transmission radiography experiments for electrochemical cells (60).
2.1.7 Resolution and exposure time
All imaging techniques regardless, of the beam type, are impacted by four parameters, which interplay with each other: exposure time, detector sensitivity, contrast and resolution. In neutron radiography, the detector sensitivity is determined by the chosen scintillator material and the contrast is usually fixed by the materials being imaged. Resolution and exposure time, however, are often adjusted to the needs of the experiment during the measurement run. In order to obtain a good quality image at high resolution, it is often necessary to integrate for an extended period (e.g. a few minutes). The acquisition of such long exposures is realized by averaging together a number of images taken at shorter shutter openings. This way it is possible to reduce the statistical noise and correct for white spots (high values measured in certain pixels due to gamma rays hitting scintillator).
The pixel size of the used tilted in-plane setup is 6 µm, but the effective resolution is
approximately 20 µm due to blurring effects stemming from the beam spatial incoherence. A
33
2D representation of the blurring effect and characteristic distances is shown on Figure 2-7. The geometrical blurring can be calculated from simple geometrical considerations.
S D
L D
L (2.7)
Figure 2-7. 2D representation of blurring effect in neutron radiography.
Increasing the beam collimation by reducing the source size or by increasing the source- sample distance is one way to reduce the geometrical blurring but it is important to keep in mind that neutron flux will also be lowered. The other way of tackling this issue is the development of imaging cells which can be placed closer to the detector.
Another factor that affects the resolution of the setup is related to the detector itself.
Neutron conversion to light is a two steps process, where neutron capture event results in the emission of charged particles that trigger the scintillation process. The blurring is induced by the fact that these two steps occur at two different locations due to the distance that the charged particle travels before the scintillation occurs. Moreover, the photons that are emitted can be scattered by the scintillator material and induce additional blurring.
It should also be mentioned that the optics and the camera that is finally recording
scintillated light can also impact the image quality, however the current technology is so
advanced that it is not a limiting factor for the spatial resolution in the setups used in this work.
34
2.2 Tracing of ionic impurities presence in the PEM using Gadolinium and Neutron Radiography
The detection of ionic impurities within the membrane of PEWE is a challenging task considering that PEM is a relatively well attenuating material when soaked with water.
Moreover, as already mentioned, small amounts of cationic impurities can influence the PEWE performance in a significant way (18, 20, 21, 61, 62). Luckily, one of the strongest neutron attenuators, Gadolinium, is also a trivalent cation what makes it a perfect fit for a model membrane contaminant representing Fe
3+. It is however important to prepare the setup accordingly to obtain satisfactory contrast since Gadolinium is one of the strongest attenuators.
2.2.1 Obtaining contrast between a membrane and contaminant ions
One possibility is to reduce the amount of the material through which the beam passes what will allow use of more concentrated contaminating mixtures while avoiding signal saturation. For this reason, one could develop electrochemical cells that are adapted for these particular kinds of experiments. For example in common design, there is usually a certain amount of uncoated membrane around the active area, which serves primarily as a sealing element. One can potentially design the cell where this uncoated area will be minimized, therefore preserving the signal.
Another simpler way to improve the transmission is to feed electrolyzer with heavy water,
which is almost transparent to the neutron beam, in comparison to normal water. Low
concentrations of highly attenuating Gadolinium in the membrane will be very well visible in
the images. As far as imaging is concerned, this solution seems to be perfect but if we look at
the electrochemical side, some issues appear. D
2O and H
2O do not behave the same in the PEM
systems due to different kinetic effects (63). Correlating the performance of the cell with the
presence and movement of the ions in the CCM is therefore not straightforward and introduces
another degree to the problem in the investigation. The fundamental principles and the way the
cations move in the CCM will be however unaffected by lowered performance. Some change
in the diffusion and migration coefficients are however, expected due to the higher viscosity of
D
2O (~10% higher than H
2O). Moreover, judging by the previous investigations in the field of
PEMFC substituting H
2O with D
2O does not seem to introduce any further issues (64).
35
Both of the presented solutions have their advantages and disadvantages and depending on the experiment goal, one or the other might be more suitable. In presented here experiments the substitution of the H
2O with D
2O was used due to the facts that the downsides of the method were considered irrelevant to the mechanisms that we aimed to observed and its simplicity.
2.2.2 Optimal contaminating mixture
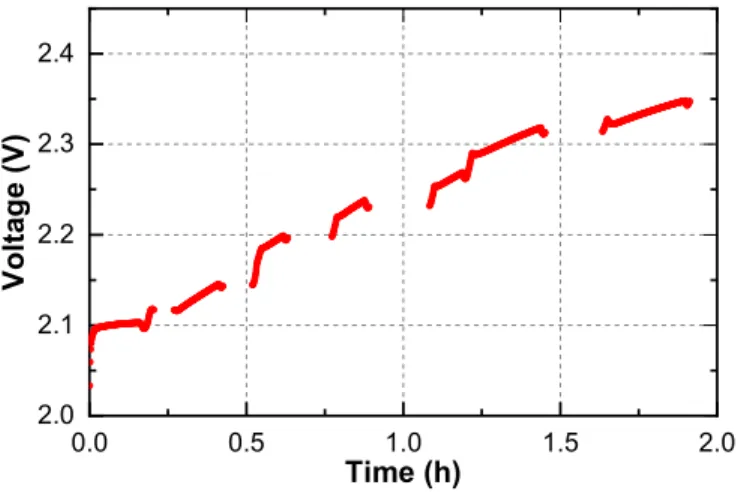
Previous research on the topic of PEWE reversible degradation provided sufficient information on the severity of the contamination with respect to the concentration of the contaminant in the feed water (18, 20, 61). The optimal concentration of the contaminating solution for the neutron imaging experiments was determined empirically. The factors that were of most interest were the temporal profile of the contamination process and the magnitude of the voltage increase at the end of the experiment. The parameters were chosen in a way that allows the experiment to be controlled comfortably and that each step could be easily captured on the images. Gadolinium (III) sulfate was dissolved in the feed water with a ratio that returned the concentration of 0.5∙10
-3mol
Gd3+/L. Operating electrolyzer on such mixture resulted in a voltage increase of ca. 0.2 V/h (see Figure 2-8). Each contamination run was performed until the final voltage increase was around 300mV. Immediately afterwards, the feed water is replaced by fresh supply to prevent further contamination during the experiments.
Figure 2-8. – Temporal voltage profile of contamination process of 25 cm
2electrolyzer using 0.5mMol/L Gadolinium (III) Sulfate. Gaps in the voltage curve represent the impedance spectrum measurement.
0.0 0.5 1.0 1.5 2.0
2.0 2.1 2.2 2.3 2.4
V o lt ag e (V )
Time (h)
36
2.3 Electrochemical and Thermodynamic fundamentals
The general equation of water splitting through the process of electrolysis can be written as follows:
2 ( ) 2( ) 2( )
1
l R g
2
gH O H H O (2.8)
The water in liquid form is delivered to the electrochemical cell, floods the whole anode compartment and humidifies the CCM. Water vapor fed electrolysis through PEWE is also possible but, due to the performance and overall complexity of the system, it is currently not a technically viable option. Equation 2.8 can be rewritten as a sum of two half reactions.
2 ( ) 2( )
1 2 2
l
2
gH O O H
e
Anode (2.9)
2 H
2 e
H
2( )gCathode (2.10) The anode is the electrode where the oxidation of water happens and oxygen is evolved (oxygen evolution reaction, OER) accordingly to equation 2.9. The protons migrate through the PEM to the cathode side where they are reduced to evolve hydrogen gas (hydrogen evolution reaction, HER). The electrons produced at the anode and consumed at the cathode travel through the external electrical circuit.
In order to conduct the endothermic water splitting reaction a certain amount of thermal and electrical energy has to be delivered given by reaction enthalpy H
R:
0R
R R R
S
H G T S
(2.11)
By rearranging equation 2.11 it is possible to calculate the change in Gibbs free energy
based on enthalpy and entropy changes which are tabularized with their values at standard
conditions shown in the table below:
37
Table 2-2 Standard enthalpy of formation and standard entropy for water electrolysis compounds, data taken from (13).
Substance H
R0(kJ/mol) S
R0(J/mol/K)
H O
2liquid -285.83 69.942
H
2gas 0 131.337
O
2gas 0 205.817
Gibbs free energy or free enthalpy of reaction at standard conditions ( G
R0equals 236.483 kJ/mol. Assuming that there are no losses and therefore the reaction is reversible we can calculate the reversible cell voltage E
0REVthat has to be applied for the reaction to occur.
0
0 R
1.23
REV
E G V
z F
(2.12)
Where z 2 is the number of exchanged electrons and, F 96485.33 s∙A/mol is the Faraday constant.
Figure 2-9 shows how much energy has to be supplied to the system in order to perform
water splitting as a function of temperature. The higher the temperature of the system (and thus
thermal energy delivered) the less electrical energy is necessary to trigger the reaction. PEWE
typically operates at the temperatures between 50
oC (≈323K) and 80
oC (≈352K) and the change
in total energy demand in this range is negligible what simplifies later calculations.
38
Figure 2-9. Electrical, thermal and total energy demand for water electrolysis as a function of temperature. The figure have been reprinted from Babic et. al. (9).
If there was no external heat, source all the work would have to be performed by electricity and therefore the required cell voltage would be higher. This voltage is called thermo-neutral voltage E
th0. In practical operation conditions, due to losses, the voltage is higher than the thermoneutral voltage and no heat has to be supplied to the electrolyzer.
0
0 R
1.48
th
E H V
z F
(2.13)
Calculation of the reversible cell voltage at conditions different than standard is possible through the Nernst equation which takes into account the pressure and temperature dependence of G
Rand H
Rhas the following form:
22 2
0
ln
0.52
H O
REV REV
H O
R T a
E E
F a a
(2.14)
39
Where R - Universal gas constant; F – Faraday constant; T - Temperature; and a
xncorresponds to the activity of respective species with their stoichiometric numbers in the power.
The activities can also be substituted by partial pressures yielding the following form of the Nernst equation:
2 2
0
0.5
ln 1
REV REV
2
H O
std std
E E R T
F p p
p p
(2.15)
p
std- Pressure at standard conditions. Since water is given in the liquid form, the activity is equal to one. In the following form, Equation 2.15 directly reveals that, the reversible cell potential increases with pressure and decreases with temperature.
Gas production rate. – Faraday’s law of electrochemistry links relates the electrical charge consumption with the reaction rate.
n Q
z F
(2.16)
The amount of moles that are output are directly proportional to the electric charge Q that has been passed through the cell – under the realistic assumption that no important side reactions are occurring. The equation 2.16 can also be rewritten for a more technical purpose by extracting the time constant and mass of the substance.
I t M
m z F
(2.17)
Where I - current drawn by the cell (A); t - time (s); M - molar mass (u); z - valence (-); F
- Faraday’s constant (s∙A/mol); m - mass (kg).
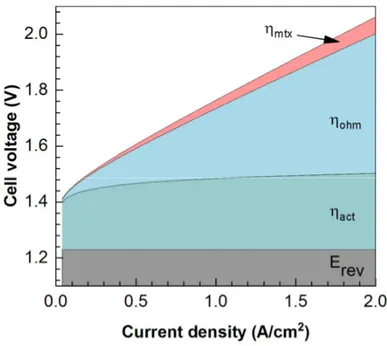
40 2.3.1 Voltage losses
The previous paragraph provided insights on fundamentals of electrolysis and the ideal cell voltages at standard conditions were calculated. There are however, significant losses in PEWE usually expressed as over-potentials, which can be broken down into three categories:
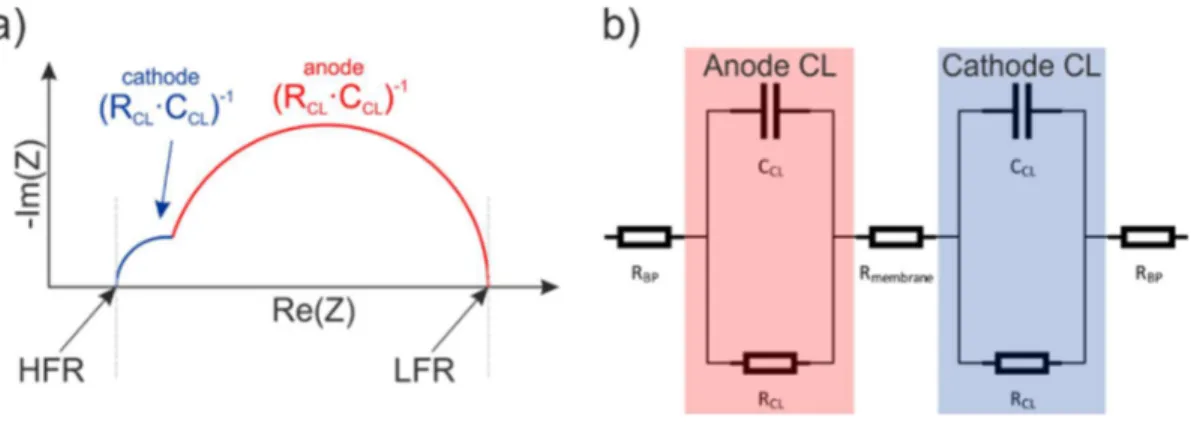
Figure 2-10. Overpotential contributions marked on the polarization curve of PEWE.
Activation overpotential.
act– This first loss term is associated to the reactions and the electron transfer between redox couples. The activation overpotential is directly connected to the catalyst layer properties and the reaction rates. The total current density on each electrode of the cell at given overpotential can be calculated using Butler-Volmer equation (Equation 2.18 for Anode and 2.19 for Cathode side respectively).
On the Anode side, net current density due to OER and ORR reactions is given by:
0, /
exp
OER ,exp
ORR ,a OER ORR OER ORR act OER act ORR
F F
i i i i
R T R T
(2.18)
On the Cathode side HOR and HER reactions result in the following current density:
41
0, /
exp
HOR ,exp
HER ,c HOR HER HOR HER act HOR act HER
F F
i i i i
R T R T
(2.19)
i
0is the exchange current density and
xthe respective transfer coefficients. Currently available Platinum-based catalyst layers make the (HOR, HER) reactions on the cathode side highly reversible. Thanks to the very high exchange current density, resulting overpotentials coming from HER and HOR reactions are negligible. Moreover, the current density associated to ORR reaction direction can be considered negligible under PEWE operating conditions because of strong electrode polarization favoring forward reaction. Equation 2.18 is therefore simplified accordingly by excluding the small terms yielding the final equation for activation overpotential that accounts exclusively for the OER contribution.
0, ,
0,
exp
OERln
a c OER act OER act
OER OER