Inaugural-Dissertation zur
Erlangung des Doktorgrades
der Mathematisch-Naturwissenschaftlichen Fakult¨at der Universit¨at zu K¨oln
vorgelegt von Farheen Naqvi aus Amroha, Indien
K¨oln, 2011
The spin and configurational structure of excited states of
127Cd,
125Cd and
129Cd, having two proton and three, five and one neutron holes, re- spectively in the doubly magic
132Sn core have been studied. The isomeric states in Cd isotopes were populated in the fragmentation of a
136Xe beam at an energy of 750 MeV/u on a
9Be target of 4 g/cm
2. The experiment was performed at GSI Darmstadt. The neutron-rich Cd isotopes were se- lected using the Bρ − ∆E − Bρ method at the FRagment Separator (FRS).
Event by event identification of fragments in terms of their A (mass) and Z
(charge) was provided by the standard FRS detectors. The reaction residues
were implanted in a plastic stopper surrounded by 15 Ge cluster detectors
from the RISING array to detect the γ decays. In
127Cd, an isomeric state
with a half-life of 17.5(3) µs has been detected. This yrast (19/2)
+isomer
is proposed to have mixed proton-neutron configurations and to decay by
two competing stretched M 2 and E3 transitions. Experimental results are
compared with the isotone
129Sn. In
125Cd, apart from the previously ob-
served (19/2)
+isomer, two new metastable states at 3896 keV and 2141
keV have been detected. A half-life of 13.6(2) µs was measured for the
(19/2)
+isomer, having a decay structure similar to the corresponding iso-
meric state in
127Cd. The higher lying isomers have a half-life of 3.1(1) µs and
2.5(15) ns, respectively. Time distributions of delayed γ transitions and γγ-
coincidence relations were exploited to construct decay schemes for the two
nuclei. Comparison of the experimental data with shell-model calculations is
also discussed. The new information provides input for the proton-neutron
interaction in nuclei around the doubly magic
132Sn core. The γ decays of
the isomeric states in
129Cd were not observed experimentally. The reasons
for the non-observation of delayed γ rays for
129Cd are either an isomeric
half-life of less than 93 ns based on the experimentally obtained isomeric ra-
tios of the (19/2)
+in
127,125Cd, or an E3 spin trap emerging from shell-model
calculations.
Der Spin und die Konfiguration von angeregten Zust¨anden in
127Cd,
125Cd und
129Cd wurden untersucht. Die Isotope entsprechen zwei Protonen- und drei, f¨ unf bzw. ein Neutronen-Loch Konfigurationen im doppelt magischen Kern
132Sn. Die isomeren Zust¨ande in den Cadmium-Isotopen wurden durch Fragmentation von
136Xe (750 MeV/u) an einem 4 g/cm
2 9Be Target pop- uliert. Das Experiment wurde an der GSI Darmstadt durchgef¨ uhrt. Die neu- tronenreichen Cadmium-Isotope wurden mittels der Bρ − ∆E − Bρ Methode am FRagment Separator (FRS) selektiert. Zur Bestimmung der Masse (A) und Kernladungszahl (Z) der Fragmente wurden die Standard-FRS Detek- toren eingesetzt. Die zu untersuchenden Fragmente wurden in einen passiven Stopper implantiert, der von 15 Ge Detektoren des RISING Arrays umgeben war, um γ Zerf¨alle zu messen. In
127Cd wurde ein isomerer Zustand mit einer Halbwertszeit von 17.5(3) µs gefunden. F¨ ur diesen isomeren (19/2)
+Yrast-Zustand, der ¨ uber M 2 und E3 ¨ Uberg¨ange zerf¨allt, wird eine gemis- chte Proton-Neutronen Konfiguration vorgeschlagen. Die experimentellen Ergebnisse wurden mit dem Isoton
129Sn verglichen. In
125Cd konnten neben dem zuvor beobachteten (19/2)
+Isomer zwei neue metastabile Zust¨ande bei 3896 keV und 2141 keV nachgewiesen werden. F¨ ur das (19/2)
+Isomer, das eine ¨ahnliche Zerfallsstruktur wie das entsprechende Isomer in
127Cd aufweist, wurde eine Halbwertszeit von 13.6(2) µs gemessen. Die h¨oheren- ergetischen Isomere haben eine Halbwertszeit von 3.1(1) µs und 2.5(15) ns.
Das Zerfallsschema f¨ ur die beiden Kerne konnte anhand von γγ-Koinzidenzen
und der Zeitspektren der Gamma¨ uberg¨ange erstellt werden. Die experi-
mentellen Daten wurden mit Schalenmodellrechnungen verglichen und kon-
nten so neue Informationen ¨ uber die Proton-Neutron Wechselwirkung in der
Region um den doppelt magischen Kern
132Sn liefern. Die Ursache f¨ ur das
Fehlen verz¨ogerter γ -Emissionen f¨ ur
129Cd sind entweder eine isomere Halbw-
ertszeit von weniger als 93 ns, begr¨ undet durch die experimentell bestimmten
Isomerenverh¨altnisse des (19/2)
+Zustands in
127,125Cd oder die Ausbildung
einer E3 Drehimpulsfalle, wie es Schalenmodellrechnungen nahelegen.
Contents i
List of figures 1
List of tables 7
1 Introduction 9
2 The Nuclear Shell Model 15
2.1 Empirical Approach . . . 17
2.2 Schematic Interactions . . . 17
2.3 Realistic Interactions . . . 17
2.4 Transition rates . . . 19
3 Experimental Techniques 21 3.1 Acceleration facility at GSI . . . 21
3.2 Production of exotic-nuclear beams . . . 22
3.2.1 Production mechanism . . . 22
3.2.2 Production yields . . . 23
3.3 FRagment Separator (FRS) . . . 23
3.4 Selection of the reaction residues by the Bρ-∆E-Bρ technique . 24 3.5 Identification of the ions: Principle and the equipment . . . . 27
3.5.1 A/Z determination . . . 29
3.5.2 Z identification . . . 33
3.6 Calibration of the FRS detectors . . . 36
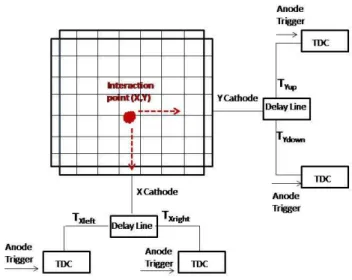
3.6.1 Multi-wire proportional chamber calibration . . . 36
3.6.2 MUSIC calibration . . . 36
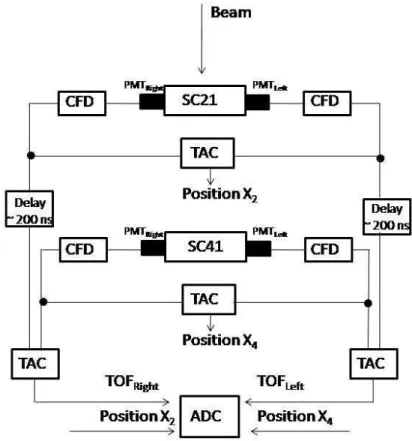
3.6.3 Scintillator calibration . . . 37
3.7 Implantation of the ions . . . 40
3.8 The RISING cluster array . . . 42
3.8.1 Technical details . . . 43
4.3.1 Energy calibration . . . 51
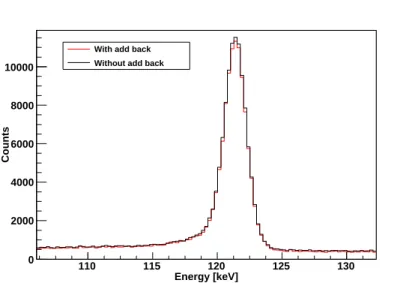
4.3.2 Add-back principle . . . 52
4.3.3 Lifetime analysis . . . 54
4.3.4 Building level schemes . . . 56
5 Results 63 5.1
127Cd . . . 63
5.2
125Cd . . . 72
5.3 Isomeric ratios . . . 92
5.4
129Cd . . . 93
6 Discussion 97 6.1 Shell-model interaction . . . 97
6.2 Structure of the odd Cd isotopes . . . 98
6.3 The role of proton-neutron interaction in
132Sn region. . . . 103
7 Outlook 109 7.1 Slowed Down Beams at GSI : A test measurement . . . 110
7.1.1 Experimental Problems . . . 111
7.1.2 Experimental setup . . . 116
7.1.3 Results . . . 118
Bibliography 123
1.1 Sequence of the single-particle energy orbitals in shell model. . 10 1.2 Excitation energy of yrast 2
+states in Cd, Te, Xe, Ba and Ce
isotopic chains. . . . 12 2.1 Schematic representation of the free nucleon-nucleon potential. 18 3.1 A schematic diagram of the FRS. . . . 24 3.2 Effect of the angle of degrader wedges on the momenta of
fragments for an achromatic setting. . . . 26 3.3 Effect of the angle of degrader wedges on the momenta of
fragments for a monochromatic degrader. . . . 27 3.4 An example of phase-space of a fragment beam achieved using
achromatic and monochromatic focusing. . . . 28 3.5 Fragment separator with its particle identification detectors. . 29 3.6 Readout of the cathodes of multi-wire proportional chambers. 31 3.7 Readout of the scintillator detectors. . . . 32 3.8 Readout electronics for anode strips of multi-sampling ioniza-
tion chambers. . . . 34 3.9 (a): Energy loss in MUSIC41 as a function of multi-wire MW41
position in X direction. The curve has some distortions at the ends which are needed to be corrected for good Z resolution.
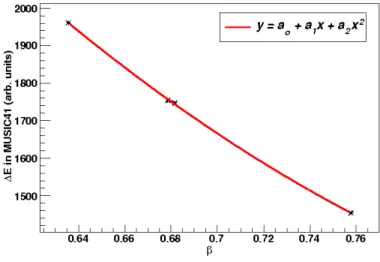
(b): The corrected curve for energy loss to remove the position dependence. . . . 35 3.10 Energy loss in MUSIC41 as a function of primary beam velocity. 35 3.11 Z deduced from the energy loss information in MUSIC41. . . . 37 3.12 The time difference dt from two ends of SC21 versus the posi-
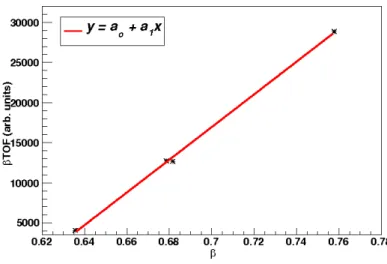
tion in multi-wire MW21. . . . 38 3.13 The product of primary beam velocity β and measured time-
of-flight as a function of β. . . . 39
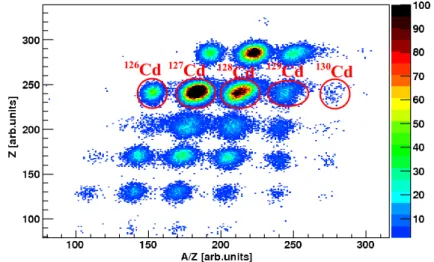
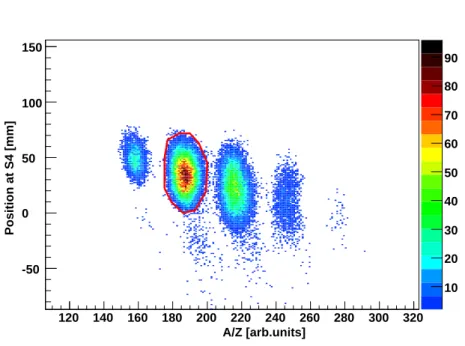
3.14 The Z versus A/Z identification plot for the fragments. . . . . 40
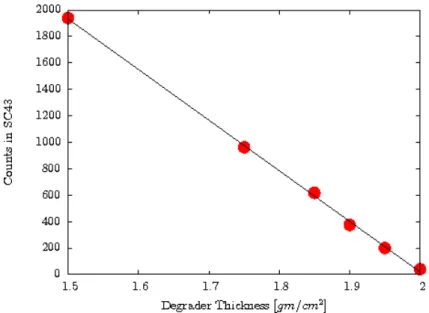
thickness. . . . 41 3.16 A schematic layout of seven HPGe crystals from a RISING
cluster detector. . . . 42 3.17 Energy versus time matrix for the γ rays associated with the
decay of
127Cd. . . . 44 3.18 Width of the prompt flash in time. . . . 45 3.19 The energy versus time matrix of γ rays for an energy range
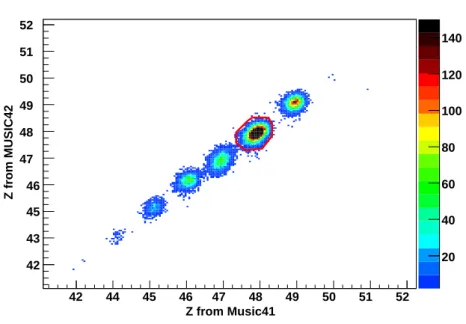
of 50 keV to 4 MeV and a time window of 25 µs after the ion implantation. . . . 46 4.1 The Z information extracted from the two ionization chambers. 48 4.2 Position of Cd isotopes at S2 as a function of their A/Z ratio. 49 4.3 Horizontal position of the Cd isotopes at S4. . . . 50 4.4 The energy loss of the fragments in SC42 versus the energy
loss in MUSIC42. . . . 50 4.5 Left: The calibrated gamma spectrum of
126In for lower ener-
gies with 1 keV/ch and 0.25 keV/ch calibration factors. Right:
152
Eu energy spectrum. The 0.25 keV/ch improves the reso- lution of doublets present at energies 1085.8 keV and 1089.7 keV considerably. . . . 51 4.6 Multiplicity distribution of 7 crystals in a RISING cluster. . . 52 4.7 Difference in time as a function of difference in energies of
gamma radiations recorded in two neighbouring crystals. . . . 54 4.8 (a): The comparison between the intensity of a 121.8 keV
γ transition before and after add back. (b): The spectrum showing the increase in the intensity of 963.8 keV transition after add back. . . . 55 4.9 Energy spectra for
125Cd with time windows of 380 ns to 3 µs
and 7 µs to 11 µs after implantation. . . . 58 4.10 Prompt and delayed coincidence γ spectra of 869.3 keV tran-
sition in
125Cd. . . . 59 4.11 A typical γγ∆t matrix gated on 198.0 keV transition in
125Cd. 60 4.12 (a): The symmetric Gaussian distribution of relative time be-
tween two prompt-coincident γ transitions. The red line is the zero time. (b): Relative time distribution of two delayed γ rays with a shift in the centroid with respect to zero time. . 62 5.1 Singles gamma-ray energy spectrum of
127Cd. . . . 64 5.2 γγ -coincidence spectra of five gamma transitions assigned to
the decay of
127Cd. . . . 65
848.9 keV transitions with a single exponential decay fit. . . . 67 5.4 The two relative time spectra showing symmetric distribution
with respect to the zero time. . . . 69 5.5 The proposed level schemes for
127Cd. . . . 70 5.6 Singles gamma-ray energy spectrum of
125Cd. . . . 73 5.7 The singles gamma-ray energy spectra for
125Cd with two dif-
ferent time windows after the ion implantation. . . . 74 5.8 Prompt γγ-coincidence relations of 665.9 keV and 796.6 keV
transitions. . . . 76 5.9 Prompt γγ-coincidence spectra gated on 719.5 keV and 742.9
keV transitions. . . . 78 5.10 Prompt γγ -coincidence spectra gated on 487.2 keV, 924.9 keV
and 975.3 keV. . . . 79 5.11 Delayed γγ-coincidence spectra gated on 719.5 keV and 742.9
keV. . . . 80 5.12 Prompt γγ -coincidence spectra gated on 99.2 keV, 786.4 keV
and 869.3 keV transitions. . . . 81 5.13 Prompt γγ-coincidence spectra gated on 198.0 keV, 480.6 keV,
269.8 keV and 408.7 keV transitions. . . . 83 5.14 (a) and (b): Time distribution of 198.0 keV transition relative
to the 786.4 keV γ line and the 869.3 keV γ line, respectively.
(c) and (d): Time distribution of 269.8 keV transition relative to the 786.4 keV γ line and the 869.3 keV transition, respec- tively. The red line represents the zero time. Centroids of all the distributions are shifted forward in time indicating the emission of 786.4 keV and 869.3 keV γ lines before the 198.0 keV and 269.8 keV transitions. . . . 84 5.15 (a): The reference zero time line (in red) and the shifts in
centroids of relative time distributions of 198.0 keV and 269.8 keV transitions with respect to the 408.7 keV and 480.6 keV transitions, respectively, in time units. (b) is similar to (a) with an addition of centroid shifts of relative time distribution between the 198.0 keV, 269.8 keV, 408.7 keV and 480.6 keV transitions and 786.4 keV and 869.3 keV transitions. . . . 85 5.16 The time distribution of 198.0 keV transition (a), 269.8 keV
transition (b) , 408.7 keV transition (c) and 480.6 keV tran-
sition (d) relative to 786.4 keV γ line added to the analog
distributions relative to 869.3 keV γ line. . . . 86
keV γ line. (b): Time distribution of 269.8 keV transition relative to 408.7 keV γ line. . . . 87 5.18 (a): Sum of time distributions of the 269.8, 408.7, 480.6, 786.4
and 869.3 keV transitions with a single exponential decay fit.
(b): Sum of time distributions of the 719.5 keV and the 742.9 keV transitions originating from the isomeric state at 1462 keV with a two-component exponential decay fit. . . . 88 5.19 The proposed decay schemes for
125Cd with tentative spin and
parity assignments of the excited states. . . . 91 5.20 Singles γ-ray energy spectrum of
129Cd for an energy up to
1000 keV (a) and the full energy range of 4000 keV (b). Both of the spectra do not contain any characteristic γ lines from the decay of this nucleus. Background lines are marked with an asterisk (*). . . . 95 6.1 Theoretically calculated level scheme for
129Cd. . . . 99 6.2 The proposed level schemes for
127Cd and the theoretically
calculated spectra using SM and LSSM interactions. . . . 100 6.3 The proposed level scheme for
125Cd and the SM calculated
energies of the excited levels. . . . 102 6.4 Single particle (hole) energy levels in
132Sn and
208Pb. . . . 105 6.5 Systematics of the energy of 15/2
−, 13/2
−levels in
125,127,129Cd
and their analogue, 2
+2and 2
+1states in the neighboring even
128
Cd. . . . 108 7.1 B(E2) values of the first excited 2
+states in the even-even Cd
isotopes. . . . 110 7.2 Simulated angular spread of a
64Ni beam after slowing down
in an Al degrader. . . . 112 7.3 The simulated yield of contaminants from nuclear reactions. . 113 7.4 Simulated energy straggling of a
64Ni beam after slowing down
to 13 MeV/u. . . . 114 7.5 The time-of-flight spectrum between scintillators SC21 and
SC41 at FRS. . . . 115 7.6 A cross sectional view of microchannel plate (MCP) surface. . 115 7.7 Two microchannel plate detectors with chevron configuration
of the channels. . . . 116
7.8 Left: A schematic layout of the secondary electron emission microchannel plate detector with electrostatic mirror taken from Ref. [86]. Right: A picture of the secondary electron detector based on microchannel plates used for beam tracking and TOF measurement in the present experiment. . . . 117 7.9 Left: Time-of-flight spectrum between the two MCP detectors
separated by a distance of 10 cm. A triple alpha source was used for the measurement. Right: An image of mask placed in front of the Mylar foil of one of the MCP detectors. A position resolution of 1.5 mm was obtained for both horizontal and vertical directions of the MCP. . . . 118 7.10 A schematic setup for the slowed down beam experiment. . . . 119 7.11 Left: ∆E in Si detector versus the energy distribution of the
slowed down
64Ni beam. The results were compared to simu- lations (right). The plot shows that the
64Ni ions are mostly stopped in Si detector whereas contaminants produced in the nuclear reactions in degrader punch through it. This gives an estimate of the range of energy of the background contaminants.119 7.12 Left: The X coordinate from MCP1 versus the X coordinate
from MCP2. Only the events lying in the straight cut are correlated. Right: The Y versus X image of MCP1. The events lying inside the gate shown in red were further analysed.120 7.13 Energy distribution of
64Ni ions after slowing down. . . . 121 7.14 Simulated counts in the photopeak of gamma transitions from
2
+→ 0
+and 4
+→ 2
+populated in the Coulomb excitation
of
64Ni on a
197Au target of 0.76 mg/cm
2thickness. . . . 122
3.1 The characteristic resolving power and momentum and angu- lar acceptance of the FRagment Separator. . . . 24 5.1 Summary of the measured relative gamma intensities and the
half-lives of isomeric states in
127Cd. . . . 66 5.2 Experimental transition strengths and branching ratios of γ
transitions in
127Cd. . . . 71 5.3 Summary of the relative gamma intensities and half-lives of
isomeric states in
125Cd, obtained by fitting the time distribu- tions of individual gamma transitions. . . . 75 5.4 The shift in the centroid of relative time distributions from
the reference zero time. . . . 88 5.5 Experimental reduced transition strengths for γ rays decaying
from the state at 1462 keV in
125Cd. . . . 89 5.6 Experimentally measured isomeric ratio of the states in
125Cd
and
127Cd. . . . 93 6.1 Experimental and shell-model transition strengths and branch-
ing ratios of gamma transitions in
127Cd. . . . 100 6.2 Experimental and shell-model calculated transition strengths
and γ-branching ratios in
125Cd. . . . 101 6.3 E2 transition rates between the high-spin states in
125Cd cal-
culated by shell model. . . . 103 6.4 The wave function partitions of 15/2
−, 13/2
−states in
125,127,129Cd
and their analogue, 2
+2and 2
+1states in
128Cd. . . . 107
Introduction
A nucleus is a dense volume of neutrons and protons interacting via the strong binding nucleon-nucleon force. The structure exhibited by a nucleus is the consequence of this underlying nuclear interaction. Inspite of the compli- cated many-body composition, nuclei posses structures marked by the orderly motion of their constituents. The many faceted aspects of nuclear structure all over the nuclear chart has been dealt with by theories to understand and build a consistent picture of the nucleon-nucleon interaction in the nuclear medium. The basic characteristics of this strong interaction has long been recognized, for example, the constant binding energy per nucleon for the heavy nuclei (BE(
AZX
N) ∝ A) and the nuclear radius varying as R = r
0A
1/3, suggests that the nuclear medium is incompressible and the nuclear force sat- urates. These empirical observations stem up to the idea, that the interaction governing the motion of the nucleons in a nucleus can be approximated by an average mean potential [1] with the nucleons moving independently in it.
The combination of above hypothesis and experimentally observed extra binding energy for the nuclei having specific number of neutrons and protons led to the development of shell model for the nucleons, analogous to that of the electrons in an atom. The nuclear shell model proposed by Mayer and Jensen [2, 3] provides a quantum mechanical description of the nuclear structure in terms of energy levels as shown in Fig. 1. The energy eigenstates are referred to as orbitals and are characterized by a set of quantum numbers such as total angular momentum, j, orbital quantum number, l and number of nodes of radial wavefunction, n. The first choice of Mayer and Jensen [2, 3]
for nuclear potential as the harmonic oscillator combined with the spin-orbit coupling term α( − →
l . − → s ) and the centrifugal force term β( − → l . − →
l ) resulted in
groups of different j orbitals called shells with typical energy gaps of the order
of few MeV between them. One of the major successes of this model was the
explanation of the so-called magic numbers. The large energy gaps at specific
Figure 1.1: Single-particle energy states with harmonic oscillator potential as the one-body central potential. The degeneracy of the levels is resolved by adding a spin-orbit coupling term. On the right hand side, well known magic numbers are marked. Figure is taken from Ref. [4].
numbers of neutrons or protons make the nuclei favor the configurations with
completely filled shells. The binding energies and ground state nuclear spins
could also be predicted for most of the nuclei. The spins of the individual
nucleons couple to give the total nuclear spin J . A nucleus with closed shells
or filled orbitals has angular momentum zero since all possible substates of
the J are filled, whereas the neighboring odd-A nucleus with one valence
nucleon (particle outside or missing from the filled shell) would have a spin
J corresponding to the orbital in which the last odd nucleon stays. This is a
direct consequence of the independent particle motion and is supported by vast amount of experimental data on the odd-A stable nuclei.
However, the structure of almost all the nuclei in their excited states show that the single-particle independent motion is not definitely the complete pic- ture and the nucleons interact with each other. This interaction between the nucleons can be treated as a higher order perturbation to their independent motion and is known as the residual interaction. One of the ways of under- standing the effect of the residual interaction on the structure of nuclei is a systematic study of the energies of their first excited states as a function of neutron and proton number.
Starting with doubly-magic nuclei, with both neutron and proton shells completely filled, the first excited states are often at an energy less than the corresponding shell gaps. This is a consequence of residual interaction lea- ding to configuration mixing. The interaction between two particles (holes) scatters them to a different pair of orbitals compared to the initial ones.
Such scatterings give rise to configurations of the resulting states with dif- ferent occupancy patterns of nucleons over the valence orbitals. The mixing of all possible configurations with same total angular momentum J leads to rearrangement of their energies with further lowering of the corresponding lowest energy state. Departing away from the magic numbers and by adding both protons and neutrons (particles or holes) to the filled shells results in a large number of configurations coupled to a given J due to an overall in- crease in the pairs of interacting nucleons. As a consequence, an increased mixing and lowering of the first excited states is observed. The enhanced proton-neutron correlations in these cases give rise to a characteristic col- lective motion and the existence of low-lying yrast states in a nucleus is an experimental signature of collectivity.
As an example, the energies of the yrast 2
+states in Xe, Ba, Ce, Te and Cd isotopes as a function of neutron number, N , are plotted in Fig.
1. For Te isotopes with two protons outside the Z = 50 magic shell, the
2
+excitation energy decreases smoothly as more and more neutrons are
removed. The increasing number of neutron holes provide the enhanced
configuration mixing and thus the gradual lowering of E(2
+). Similar trend
is observed for
54Xe,
56Ba and
58Ce chains, the energy of 2
+state is maximum
at the N = 82 neutron shell closure, while moving inside the neutron shell
there is an expected monotonic decrease in E(2
+). In the middle of the
shells, often collective nuclear structures are encountered. However, in heavy
neutron-rich
48Cd isotopes, the 2
+excitation energy deviates from expected
systematics. It first increases from N = 70 to N = 76 and a flattening of
the E(2
+) curve occurs at N = 78 and N = 80. The 2
+energy in
126Cd is 6
keV larger than in the neighbouring
128Cd [5, 6]. This anomalous behaviour
of the neutron-rich Cd isotopes motivated the present work which deals with the investigation of the structure of excited states in
125,127,129Cd nuclei via gamma-ray spectroscopy.
With present day high-intensity radioactive beams [7, 8, 9, 10, 11, 12]
and powerful radiation detection [13, 14] equipments, the exotic regions with extreme N/Z ratio such as neutron-rich Cd isotopes can also be explored.
Testing theories built on the grounds of properties shown by stable nuclei in the region of extremes of nuclear existence would facilitate in building a self-consistent picture of the nucleon-nucleon interaction.
Figure 1.2: The systematics of the energy of first excited 2
+states in Cd, Te, Xe, Ba and Ce as a function of neutron number N .
The neutron-rich Cd isotopes with Z = 48 and valence neutron holes lie in the vicinity of doubly-magic
132Sn and thus are key points in probing the residual proton-neutron (πν) interaction in a neutron-rich environment.
The astrophysical rapid-neutron capture process, responsible for synthesis of
heavy neutron-rich nuclei above Fe in nature follows a path along the N = 82
line. To test theoretical models describing this process in the region around
A = 130, the availability of experimental data on evolution of the N = 82
shell gap is crucial. The predicted reduction of this gap [15, 16] led to the
recent investigations on the structure of
130Cd [17] and
131In [18]. The en-
ergy of first excited 2
+state in
130Cd indirectly points toward a robust shell
closure at N = 82, which was confirmed by a direct measure of the shell gap
[18]. Missing evidence for a shell quenching in all these cases calls for a need to modify the mass model [19] explaining the abundances of A = 130 nuclei in nature. Furthermore, unexpected lowering of the yrast 2
+states in
126Cd and
128Cd [5, 6] was inferred as a consequence of an enhanced collectivity.
The theoretical studies based on beyond mean field calculations with Gogny force explored the phenomenon and attributed it to the quadrupole deforma- tion of states [20]. To gain more insight on this issue, a detailed comparison of experimental data on the excited states of odd Cd isotopes with theoret- ically predicted results was performed and an enhanced πν interaction was concluded to be the reason of prevailing collectivity in the region.
This thesis is divided into 7 chapters. In chapter 2, we lay out the theoret-
ical framework of the thesis. In chapters 3 and 4, we present the experimen-
tal techniques and data analysis methods used in obtaining the experimental
results. Chapter 5 summarizes the results obtained for three Cd isotopes
studied and in chapter 6, we discuss the theoretical interpretation of the ob-
tained results using shell-model calculations. Chapter 7 provides an outlook
on the future research aspects along the lines of this work.
The Nuclear Shell Model
The theoretical interpretation of the experimental results presented in this work will be compared with shell-model calculations. In this chapter, the basis of shell-model theory along with some of the concepts specific to the used calculations are discussed briefly. Detailed mathematical derivations are beyond the scope of this thesis, therefore the readers are encouraged to consult relevant references provided in the chapter.
The basic assumption of the shell model is the independent motion of each nucleon in a potential created by average interaction with the other nucleons in the nucleus. The Hamiltonian, H
0, for such a system of nucleons can be expressed as
H
0=
A
X
i=1
[T
i+ U
i], (2.1)
with A denoting the total number of nucleons in the nucleus, T
ithe kinetic energy of the i
thparticle and U
ithe one-body average potential.
However, in a many-nucleon system, because of the two-particle interac- tion, W (i, j), the Hamiltonian generalizes to
H =
A
X
i=1
T
i+
A
X
1=i<j
W (i, j), (2.2)
Using eq. (2.1), the above expression can be rewritten as H =
A
X
i=1
[T
i+ U
i] +
A
X
1=i<j
W (i, j ) −
A
X
i=1
U
i= H
0+ H
res, (2.3)
where H
resis the residual Hamiltonian defining the mutual interaction be-
tween the nucleons. It is treated as a small perturbation to the single-particle
Hamiltonian, H
0.
The perturbation theory provides a framework to compute the energy of the p
thstate as a sum of single-particle energies, E
k0and the contribution due to the residual interactions. The total energy of this state with its wave function, ψ
pexpanded as linear combinations of the unperturbed basis states φ
0k, becomes
E
pa
lp=
n
X
k=1
< φ
0l|H
0+ H
res|φ
0k> a
kp, (2.4) with
ψ
p=
n
X
k=1
a
kp|φ
0k> . (2.5) Since the unperturbed basis functions φ
0kare the eigenfunctions of H
0and E
k0are the corresponding energy eigenvalues, one can write eq. (2.4) in the form of a matrix equation
n
X
k=1
H
lka
kp= E
pa
lp, (2.6) with an element of the Hamiltonian matrix also known as the two-body matrix element (TBME) being
H
lk= E
k0δ
lk+ < φ
0l|H
res|φ
0k> . (2.7) To obtain the energy E
p, the matrix defined in (2.7) must be constructed and diagonalized. The resulting eigenvectors are the total wave functions, ψ
p. This phenomenon of defining certain states as a linear combination of unperturbed energy eigenfunctions is called configuration mixing, and the process conserves the total isospin and angular momenta of the states. In other words, configurational mixing takes place only between the states cou- pled to same angular momentum J and isospin T . Ref. [21] provides a detailed qualitative insight on the configurational mixing phenomenon, for mathematical formalism one can refer to [22, 23].
The large dimensionality of the matrix for a nucleus with ∼ 100 nucle-
ons makes it impossible to diagonalize it for the whole basis space. Due to
computational limitations, the large basis space is truncated. The extracted
nucleon-nucleon interaction is therefore a modified effective two-body inter-
action which spans only a subset of the total basis space referred as the model
space. The main aim of the shell-model calculations is to obtain the energy
eigenvalues and the eigenfunctions for the mixed states by diagonalizing the
effective Hamiltonian matrix, restricted to the model space. Once the wave
functions are obtained, several observables can be computed to explain the experimental data. In the following sections three main approaches to obtain the matrix elements for the effective two-body interaction are listed.
2.1 Empirical Approach
The two-body matrix elements and the single-particle energies for a par- ticular mass region are obtained as the parameters of a fit to experimental data. This iterative procedure starts with an initial guess of the parameters which are used to diagonalize the Hamiltonian matrix. The calculated en- ergies of the states are compared to the experimental energy spectrum and the parameters are adjusted by performing a least-square fit to describe the experimental data. The iteration is repeated until a good convergence is obtained. The effective interaction extracted using this approach is usually dependent on the set of experimental data taken and works well for a partic- ular mass region. This approach has been very successful in estimating the binding energies and the energies of the excited states, however, the wave function description is still limited. For a more detailed discussion refer to [24].
2.2 Schematic Interactions
Some of the basic nuclear properties can be explained using simple schematic nucleon-nucleon interactions. For example, the characteristics like short- range nature of the nuclear force and saturation of the nuclear binding en- ergies is very well simulated by delta interaction. The definition of the δ function itself explains that an interaction scaling like a δ function vanishes unless the active nucleons do not occupy the same spatial positions. Another widely discussed interaction explaining the tendency of the like nucleons to align their angular momenta as J
π= 0
+, is the pairing interaction. These schematic forms of the nucleon-nucleon interaction allows one to perform analytical calculation of the effective two-body matrix elements (TBME).
2.3 Realistic Interactions
In this approach, the effective interaction is constructed starting from the
parametrized bare nucleon-nucleon force in free space. The inputs to the pa-
rameters of the free nucleon-nucleon force come from phase shifts observed in
between the incoming and outgoing waves describing the scattered nucleons
in the pp and np scattering experiments. The resulting two-body nuclear in- teraction consists of a short-range repulsive part and a long-range attractive part. The repulsive part, often referred as a hard core increases with decreas- ing distance between the nucleons. In Fig. 2.3, a schematic representation of the nucleon-nucleon force as a function of internucleon distance in the spin singlet configuration (S = 0, T = 1) is shown.
Figure 2.1: Schematic representation of the nucleon-nucleon potential. At an approximate internucleon distance of 0.5 fm, the force starts to be repulsive and the region is referred as hard core.
Extraction of the effective interactions from realistic nucleon-nucleon forces V
N−Ninvolves a many-body perturbation technique in which the effects of excluded Hilbert space are taken into account. A detailed mathematical for- malism of this can be found in [25]. The property of V
N−Ngoing to infinity at small internucleon distances poses a mathematical problem in calculating the TBME. The matrix elements become very large or even infinite in this region.
This problem is solved by using one of the very successful approaches based on Brueckner’s G-matrix theory [26]. The resulting effective interactions are well behaved in repulsive hard core region.
Kuo and Brown derived first such interaction for the A = 18 nuclei (sd
shell) [27] starting from the Hamada-Jonston [28] description of the bare
nucleon-nucleon force. Later this technique was extended to the f p model
space and one of the widely used effective interaction in this region is that
of Hjorth-Jensen and collaborators [29].
2.4 Transition rates
A nuclear energy state having an average lifetime of τ , makes a transition to a lower state by emitting a quanta of energy with a rate
λ = 1
τ . (2.8)
This transition rate λ can be computed using Fermi’s Golden rule λ = 2π
ℏ | < ψ
jf,mf|V
int|ψ
ji,mi> |
2ρ(f), (2.9) which states that the transition rate is proportional to the square of the expectation value of interaction V
intresponsible for transition between the initial state ψ
ji,miand final state ψ
jf,mfand the density of final energy states ρ(f).
Introducing a notation, T
f i(ωL) to specify the electric and magnetic type of transitions, the above expression can be formulated as
T
f i(ωL) = 8π(L + 1) L(2L + 1)!!
21 ℏ ( E
γℏ )
2L+1| < ψ
jf,mf|o(ωL, M )|ψ
ji,mi> |
2, (2.10) where E
γis the energy of the quanta and o(ωL, M ) is the corresponding multipole operator.
The matrix elements of o(ωL, M ) are made independent of the projection quantum number M by applying the Wigner-Eckart theorem. The resulting matrix elements are the reduced matrix elements, < ψ
jf||o(ωL)||ψ
ji> and the reduced transition probability B (ωL, j
i→ j
f) is defined as
B(ωL, j
i→ j
f) = 1
2j
i+ 1 < ψ
jf||o(ωL)||ψ
ji>
2. (2.11) The transition rate in terms of the reduced transition probability then be- comes
T
f i(ωL) = 8π(L + 1) L(2L + 1)!!
21 ℏ ( E
γℏ )
2L+1B(ωL, j
i→ j
f). (2.12)
In a model dependent calculation, the projections of the total wave function
onto the model space M are used. Therefore, the probabilities of transitions
which are dependent on the wave functions of initial and final states do
not give correct physical estimates of true transition rates, when calculated
only for a subset of full basis space. To account for the missing transition
probabilities, a concept of effective charge of protons (e
π) and neutrons (e
ν)
and effective orbital g-factor (g
l) and effective spin g-factor (g
s) is introduced.
These quantities differ for different multipoles of the transitions, however in a given model space constant values for effective charge and effective g-factors should give good approximation of the rates of similar transitions.
The physical meaning of effective charge for an E2 transition can be
understood by assuming the inert core of nucleus as a uniformly charged
sphere, polarized due to interaction with surrounding valence nucleons. This
polarization of core modifies the magnitude of valence charge which can be
expressed as a constant δ(e
π,ν) added to the free values of the neutron and
proton charges.
Experimental Techniques
The experiment in which
129Cd,
127Cd and
125Cd were produced was per- formed at the accelerator facility of GSI [30], Darmstadt. Fragmentation of a primary beam of
136Xe at energy 750 MeV/u on a
9Be target of 4 g/cm
2thick- ness yielded the neutron-rich Cd isotopes along with other reaction products.
Separation and identification of the heavy-ions was done at the FRagment Separator (FRS) [31]. Two settings of the FRS were realized, one optimized for maximum transmission of
130Cd and other one tuned to predominantly transmit
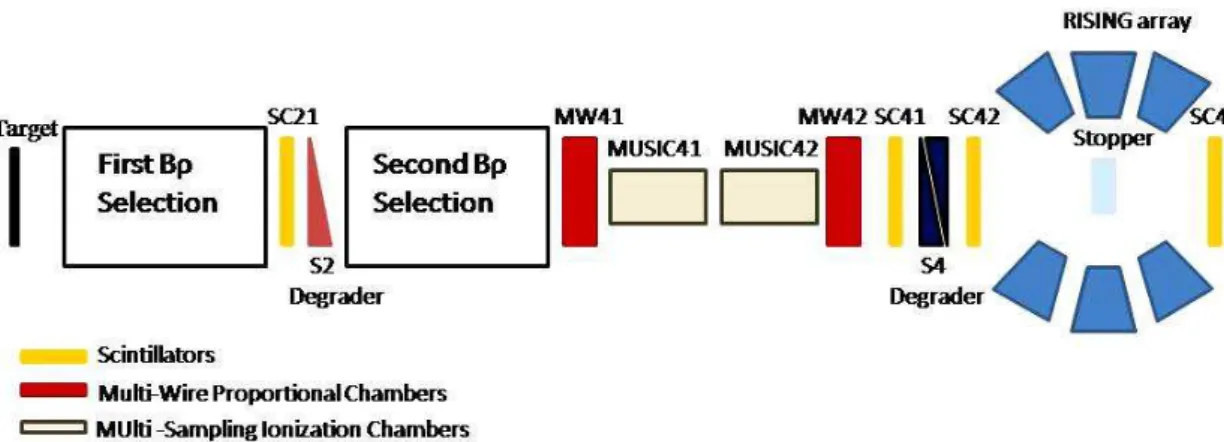
126Cd. To select ions of interest from the reaction products, the standard Bρ-∆E-Bρ method was employed and the FRS was operated in its achromatic mode. The present chapter is devoted to provide a detailed overview of the acceleration facility at GSI, the production of exotic nuclei and their separation and identification using particle detectors which are important building blocks of the FRS.
3.1 Acceleration facility at GSI
The existing accelerator facility at GSI comprises of the UNIversal Linear
ACcelerator system, UNILAC [32] coupled to heavy-ion synchrotron SIS18
[33]. Elements from hydrogen to uranium are accelerated in this accelerator
complex. The UNILAC delivers beams with energies in the range from 3.0
to 13 MeV/u for heavy ions, and up to 15 MeV/u for light ions. It has a pre-
acceleration stage where the ion sources are stationed. The primary beam
nuclei produced in the first stage are stripped before being injected into the
main linear accelerator, where the maximum possible energy is reached post-
acceleration. The beam delivered by UNILAC has a pulsed structure with a
typical spill length of few milliseconds. The different beams are then injected
to SIS18 where they are accelerated up to 90% of the speed of light. The
entrance of the synchrotron is marked by a carbon foil used as a stripper.
The most abundant charge state of 73
+for uranium can be obtained in one injection. The maximum energy which can be reached for protons at SIS18 is 4.7 GeV, while for uranium, it extends up to 1 GeV/u. The beams can be either extracted in a slow or fast mode and are forwarded to the different experimental areas. Depending on the needs of experiments, the length of a beam spill can be adjusted to several microseconds in fast extraction and to several seconds in slow extraction. At FRS the slow extraction mode is utilized.
3.2 Production of exotic-nuclear beams
The in-flight separation methods used at the accelerator complex at GSI utilize fragmentation or fission of high-energy projectiles to produce sec- ondary beams of exotic nuclei.
3.2.1 Production mechanism
The high-energy primary beams with intensities around 10
9pps impinge on target materials with low Z, ejecting a variety of forward focused reaction residues. The heavy projectile-induced reactions at relativistic energies can be well explained by two-step abrasion-ablasion model [34]. According to this theory two ions passing each other with an impact parameter small enough to lead an overlap in their volume, undergo a shearing away of the overlapping parts. This scrapping-off of the nucleons from the projectile nuclei is referred as
abrasion
. The number of nucleons abraded in first step solely depends on the impact parameter [34]. The intermediate products (pre-fragments) are in thermalized excited states and de-excite by the evaporation of cas- cades of nucleons or light clusters. This evaporation phenomenon is called as
ablation
process. The loss of nucleons or light clusters continues until a proton-neutron ratio is reached where the probability to emit a proton or a neutron is similar [35, 36]. This results in the production of nuclei on the proton-rich side of the line of beta stability. During
ablation
, fission may also take place for the fissile nuclei, leading to the medium-mass neutron-rich products.
The energy and momentum spread of the reaction residues predominantly
depend on the mechanism driving their production. In peripheral fragmen-
tation reaction the pre-fragments have nearly the same velocities as the pro-
jectile [37], with small differences arising from the fact that the sheared-off
nucleons have to overcome the binding energies of the nuclei [38]. The re-
sulting momentum spread in a simple form is given by the model proposed by Goldhaber et al. [39].
3.2.2 Production yields
Yields of the secondary nuclei of interest N can be calculated using the relation
N = nσI, (3.1)
where n is the number of target nuclei, I is the beam intensity and σ is the reaction cross section. The choice of beam and target to produce the exotic nuclei of interest is based on the reaction cross sections. Codes like EPAX [40, 41], using the parametrization of experimental data from high- energy reactions or ABRABLA [34] based on the abrasion-ablation model can be used to estimate the production cross sections.
Production cross section of neutron-rich Cd isotopes using fragmentation of
136Xe beam on a
9Be target calculated from the EPAX 2 code is of the order of 10 µb. The cross sections increase for less neutron-rich nuclei and hence, a large amount of side products were also produced in the experiment.
To separate the fragments of interest from other reaction residues, they were guided to the FRagment Separator, a spectrometer designed to select the heavy-ions with relativistic energies.
3.3 FRagment Separator (FRS)
The FRagment Separator at GSI is a zero degree magnetic spectrome- ter with energy degrader used to separate the reaction residues isotopically.
The system consists of four ion-optical focal planes (S1-S4), each character-
ized by a 30
°dipole magnet and quadrupoles before and after each dipole as
shown in Fig. 3.1. The Bρ-∆E-Bρ technique is exploited to select the nuclei
to be studied. Achromatic and monochromatic modes of operation of the
spectrometer give a freedom to focus the isotopically separated beams with
small position and momentum spread, respectively, at the final focal plane
(S4). Table 3.1 summarizes the general characteristics of the FRS. The fi-
nite momentum and angular acceptance of the FRS in combination with the
losses of fragments along the beam line governs the transmission of nuclei
to the exit of the separator. The total flight path through the spectrometer
is ≈ 72 m which limits the lifetimes of the states populated in the produc-
tion mechanism that can be studied at the final focal plane to few hundred
nanoseconds. In section 3.4 an introduction of selection principle of the FRS
based on the Bρ-∆E-Bρ technique is given. Section 3.5 deals with the proce- dure of identification of the fragments and the particle detectors involved. A detailed overview of the FRS and its working principle can be found in Ref.
[31].
Figure 3.1: A schematic diagram of the FRS showing its four dipoles and the focal planes, S1, S2, S3 and S4.
Table 3.1: The characteristic resolving power and momentum and angular acceptance of the FRagment Separator.
Acceptance Momentum :
∆pp= ±1%
Angle : ∆θ = ±10 mrad Resolving power
∆BρBρ= 1600
Maximum Bρ = 18 Tm
3.4 Selection of the reaction residues by the Bρ- ∆ E-Bρ technique
First Bρ selection: The first two dipoles of the FRagment Separator act as the momentum filter for the ions. The selection principle is based on the Lorentz force − →
F
Lorentzexerted by a homogeneous magnetic field on a moving
charged ion. The motion of the ion in this case is given by the Lorentz
equation
−
→ F
Lorentz= q( − → v × − →
B ), (3.2)
where q and − → v denote the charge and velocity of the ion and − → B is the magnetic field it is moving in. The magnetic field in the dipoles of FRS is perpendicular to the velocity of traversing ions which forces them to follow a circular path. Hence, the centrifugal force due to circular motion of the ions balances the Lorentz force such that
F
Lorentz= mv
2ρ , (3.3)
where m is the mass of the particle and ρ is the radius of the circular path.
Combining the two equations above one finds that the magnetic rigidity, Bρ, is
Bρ = mv
q . (3.4)
For relativistic energies of the charged particles this expression provides a relation between the A/Q ratio of the fragments and their magnetic rigidity as
Bρ = A Q
ucβγ e
, (3.5)
with u being the atomic mass unit, A the atomic number of the ions, Q the ionic charge, c the speed of light and e the electron charge. The velocity β and the relativistic factor γ are given by the relations β = v/c and γ = p 1/(1 − β
2), respectively. At the FRS, bending radius of the dipoles is fixed to ρ = 11.25 m. For fully stripped ions, Q is the measure of their atomic number Z . The B fields of the four dipoles (D1, D2, D3 and D4) (see Fig. 3.1) are maintained in a way that ions with a particular A/Z ratio traverse central trajectory in the dipoles. The A/Z bands transmitted in first Bρ filtering stage depend on momentum and angular spread of the fragmentation residues. The position of arrival of the fragments at S2 after the second dipole is given by the expression
X
S2(p) =
∂x
∂(δp)
T A−S2
∆p
p , (3.6)
where p is the momentum (≈ Bρ) and ∂x/∂(δp) is the horizontal dispersion
of the fragments referred as D
T A−S2at the middle focal plane due to their
initial momentum spread at the entrance of the separator. This momentum
dependent spatial distribution of the ions is utilized by the profiled energy
degrader placed at the middle focal plane (S2) to introduce a change in the momentum of traversing ions in order to achieve either a monochromatic or achromatic characteristics.
Energy loss in the degrader: At S2, the fragments traverse a thick wedge-shaped material with variable thickness. The degrader system consists of a homogeneous wedge, a ladder and a disk [42]. The amount of matter in the beam path is varied by adjusting the wedge and the ladder thickness. The disk is inserted to change the angle of degrader in order to realize achromatic and monochromatic settings. By rotating the disk perpendicular to beam axis, a gradient in the thickness of degrader is acquired. Thus the thickness of material in the path of ions varies according to their horizontal point of arrival at the degrader. The energy loss of the ions with same A/Z ratio at this point can be optimized to focus the ions at the final focal plane (S4).
Figure 3.2: Effect of the angle θ of degrader wedges on the momenta of fragments for an achromatic setting. As a consequence the fragments are focused at S4. See text for details.
For an achromatic mode, the energy loss of the same A/Z ratio arriving at different horizontal positions is such that the momentum dispersion in- troduced by the first two dipoles gets compensated at the final focal plane by the second Bρ filtering (see Fig. 3.2). The resulting horizontal position of fragments at the final focal plane with a fixed A/Z ratio only depends on their position at the middle focal plane and their spread is defined by the momentum spread ∆p at S2.
X
S4(p) = ∂x
∂x
S2−S4
+ ∂x
∂(δp)
S2−S4