Original article:
TUMOR SUPPRESSIVE EFFECTS OF THE PLEIOTROPICALLY ACTING MIR-195 IN COLORECTAL CANCER CELLS
Zahra Forouzan Jahromi
1, Arash Javeri
1*, Masoumeh Fakhr Taha
1*1
Department of Stem Cells and Regenerative Medicine, Institute for Medical Biotechnol- ogy, National Institute of Genetic Engineering and Biotechnology (NIGEB), Tehran, Iran
* Corresponding authors: Dr. Masoumeh Fakhr Taha, E-mail: mailto:mftaha@nigeb.ac.ir, Dr. Arash Javeri, E-mail: mailto:arashj@nigeb.ac.ir. Department of Stem Cells and Regenerative Medicine, Institute for Medical Biotechnology, National Institute of Genetic Engineering and Biotechnology (NIGEB), Pajoohesh Blvd., P.O. Box: 14965-161, Tehran, Iran, Phone: +982144787381. Fax: +982144787399
http://dx.doi.org/10.17179/excli2019-1166
This is an Open Access article distributed under the terms of the Creative Commons Attribution License (http://creativecommons.org/licenses/by/4.0/).
ABSTRACT
Downregulation of miR-195 in colorectal cancer tissues has been reported in several studies. We investigated the impact exogenous induction of mature miR-195-5p on some malignant features of human colorectal cancer cells.
Caco-2 and SW480 human colon cancer cell lines were transfected with a synthetic miR-195-5p mimic. Exoge- nous induction of miR-195-5p suppressed multiple mediators of invasion and angiogenesis in colorectal cancer cells and increased the apoptotic cell population in both cell lines. Also, migration of both cell lines was signifi- cantly compromised after miR-195 transfection. Our results are indicating a strong tumor suppressive role for miR-195 in human colorectal cancer.
Keywords: Colorectal cancer, miR-195, EMT, angiogenesis, apoptosis
INTRODUCTION
MicroRNAs (miRNAs) are endogenous non-coding small RNAs with a length of about 17-25 nucleotides which act as post- translational regulators of gene expression. In mammals, miRNAs are predicted to control translation of approximately 60 % of protein- coding mRNAs (Friedman et al., 2009). Ma- ture miRNAs repress translation or induce degradation of mRNAs by direct binding to the 3'-untranslated (3´UTR) region of their target mRNAs (Huang et al., 2011). Colorec- tal cancer (CRC) is the fourth leading cause of cancer deaths worldwide (Siegel et al., 2014). It is well known that development of
CRC is a complex process resulting from pro- gressive accumulation of both genetic and ep- igenetic alterations (Grady and Markowitz, 2002). Abnormal expression of numerous miRNAs has been strongly linked to occur- rence and progression of CRC (Dassow and Aigner, 2013). For example, several groups have reported the altered expression of miR- 92, miR-21, miR-31, miR-143, miR-145 and miR-143 in CRC (Borralho et al., 2009; Ng et al., 2009; Slaby et al., 2007). Moreover, accu- mulating evidence has shown abnormal ex- pression of miR-195 in CRC (Sun et al., 2017;
Wang et al., 2014; Yang et al., 2015; Zhang et
al., 2016). MiR-195 is a member of miR-
16/15/195/424/497 family which function ei- ther as oncogenic or tumor suppressor miR- NAs in various types of human tumors (Katoh, 2014). In CRC, miR-195 acts as a tu- mor suppressor miRNA and its downregula- tion has been reported in several studies (Sun et al., 2017; Wang et al., 2014; Yang et al., 2015; Zhang et al., 2016). In the present study, two human CRC cell lines, Caco-2 and SW480, were used to study the impact of ex- ogenous induction of miR-195 using a syn- thetic form of mature miR-195-5p on several hallmarks of cancer, including apoptotic rate, migration, invasion and angiogenesis.
MATERIALS AND METHODS Cell culture and miRNA transfection
Human CRC cell lines, Caco-2 and SW480, were purchased from Pasteur Insti- tute of Iran. Both cell lines were cultured in Dulbecco’s Modified Eagle’s Medium (DMEM) supplemented with 2 mM L-gluta- mine, 10 % fetal bovine serum (FBS) and 1 % penicillin and streptomycin (all from Gibco, Thermo Fisher Scientific, USA) at 37 ºC in a humidified incubator with 5 % CO
2. Caco-2 and SW480 cells were seeded in tissue culture plates. At the appropriate density, the cells were transfected with a synthetic miR-195-5p mimic using HiPerFect Transfection Reagent, (all from Qiagen, Hilden, Germany) accord- ing to manufacturer’s instructions. A mock transfection group for each cell lines was also prepared as the control group. Transfection of the cells was repeated after three days and the
cells were collected at the seventh day for downstream applications.
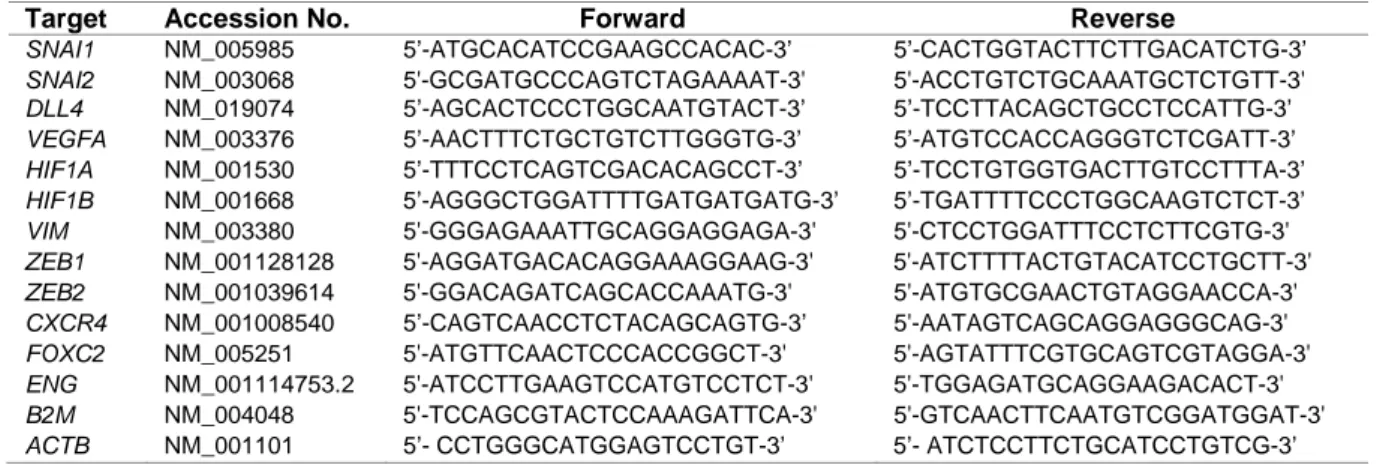
Quantitative real-time PCR (qPCR) analysis
For analysis of gene expression, total RNA was extracted from the two treatment groups using High Pure RNA Isolation Kit (Roche, Mannheim, Germany). Equal amounts of RNA samples were reverse tran- scribed to cDNA using RevertAid First Strand cDNA Synthesis Kit (Thermo Fisher Scien- tific Inc, Waltham, USA), according to the manufacturer’s instructions. Experiments were performed using FastStart SYBR
®Green Master (Roche Applied Science, Mannheim, Germany) and specific primers for the target genes (Table 1) on a Rotor- Gene
TM6000 real time analyzer (Corbett Re- search, Australia). B2M (β-2 microglobulin) and ATCB (β-actin) were used as reference genes. Comparative analysis of the gene ex- pression data was performed by REST 2009 software (Qiagen).
Assessment of apoptosis by Annexin V-FITC/PI staining and flow cytometry
The Annexin V-FITC/propidium iodide (PI) staining was performed using Annexin V-FITC/PI Apoptosis Detection Kit (eBiosci- ence, Thermo Fisher Scientific) according to the manufacturer’s instructions. Briefly, 1–
5×10
5cells were collected by trypsinization and stained with Annexin V-FITC and PI.
Table 1: Primers used for qPCR
Target Accession No. Forward Reverse
SNAI1 NM_005985 5’-ATGCACATCCGAAGCCACAC-3’ 5’-CACTGGTACTTCTTGACATCTG-3’
SNAI2 NM_003068 5'-GCGATGCCCAGTCTAGAAAAT-3' 5'-ACCTGTCTGCAAATGCTCTGTT-3' DLL4 NM_019074 5’-AGCACTCCCTGGCAATGTACT-3’ 5’-TCCTTACAGCTGCCTCCATTG-3’
VEGFA NM_003376 5’-AACTTTCTGCTGTCTTGGGTG-3’ 5’-ATGTCCACCAGGGTCTCGATT-3’
HIF1A NM_001530 5’-TTTCCTCAGTCGACACAGCCT-3’ 5’-TCCTGTGGTGACTTGTCCTTTA-3’
HIF1B NM_001668 5’-AGGGCTGGATTTTGATGATGATG-3’ 5’-TGATTTTCCCTGGCAAGTCTCT-3’
VIM NM_003380 5'-GGGAGAAATTGCAGGAGGAGA-3' 5'-CTCCTGGATTTCCTCTTCGTG-3' ZEB1 NM_001128128 5'-AGGATGACACAGGAAAGGAAG-3' 5'-ATCTTTTACTGTACATCCTGCTT-3' ZEB2 NM_001039614 5'-GGACAGATCAGCACCAAATG-3' 5'-ATGTGCGAACTGTAGGAACCA-3' CXCR4 NM_001008540 5’-CAGTCAACCTCTACAGCAGTG-3’ 5'-AATAGTCAGCAGGAGGGCAG-3' FOXC2 NM_005251 5'-ATGTTCAACTCCCACCGGCT-3' 5'-AGTATTTCGTGCAGTCGTAGGA-3' ENG NM_001114753.2 5'-ATCCTTGAAGTCCATGTCCTCT-3' 5'-TGGAGATGCAGGAAGACACT-3' B2M NM_004048 5'-TCCAGCGTACTCCAAAGATTCA-3' 5'-GTCAACTTCAATGTCGGATGGAT-3' ACTB NM_001101 5’- CCTGGGCATGGAGTCCTGT-3’ 5’- ATCTCCTTCTGCATCCTGTCG-3’
Stained cells were analyzed by a BD FACSCalibur
TM(BD Biosciences, San José CA, USA). Analysis of the apoptosis rate was performed using FlowJo software (Tree Star, Inc., Ashland, OR, USA). In this method An- nexin V is labeled with fluorescein isothiocy- anate (FITC) which identifies apoptotic cells by binding to phosphatidylserine on the inner leaflet of cell membrane. When paired with an impermeant dead cell stain such as PI, it will be possible to distinguish live, early apop- totic, late apoptotic and necrotic cell popula- tions.
Wound healing assay
For wound healing assay, transfected SW480 and Caco-2 cell lines were seeded into 4-well tissue culture plates, and after reaching 80-90 % confluency, the monolay- ers were scratched with a 1000 l pipette tip.
The cells were washed twice with phosphate- buffered saline (PBS) to remove the detached cells and were incubated in a CO
2incubator at 37 ºC for 48 hours under low serum (1 %) condition. Immediately after wound creation and at 48 hours after that, the cells were mon- itored by an inverted microscope equipped with a digital camera and photos were taken at the mentioned time points. Relative migra- tion distance was calculated by ImageJ 1.51j8 image analysis software (Wayne Rasband, NIH, USA).
Statistical analyses
Analysis of gene expression was per- formed by a comparative method using REST 2009 software (Qiagen) based on Pair Wise Fixed Randomisation Test
as described by Pfaffl et al. (2002; Pfaffl, 2001). In this method, the relative expression ratio is calcu- lated from the real-time PCR efficiencies and the crossing point deviation of the two treat- ment and control samples. Significance of the differences of cell migration distance was as- sessed by unpaired two-sample t-test based on the assumption of obtaining two separate sets of independent and identically distributed samples, one from negative control cells and
one from the miR-195-transfected cells. Sta- tistical analysis was performed by GraphPad Prism 5 (GraphPad Software Inc., La Jolla, USA). Four replicates of each treatment group were included in the analyses.
RESULTS
MiR-195 downregulated the expression of EMT markers in SW480 and Caco-2 cells
Seven days after the first transfection, the expression of some EMT (epithelial to mes- enchymal transition) markers including SNAI1, SNAI2, VIM, CXCR4, FOXC2, ZEB1 and ZEB2 was compared between the cells transfected with miR-195 mimic and the mock transfected cells by qPCR analysis. The expression of almost all the mentioned genes were significantly downregulated in miR- 195-transfected Caco-2 and SW480 cells compared to their controls (Figure 1). Only SNAI2 was not affected in Caco-2 cells trans- fected with miR-195 mimic (Figure 1).
MiR-195 downregulated expression of some angiogenic markers
Seven days after the first transfection, the expression of some angiogenic genes includ- ing VEGFA, HIF1A, HIF1B, DLL4 and ENG was compared between the cells transfected with miR-195 mimic and the mock trans- fected cells by qPCR. The expression levels of all the genes were significantly downregu- lated in both cell lines after transfection with miR-195 compared to the control group (Fig- ure 2).
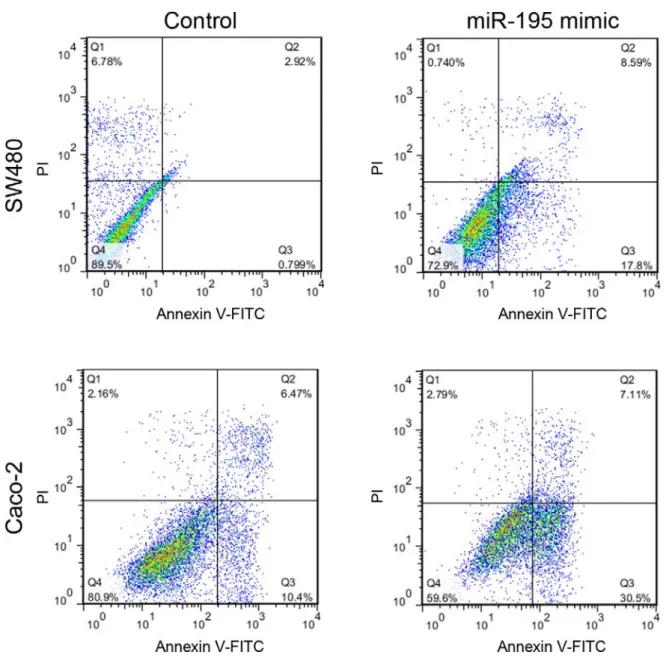
MiR-195 induced apoptosis in SW480 and Caco-2 cell lines
Seven days after the first transfection, the
SW480 and Caco-2 cell lines were collected
and assessed for apoptotic rate by Annexin V-
FITC/PI staining and flow cytometry. Trans-
fection of SW480 and Caco-2 cell lines with
miR-195 mimic upregulated the rate of apop-
totic cells by 17 % and 20 %, respectively
(Figure 3).
Figure 1: Relative quantification of some EMT genes in Caco-2 and SW480 cells transfected with miR-
195 mimic compared to the mock transfected control cells (represented by the red line). Comparative quantification analysis performed by REST 2009 based on Pair Wise Fixed Randomisation Test (n=4,
P values generated by REST 2009).Figure 2: Relative quantification of several angiogenic-related genes in Caco-2 and SW480 cells trans-
fected with miR-195 mimic compared to the mock transfected control cells (represented by the red line).
Comparative quantification analysis performed by REST 2009 based on Pair Wise Fixed Randomisation
Test (n=4, P values generated by REST 2009).
Figure 3: Flow cytometric assessment of the apoptosis rate in SW480 and Caco-2 cells 7 days after
miR-195 or mock transfection using Annexin V-FITC/PI staining and flow cytometry. PI: propidium io- dide, FITC: fluorescein isothiocyanate. Q1: necrotic cell population, Q2: late apoptotic cells, Q3: early apoptotic cells, Q4: live cells.
Migration of SW480 and Caco-2 cells was compromised by miR-195
Seven days after the first transfection, mi- gration rate of the cells was assessed by wound healing assay. Transfection of both SW480 and Caco-2 cell lines with miR195 mimic resulted in a significant decrease in the migration rate of the cells into denuded area (Figure 4). After 48 hours, in SW480 cells the wound was completely closed in the control
group while less than 30 % of the wound gap was closed in miR-195 transfected cells.
DISCUSSION
EMT is a reprogramming process in which epithelial cells lose their junctions and polarity, reorganize their actin cytoskeleton and acquire the morphological, migratory and invasive phenotypes of mesenchymal cells.
These changes are closely linked to cancer
Figure 4: Wound healing assay for assessment of migration rate in Caco-2 and SW480 cells after miR-