Education in Older and Oldest-Old Age
A Comparison Between the United States and Germany
Dissertation
zur Erlangung des Doktorgrades
der Wirtschafts- und Sozialwissenschaftlichen Fakultät der Eberhard Karls Universität Tübingen
vorgelegt von
Dipl. Päd. Sandra Nicole von Doetinchem de Rande aus Mülheim an der Ruhr
Tübingen 2020
1. Betreuer: Prof. Dr. Bernhard Schmidt-Hertha
2. Betreuer: Prof. Dr. Christian Fischer
Dekan: Prof. Dr. Josef Schmid
1. Gutachter: Prof. Dr. Bernhard Schmidt-Hertha
2. Gutachter: Prof. Dr. Christian Fischer
For Tina And My Grandmother Käthe
sincere thank you to all of them.
Foremost, I would like to express my deepest appreciation and gratitude to my doctoral advisor Prof. Bernhard Schmidt-Hertha for his continuous support and guidance. Without his persistent help and willingness to accept me as an external doctoral student, completing this thesis with 12.134 km between Tuebingen, Germany, and Honolulu, U.S, would not have been possible.
I would like to thank my committee members Prof. Christian Fischer and Prof. Anita Pachner.
I want to thank Prof. Dieter Gnahs for introducing me to the topic of lifelong learning in older age, awakening a passion for this field that I never thought possible, and encouraging me to pursue my doctoral degree.
My sincere thank you also goes to my Dean Prof. William Chismar at the University of Hawaii at Manoa Outreach College and to my former director Susan Hoffman at UC Berkeley’s Osher Lifelong Learning Institute for their support and encouragement. We had many fruitful discussions over the last years and both always gave me good advice.
I thank my fellow committee members of the LEARN Council at the American Society on Aging that I have been chairing for several years. I always enjoyed our discussions, exchange of ideas, and conference sessions.
The empirical part of this thesis would not have been possible without the study participants. My gratitude and thanks go to everyone who completed the questionnaire.
My wholehearted thanks go to the love of my life Prof. Philip von Doetinchem, who always supported me, believed in me, and helped me managing full-time work and writing a Ph.D.
thesis in the evening. Thank you for your love, for being my best friend, and for being who you are. I love you!
Heartfelt thanks go to my family and family-in-law. They have always been there for me, loved me, supported me, and helped me in all phases of my life. Ohana!
The last but of course not least, thank you goes to my friends. You do not have to be blood to be family!
„You’ve got it, just keep on pushing and, keep on pushing, and push the sky away!“
Table of Contents
List of Tables and Figures ... v
List of Abbreviations ... vii
1 Introduction ... 1
2 The Demographic Change ... 5
2.1 Important Terminologies ... 5
2.2 Population Growth and Shrinking Fertility as Influential Factors on the Demographic Developments ... 7
2.3 Declining Mortality and Increased Life Expectancy as Influential Factors on the Demographic Developments ... 11
2.4 Migration as an Influential Factor on the Demographic Developments ... 13
2.5 Aging of the Populations ... 15
2.6 Conclusion and Relevance for Older Adult Education ... 19
3 Age and Aging ... 23
3.1 Age Stages ... 24
3.1.1 Dimensions of Age ... 24
3.1.2 The Beginning of Old Age ... 25
3.1.3 The Concept of the Third and Fourth Age ... 26
3.2 Theories of Aging ... 28
3.2.1 Biological Explanations of Aging ... 29
3.2.2 Selected Psychosocial Theories of Aging ... 29
3.3 Cognitive Abilities of Older Adults ... 33
3.3.1 Intelligence ... 33
3.3.2 Memory and Learning ... 35
3.3.3 Wisdom ... 36
3.4 Life Situations and Risks of Old Age ... 38
3.4.1 Selected Health Risks of Old Age ... 38
3.4.2 Influential Factors on Health and Well-being ... 40
3.4.3 Social Worlds of Older Adults ... 42
3.4.4 Post-Retirement Careers and Volunteering ... 44
3.5 Conclusion and Relevance for Older Adult Education ... 46
4 Education in the Third and Fourth Age in the United States and Germany ... 49
4.1 Learning and Education in Old Age: A Conceptual Approach ... 50
4.1.1 Conceptual Frameworks of Learning ... 50
4.1.2 Contexts of Learning ... 51
4.1.3 Influential Factors on Learning ... 53
4.1.4 Characteristics of Older Adult Learners ... 54
4.1.5 The Difference between Learning and Education ... 55
4.1.6 Adult vs. Older Adult Education ... 56
4.1.7 Theoretical Foundations and Motivations for Learning and Education in Old Age ... 62
4.2 Geragogy ... 65
4.2.1 Historical Outline and Classification ... 66
4.2.2 Key Understanding and Activity Areas ... 67
4.2.3 Didactical Principles and Instructional Strategies ... 68
4.3 Educational Participation and Interests of Older Adult Learners ... 74
4.3.1 Participation and Barriers ... 75
4.3.2 Motivation ... 82
4.3.3 Educational Preferences ... 84
4.4 Institutionalization of Education in the Third and Fourth Age in the United States and Germany ... 86
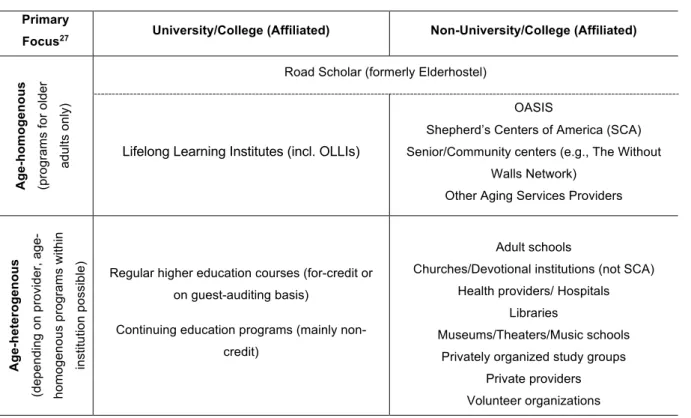
4.4.1 Providers of Older Adult Education in the United States ... 87
4.4.2 Providers of Older Adult Education in Germany ... 95
4.4.3 Opportunities for Learners in the Fourth Age ... 101
4.5 Conclusion ... 105
5 Silverlearning Study – An Empirical Study of Educational Activities and Preferences of Older and Oldest-old Adults in the United States and Germany ... 109
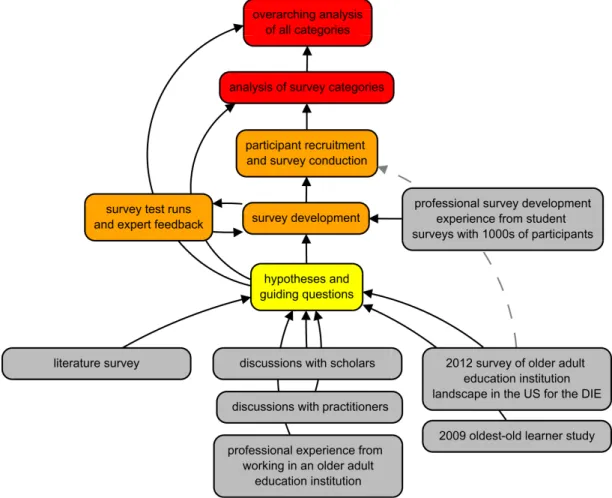
5.1 Study Goal and Guiding Questions ... 109
5.2 Study Development and Implementation ... 113
5.2.1 Development of Survey and Instrumentation ... 113
5.2.2 Study Implementation and Recruitment of Study Participants ... 119
5.3 Target Group Filtering ... 121
5.4 Methodological Approach of the Study Analysis ... 122
5.5 Characteristics of the Study Participants ... 123
5.5.1 Basic Demographics ... 123
5.5.2 Educational Background ... 127
5.5.3 Volunteering and Employment Status ... 132
5.5.4 Health and Independence ... 136
5.5.5 Social Interactions ... 144
5.5.6 Technology Usage ... 147
5.5.7 Conclusion ... 150
5.6 Older and Oldest-Old Adults in Education ... 152
5.6.1 Participation Over the Last 12 Months ... 152
5.6.2 Institutions ... 159
5.6.3 Subject Selection ... 164
5.6.4 Further Participation Plans ... 167
5.6.5 Educational Barriers ... 168
5.6.6 Conclusion ... 169
5.7 Motivations for Participation in Education in Older and Oldest-old Age ... 172
5.7.1 Reasons for Participation ... 172
5.7.2 Impact of Historical Events on Educational Behavior ... 178
5.7.3 Conclusion ... 181
5.8 Educational Preferences of Older and Oldest-old Adults ... 183
5.8.1 Preferred Learning Methods ... 183
5.8.2 Preferred Learning Partner ... 187
5.8.3 Institutional Preferences ... 188
5.8.4 Conclusion ... 191
5.9 Study Limitations and Suggestions for Further Research ... 193
6 Conclusion ... 197
Bibliography ... 205
Appendixes ... 233
A. English Survey Instrument ... 233
A.1 Stimulus ... 233
A.2 Survey Questions ... 234
B. German Survey Instrument ... 240
B.1 Stimulus ... 240
B.1 Survey Questions ... 241
List of Tables and Figures
List of Tables
Table 4.1: Providers of education for older adults in the U.S. ... 89
Table 4.2: Providers of education for older adults in Germany. ... 97
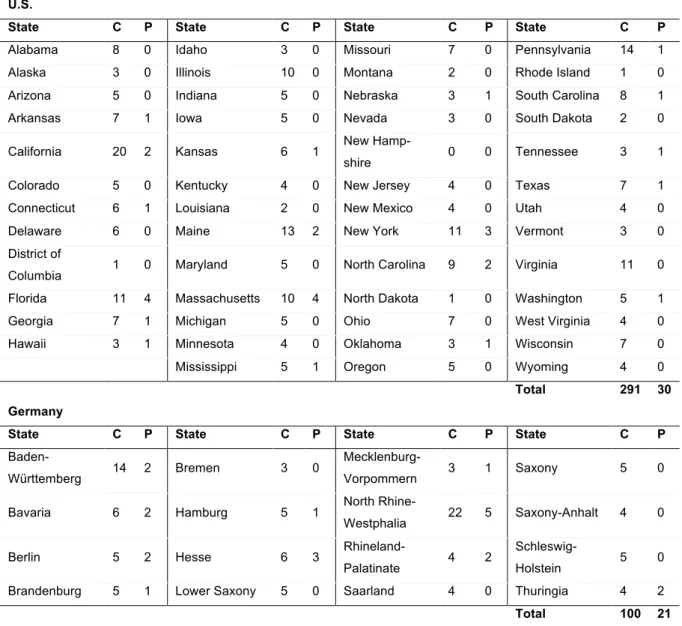
Table 5.1: Number of contacted (C) and participating (P) institutions by state, U.S. and Germany. ... 120
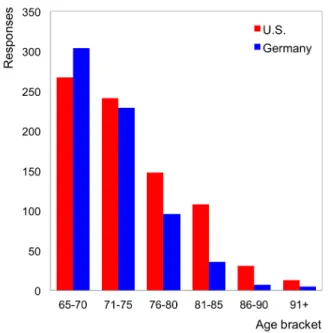
Table 5.2: Distribution by age groups 65-80 and 81+, U.S. and Germany. ... 124
Table 5.3: Highest formal school degree completed, U.S. ... 128
Table 5.4: Highest level of secondary education (not vocational education) completed, Germany. ... 129
Table 5.5: Highest vocational/higher education degree completed, Germany. ... 130
Table 5.6: Current volunteering activities, U.S. and Germany. ... 133
Table 5.7: Current housing situation, U.S. and Germany. ... 137
Table 5.8: Self-rated health by age groups and combined rating categories. ... 138
Table 5.9: Current relationship status, U.S. and Germany. ... 145
Table 5.10 Standardized beta values for two different logistic regression models investigating influencing factors on numbers of courses taken during the last 12 months. ... 157
Table 5.11: Participants’ average age by educational provider, U.S. and Germany. ... 161
Table 5.12: Subject areas by gender, U.S. and Germany. ... 165
Table 5.13: Reasons for participation in education, U.S. and Germany. ... 173
List of Figures
Figure 2.1: Total population U.S. and Germany, 1950-2017. ... 9
Figure 2.2: Germany’s population structure by gender in 1950 & 2050. ... 17
Figure 2.3: Relative population growth of age groups 60-79 and 80+ in Germany, 1950- 2050. ... 17
Figure 2.4: Development of the population structure in the U.S. by gender, 1950 & 2050. 18 Figure 2.5: Relative population growth of age groups 60-79 and 80+ in the U.S., 1950-2050. ... 18
Figure 2.6: Percentage of adults aged 55+ with a college degree in the U.S. and Germany, 2013-2016. ... 20
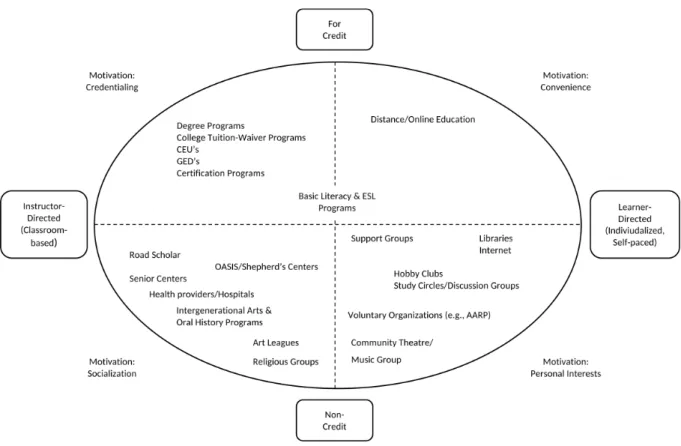
Figure 4.1: Typology of older adult education programs in the U.S. ... 88
Figure 5.1: Flowchart of the study development. ... 110
Figure 5.2: Age distribution, U.S. and Germany. ... 124
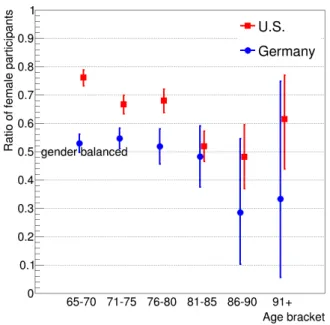
Figure 5.3: Ratio of female study participants as a function of age for the U.S. and Germany. ... 125
Figure 5.4: Impact of subjective health rating on willingness to commit to long-term activities by age group 65-80, U.S. and Germany. ... 140
Figure 5.5 Impact of subjective health rating on willingness to commit to long-term activities by age group 81+, U.S. and Germany. ... 140
Figure 5.6: Current challenges by age group 65-80, U.S. and Germany. ... 142
Figure 5.7 Current challenges by age group 81+, U.S. and Germany. ... 142
Figure 5.8: Average time between meetings with social contacts by age groups, U.S. ... 146
Figure 5.9: Average time between meetings with social contacts by age groups, Germany. ... 146
Figure 5.10: Electronic devices used at least once a week, U.S. and Germany. ... 148
Figure 5.11: Average number of courses taken during the last 12 months for different age groups, U.S. and Germany. ... 153
Figure 5.12: Institutions attended, U.S. ... 160
Figure 5.13: Institutions attended, Germany. ... 160
Figure 5.14: Course subjects, U.S. and Germany. ... 163
Figure 5.15: Subject areas by age group 65-80, U.S. and Germany. ... 166
Figure 5.16: Subject areas by age group 81+, U.S. and Germany. ... 166
Figure 5.17: Reasons for non-participation in education, U.S. and Germany. ... 169
Figure 5.18: Preferred learning methods, U.S. and Germany. ... 184
Figure 5.19: Preferred learning methods by gender, U.S. ... 185
Figure 5.20: Preferred learning methods by gender, Germany. ... 185
Figure 5.21: Institutional preferences, U.S. and Germany. ... 189
List of Abbreviations
AES Adult Education Survey
BASE Berlin Aging Study
BMFSFJ Bundesministerium für Familie, Senioren, Frauen und Jugend (Engl.: Federal Ministry for Family Affairs, Senior Citizens, Women, and Youth)
Ch. Chapter
CJE Council for Jewish Elderly
E.g. For example
Engl. English
EPS Education Participation Scale
Etc. Et cetera
EU European Union
F. Following page
FF. Following pages
Fig. Figure
Figs. Figures
GDR German Democratic Republic
Ger. German
Hrs. Hours
Ibid. Lat. ibidem, meaning “the same place”
Incl. Including
IRB Institutional Review Board LLI Lifelong Learning Institute
MFR2 McFadden Pseudo R2
NCES National Center for Education Statistics OLLI Osher Lifelong Learning Institute
OLLI @Berkeley Osher Lifelong Learning Institute at University of California, Berkeley
P. Page
PP. Pages
SCA Shepherd’s Centers of America
Sec. Section
Secs. Sections
SvD Sandra von Doetinchem (Author)
Tab. Table
Tabs. Tables
U3L Universität des Dritten Lebensalters (Engl. University of the Third Age)
U.S. United States of America
VSC Virtual Senior Center
WHO World Health Organization
1 Introduction
The objective of this thesis is to investigate education in older and oldest-old age and to explore the field further with an international comparative empirical study of educational behaviors, preferences, and motivations of learners aged 65 and older in the United States and Germany. This work is motivated by the underlying understanding that access to education is a fundamental human right at every stage in life. Also Brian Findsen postulates in his article
“Social Institutions as Sites of Learning for Older Adults. Differential Opportunities” that
“whether a person is just beginning life or nearing its end, regardless of circumstances, should not affect his or her right of access to education” (Findsen 2006, p.68). However, what is the current status of lifelong learning regarding education for older adults in aging countries, like the U.S. and Germany? Can we generally assume that older adults are in need of an education after retirement, and, if yes, does this need also apply to oldest-old adults who may be of risk of physical or cognitive impairments?
In addition to the human rights aspect, older adult education is especially important because it can play a crucial role in responding to current and future demographic developments. In particular, many developed countries, such as the U.S. and Germany, are facing a massive social transformation due to aging of their populations, which will result in a reversal of the population’s age structure with a decreasing percentage of younger and an increasing percentage of older members of the population. These demographic trends create new challenges, but also opportunities, for many aspects of our societies, including the economy, workforce, health care, housing, retirement systems, and the educational sector. For instance, the fact that there will be fewer adults in traditional working age and more individuals in retirement age raises the questions of how labor productivity can be maintained, retirement systems can be financed, and personal financial security in old age can be ensured in the future.
One possible strategy could be to utilize the skills and knowledge of older adults on a paid or unpaid basis more effectively. In this regard, a platform for ongoing professional development opportunities for older workers and volunteers needs to be established. Moreover, learning in old age can be an essential strategy for leveraging health care costs that accompany aging
populations, as research emphasized the benefits of education and learning for the older individual in regard to, e.g., well-being, physical and cognitive health, and life satisfaction.
Participation in education also provides opportunities for social networking and active engagement. This aspect appears especially important when considering that the time spent in retirement has developed into an independent, in many cases, multidecade long life stage that needs to be filled with meaning. However, older adult learners are so far underrepresented in education, and oldest-old or frail individuals are often entirely overseen by educational providers. Keeping the aforementioned multifaceted benefits of ongoing learning and education in old age in mind, expanding educational efforts towards all subgroups of the older population is critical.
In general, no consensus exists whether old age, and specifically oldest-old age, requires a separate form and method of education. Also, comprehensive national and international comparative research on the participation patterns of mature adults in education is lacking, which emphasizes the neglect of the topic by educational politics, policies, and research.
Therefore, this thesis responds to the need for further research on education in older and oldest- old age.
The following thesis is organized into six chapters: Chapter 2 discusses current and future demographic developments in developed countries, like the U.S. and Germany, and addresses population aging as well as the factors that influence a country’s age structure, including shrinking fertility, increasing life expectancy, declining mortality, and migration.
Chapter 3 explores age and aging, including definitions of age and old age as well as associated characteristics, risks, and opportunities. The concept of the third and fourth age as well as selected theories that try to explain human aging find particular attention. Since knowledge of these aspects is of special relevance for the educational work with older and oldest-old adults, the chapter will also discuss the learning abilities and cognitive potentials of the elderly.
Chapter 4 focuses on educational theories relevant to the (oldest-)old age and lays the foundation for the understanding of learning and education in this very diverse and heterogenous age stage. The conceptual frameworks of learning, education, and geragogy are discussed, and discourses on education in old age as well as didactical ideas are presented.
Furthermore, characteristics and educational preferences of older adult learners as well as motivations for participation in education in old age, potential barriers, and influential factors are highlighted. For an understanding of the current state of older adult education in both countries, an overview of the most common providers of education for older adults in the U.S.
and Germany is given. Since most of the highlighted providers focus on active older adults, selected program ideas that include frail and homebound elderly are discussed.
Chapter 5 presents the empirical Silverlearning Study, which investigates educational behaviors, preferences, and motivations of learners aged 65 and older in comparison between the U.S. and Germany. The study also explores if these aspects are subject to change during the life phase of old age.
Chapter 6 concludes this thesis with a final summary.
2 The Demographic Change
The world’s total population is growing. At the same time, many countries in the world experience a significant aging of their populations, which results in a reversal of the populations’ age structure. Critical factors for this global population growth and aging are increasing fertility, a declining mortality rate, and increased life expectancy. These social transformations create opportunities and challenges for many aspects of our societies, including health care, the workforce, housing, and retirement systems. As they will also impact the education sector, including adult and older adult education, this chapter discusses global demographic trends while also highlighting the population developments in the U.S. and Germany. Selected demography-related terminologies are introduced to provide a foundation for more detailed discussions.
2.1 Important Terminologies
Demography
Demography is the scientific discipline that studies the dynamics of populations by focusing on three main processes that cause changes in populations: birth, mortality, and migration (see Max Planck Institute for Demographic Research 2017). To evaluate and understand population trends and structures, demographers collect official statistics, conduct surveys and censuses, and analyze heritage books. In addition, they incorporate knowledge from both social and biological sciences, such as geography, genetics, and anthropology. As demographic scenarios have become the subject of political and policy-making discussions in many developed countries, the field increasingly receives public interest (see Kohler/Vaupel 2000, pp.19f.).
Demographic Change
A demographic change describes changes in the population structure and size caused by changing death and birth rates as well as by migration. These days, this change is characterized by both an increasing life expectancy and a declining birthrate. Together, both effects cause a
reversal of the age structure of a population, which will eventually lead to its shrinkage (see Rostocker Zentrum zur Erforschung des Demografischen Wandels 2017a).
Fertility
From a demographic viewpoint, fertility describes “the average number of live births a hypothetical cohort of women would have at the end of their reproductive period if they were subject during their whole lives to the fertility rates of a given period and if they were not subject to mortality. It is expressed as live births per woman” (United Nations 2017b). The internationally standardized age range 15 to 49 years is typically used to classify women of reproductive age. Fertility calculations do not take into account childless women or women who give birth before or after this standardized age period. However, these children are included in the total birth statistics of a population (see Statistisches Bundesamt 2012b, p.8).
Life Expectancy
Life expectancy is a measure for standardizing the development of mortality during specific periods, which is calculated based on mortality tables (see Rostocker Zentrum zur Erforschung des Demografischen Wandels 2017b). When discussing the life expectancy of populations, demography distinguishes between life expectancy at birth and further life expectancy at the age of 60. According to the United Nations (2015b, p.48), life expectancy at birth determines
“the number of years a person would be expected to live if he or she were exposed throughout life to the prevailing age-specific mortality risks of a given period.” Further life expectancy at the age of 60 is measured by describing “the number of additional years a 60-year-old person would be expected to live if exposed throughout the remainder of life to the prevailing age- specific mortality rates of a given period” (ibid., pp.48f.). As the mortality risk is lower in older age, the further life expectancy at age 60 is always slightly higher than the life expectancy at birth, assuming that outer influential factors remain stable (see Bundesinstitut für Bevölkerungsforschung 2016, pp.34f.).
Migration
Migration are “moves that cross jurisdictional boundaries” (Goworowska/Gardner 2012, p.2). Persons who live outside the country in which they were born for a minimum of one year can be classified as international migrants (see United Nations 2017d). The difference between immigration to and emigration from a particular area during a specific time period is defined as net migration. A positive net migration rate indicates that more people have moved to an area,
while a negative number means that more people have left than arrived (see Goworowska/Gardner 2012, p.2).
2.2 Population Growth and Shrinking Fertility as Influential Factors on the Demographic Developments
For a long time, the global population grew very slowly. After the one billion mark was met for the first time at the beginning of the 19th century, the population increase accelerated in the following two centuries, reaching seven billion people in 2011. Predictions estimate that the world population will continue to increase at a similar pace until 2050 when the global population is expected to reach the 10 billion mark. Starting from mid-century, the speed of growth will likely extenuate and stagnate at about eleven billion people by 2100. The vast majority of the world population currently resides with about 4.4 billion people in Asia, followed by Africa (1.2 billion), North/Latin America (992 million), Europe (738 million), and Oceania (39 million; see Bundesinstitut für Bevölkerungsforschung 2016, pp.74f.).
In contrast to world population growth, global fertility has decreased drastically over the last decades. While a woman in 1975 had on average 4.5 children, the number declined by 80 percent to currently about 2.5 children per woman and is expected to further decrease to 2.4 by 2030 and 2.0 by the end of the century (see United Nations 2015a, p.6; 2015c, p.5).
The discussed developments vary between the different parts of the world. Two opposite population trends are visible: while the developing1 and least developed2 countries see a growing young population since a few decades, the developed3 countries face a shrinking aging population (see Bundesinstitut für Bevölkerungsforschung 2016, pp.74f.). The reason for the increasing population in developing and least developed countries lies within a growing overall
1 Developing country: “A country having a standard of living or level of industrial production well below that possible with financial or technical aid; a country that is not yet highly industrialized.”
(https://www.dictionary.com/browse/developing-country, 01/20/2020)
2 Least developed countries: “Low-income countries confronting severe structural impediments to sustainable development. They are highly vulnerable to economic and environmental shocks and have low levels of human assets.” (United Nations, 2018, 01/20/2020)
3 Developed country: “A sovereign state with high industrial and Human Development Index compared to other countries. It must also have a technologically advanced infrastructure, and its economy must be highly developed. It is also referred to as industrialized country or more developed country.”
(https://www.worldatlas.com/articles/what-is-a-developed-country.html, 01/20/2020)
birth rate. Nevertheless, this trend is not visible in all of the developing and least developed countries. Some of these countries also experience a decline in the birth level due to more comprehensive sex education and greater accessibility to contraceptives (see Bundesinstitut für Bevölkerungsforschung 2016, pp.74f.). For example, more than half of the mentioned global population growth will likely occur in Africa, which had the most substantial population growth worldwide in 2015 (2.6%) because of the country’s high fertility rate (4.7 children per woman).
Although Africa’s population is expected to grow drastically, the fertility rate will decrease to 3.1 children per woman by 2050 and to 2.2 by 2100 due to the reasons mentioned above (see United Nations 2015c, p.3). On the other side, the developed regions will see a shrinking population. For instance, Europe’s population is projected to decrease by about 70 million people by 2050. As a consequence, the fraction of Europeans to the total world population will decline from 11 percent in 2011 to below 7 percent by the end of the century (see Bundesinstitut für Bevölkerungsforschung 2013, p.70). Europe’s fertility rate is with currently 1.6 children per woman the lowest worldwide, followed by Northern America, where the current rate is 1.9.
Hence, both regions are below the necessary replacement level of 2.1 children per woman (see United Nations 2015a, p.3; 2015c, p.3). Although Europe's fertility rate is low, European countries are not among the countries with the lowest fertility rate worldwide. In 2015, a woman in China's Taiwan Province could expect to have on average 1.1 children, followed by China’s Macao special administrative region, China’s Hong Kong special administrative region, and Singapore, where the rate was 1.2 (see United Nations 2015b, pp.127ff.). China’s one-child policy, which was in place between 1979 and 2015 and which limited families to one child, influenced the country’s fertility rate.
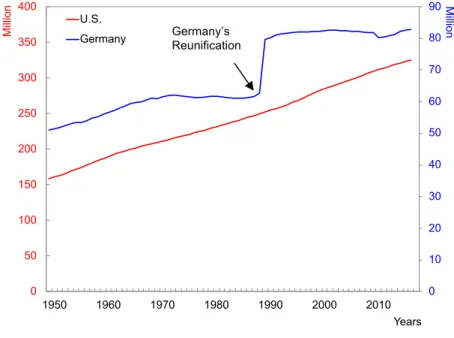
Like the global population, the population in the U.S. also experiences strong growth. Over the last six decades, the de facto population size had more than doubled from 158.8 million people in 1950 to 324.5 million in 2017 (Fig 2.1). Further growth is anticipated, albeit at a slower pace, reaching 389.6 million people by 2050 and 447.5 million by 2100 (see United Nations 2017l). The reasons for the growth lie within increased life expectancy, strong immigration, and a fertility rate, which is with currently 1.9 children per woman higher than in other developed countries, like Germany or Japan (see United Nations 2017k). Different fertility patterns of the various racial and ethnic groups account for the country’s overall higher fertility rate (see Shrestha/Heisler 2011, p.6; Martin et al. 2017, pp.5ff.). Although the fertility rate in the U.S. is higher than in other developed countries, it is below the replacement level since more than four decades. After the fertility peaked at 3.6 children per woman during the
Figure 2.1: Total population U.S. and Germany, 1950-2017.
(West Germany until 1989 only; Source: United Nations 2017l; Statistisches Bundesamt 2019a)
post-World War II “baby-boom years” of 1946 to 1964, the fertility rate dropped in the 1970s and has remained with about 1.9 children per woman relatively stable since the mid-1980s. A similar rate is projected in the future (see United Nations 2017k).
While the U.S. population experiences a constant growth, the population in Germany has remained relatively stable since the 1990s (Fig. 2.1) and is expected to shrink by 14 percent to 71.0 million by the end of the century due to the country’s low fertility rate (see United Nations 2017l). Currently, the de facto population in Germany is 82.1 million (see United Nations 2017l). However, the German Federal Statistical Office anticipates with 82.8 million people a slightly higher population size due to current immigration trends (see Statistisches Bundesamt 2017a). A decline of the fertility rate from a peak value of 4.7 children per woman was first noticeable in Germany at the end of the 19th century. During the “baby-boom” years of the 20th century, the fertility rate increased again to 2.5 children per woman, followed by a decline.
After the number of live births reached its lowest point in 2011, the fertility rate started to slowly increase again, but is with currently 1.4 children per woman far below the necessary replacement level. As a consequence, a generation gets only replaced by two-thirds, which leads to a decrease in the number of women of reproductive age. While 17.1 million women were between 15 to 49 years old in the early 1980s4, the number had dropped by about two million
4 East and West Germany combined
0 10 20 30 40 50 60 70 80 90
0 50 100 150 200 250 300 350 400
1950 1960 1970 1980 1990 2000 2010
Million
Million
Years U.S.
Germany Germany’s Reunification
in 2011. Generally, increased educational levels and labor force participation among women are important influential factors on the fertility rate in Germany. While 20 percent of the women aged 15 to 64 had a college degree in 2001, the number rose to 26 percent until 2011.
Consequently, their participation in the work force increased over the last years due to a greater willingness of women to work, changed regulations in labor market policies, and an overall positive economy in Germany. In 2011, 71 percent of women were employed, which is an increase of 9 percent from 2001. In addition to the increased educational levels of women in Germany, the educational level of men also increased, albeit at a slower pace. In 2011, 29 percent of men had a college degree, which was thus 3 percent higher than among women.
Nevertheless, in the younger age group 30 to 34 years, women (35%) already outnumbered men (31%) in advanced educational degrees (see Statistisches Bundesamt 2012a, pp.6&18). Similar trends are also visible in the total U.S. population. While 26 percent of adults aged 25 and over in the U.S. completed at least four years of college in 2001, the number rose to 30 percent in 2011 and 34 percent in 2017. During this time, the educational level of women increased at a much faster pace than those of men. While 24 percent of the women completed at least four years of college in 2001, the percentage rose to 35 percent in 2017. For men, a smaller increase from 28 percent (2001) to 34 percent (2017) took place (see United States Census Bureau 2017b).
Higher education levels of women also correlate with childlessness, which is, compared to other European countries, the highest in Germany. In 2012, about one-fifth of the 45 to 49-year- old women did not have children, with the largest percentage among female college-graduates (see Bundesinstitut für Bevölkerungsforschung 2016, pp.26f.). Greater educational attainment also impacts the childbearing age. Mothers today have their first child at an average age of 30.9 years, which is 6.5 years older than in 1970 (see Statistisches Bundesamt 2017d). The mean age of women at their first birth has also increased in the U.S. (see Taylor et al. 2010, p.2). While women in 2000 had their first child at an average age of 24.9 years, the number grew to 26.3 years by 2014. This increase is caused by a decline in the proportion of women who gave birth to their first child below the age of 20 and an increase of first-time mothers over the age of 30.
In the age group 30 to 34, a growth from 17 percent in 2000 to 21 percent in 2014 occurred. For the age group 35+, the percentage increased from seven percent to nine percent during the same time period (see Mathews/Hamilton 2016, pp.1f.). In summary, Germany and the U.S. as well as other developed countries in the world, currently experience a so-called demographic- economic-paradox (see Birg 2001, p.42), which means that the wealthier, innovative, and better
educated a country is, the fewer children it has (see Birg 2001, p.42; Bundeszentrale für politische Bildung 2011, p.13).
2.3 Declining Mortality and Increased Life Expectancy as Influential Factors on the Demographic Developments
The global life expectancy at birth has increased substantially since the middle of the last century due to medical improvements that led to an increased survival rate among children below the age of five. While the life expectancy at birth was 46.9 years for both genders combined in 1950, the number grew to 70.8 years in 2015. Although a further increase in the global life expectancy at birth is projected, a precise calculation is complicated because of its dependencies on different influential factors, like political situations, environmental conditions, or medical developments. However, current estimations expect an increase to 76.9 years until 2050 and to 82.6 years until 2100, respectively (see United Nations 2013, p.6; 2015b, p.48;
2017f). Not only has the life expectancy at birth increased globally, but also the further life expectancy at age 60. While older adults could expect to live another 14.1 years in 1950, the number increased to 20.2 years in 2015. By 2050, this number is projected to reach 22.9 years and 26.0 years by the end of this century (see United Nations 2015b, p.50; 2017f).
In 2015, the life expectancy at birth in more developed regions was about 78.4 years, which is 9.3 years higher than in less developed regions and 15.7 years higher than in the least developed countries. Similar results are visible for life expectancy at age 60. Older adults in more developed regions could expect to live another 22.9 years and in the less developed regions 19.0 years. The life expectancy at age 60 in the least developed regions was about 17.4 years (see United Nations 2017f). Looking at the different regions, the highest life expectancy at birth had Northern America with 79.2 years, followed by Oceania with 77.5 years, and Europe with 77.0 years. All three regions also had the highest life expectancy at age 60. In the same survey period, older adults in Oceania could expect to live another 23.7 years, in Northern America 23.5 years, and in Europe 21.9 years. In contrast, Africa had with 59.5 years the lowest life expectancy at birth and with 16.7 years the lowest life expectancy at age 60. Although Africa has the lowest life expectancy among all regions, the continent experienced the most significant growth in life expectancy. Between 1995 and 2015, life expectancy at birth increased here by 7.3 years mainly due to reduced mortality in early childhood and improvements in the
survival rate above the age of 60. A further increase in the region’s life expectancy is expected (see United Nations 2015b, pp.50ff.).
Life expectancy at birth is continuously increasing in the U.S. and Germany. In the early 1970s, life expectancy at birth in the U.S. was 75.4 years for girls and 67.7 years for boys. At the same time, female newborns in Germany could expect to live 74.1 years and males 67.9 years. More than forty years later, life expectancy at birth increased in the U.S. for girls by about 9 percent to currently 81.9 years, and for boys by 14 percent to 77.3 years. An even higher percentage increase is visible in Germany, where life expectancy at birth increased by 13 percent for girls, reaching 83.6 years, and by 16 percent for boys, reaching 79.0 years (see Bundesinstitut für Bevölkerungsforschung 2016, pp.34f.; United Nations 2017f). A further increase is expected for both countries. Although an exact prediction is not possible, the United Nations (2017f) anticipate that life expectancy at birth will increase for female newborns to 90.9 years in the U.S. and 93.2 years in Germany by the end of the century. If all influential factors outlined above would remain stable, boys born in the U.S. could expect to live 88.4 years and boys born in Germany 89.9 years.
As discussed earlier, the reason for the increase in the life expectancy at birth can be seen in reduced perinatal, infant, and child mortality due to medical developments of the 20th century.
In both countries, infant mortality reached a historical low point. The current infant death rate per 1,000 live births is 5.8 in the U.S. and 3.2 in Germany (see Bundesinstitut für Bevölkerungsforschung 2016, p.35; Kochanek et al. 2016, p.2; United Nations 2017e).
Improvements in medicine and hygiene as well as technological advancements and stable political circumstances also led to an increase in the life expectancy at age 60 over the last decades, and thus to a longer time spent in retirement. In comparison to the early 1970s, the further life expectancy increased in the U.S. for women from 21.0 to currently 25.1 years and for men from 16.2 to currently 22.3 years. During the same period, life expectancy at age 60 increased for women in Germany by 34 percent from 19.1 to 25.5 years and for men by 44 percent from 15.4 to 22.2 years (see United Nations 2017f).
The discussion shows that although the gap between the genders will decline, women have a slightly longer life expectancy than men. On a global scale, women can expect to outlive men by about 4.5 years (see United Nations 2015b, p.2). Research pointed to different biological preconditions and health behaviors between the genders as a possible explanation (see Luy/Gast 2014, pp.150ff.; Luy/Wegner-Siegmundt 2015, pp.708ff.; Bundesinstitut für Bevölkerungsforschung 2016, pp.34f.). As a result, a larger percentage of the older population is female. During the years 2010 to 2015, women accounted for 54 percent of the total
population aged 60 and over5 worldwide and for 61 percent of the oldest-old population aged 80 and over (see United Nations 2015b, pp.2&127ff.). In 2015, the female ratio in the U.S. was 54 percent in the age group 60+ and 62 percent in the population 80+. In Germany, women accounted for 55 percent of the total population aged 60+ and for 64 percent of the total population aged 80+ during the same period (see United Nations 2017j). A slightly more balanced gender ratio is expected by 2050 in the oldest-old age group due to improving life expectancy of men. By mid of this century, women in both the U.S. and Germany are expected to account for 55 percent of the total population 80+ (see United Nations 2015b, pp.2&127ff.;
2017l).
2.4 Migration as an Influential Factor on the Demographic Developments
Immigration into and emigration from an area is another factor that impacts the demographic structure of a population. For example, as international migrants are typically younger, immigration can help to slow down or even reverse the aging of populations in countries that experience a strong immigration flow (see United Nations 2015b, pp.61f.;
2017d). Nevertheless, as the migrants will also age, this effect can only be maintained with an ongoing flow of young immigrants. In contrast, the emigration of younger workers can accelerate population aging (see United Nations 2015b, pp.61f.).
Traditionally, the U.S. has been an immigration country and still has the largest number of international migrants worldwide. Currently, about 48.8 million foreign-born people live in the U.S., which accounts for 19 percent of the world’s total number of international migrants. The share of international migrants on the total U.S. population is about 15 percent (see United Nations 2017c, p.6; 2017l). The most substantial immigration growth occurred between 1990 and 2017, where a total of 26.5 million people immigrated to the country with the majority coming from Mexico, China, India, the Philippines, and Vietnam (see United Nations 2017c, p.6). Consequently, the net migration rate peaked with 6.3 per 1,000 people in the late 1990s.
Also, more people are immigrating into than emigrating from the U.S., resulting in a positive net migration rate of 2.8 (see United Nations 2017h).
5 For better readability, the age groups 60 and older and 80 and older are abbreviated to 60+ and 80+ in the following. This format is also applied to other age groups in this thesis.
Germany has also become an important country of immigration since the mid of the last century. However, the type and flow of immigration have changed over the decades. After the end of World War II (1939-1945), the country focused on recruiting temporary working migrants from Southern Europe as an attempt to counteract the shortage of human resources in the workforce. In 1973, a time where 2.6 million foreigners were employed in Germany, a recruitment ban was released and ended the country’s organized working immigration. As the worker’s direct family members were exempt from this ban, their arrivals characterized the country’s immigration activity during the 1970s and 1980s and led to an increase to 4.6 million foreign-born people by 1980. Even today, the working immigrants and their families still account for the largest group of people with a migration background living in Germany. Another immigration wave of mainly political refugees, (late) repatriates, and asylum seekers from countries, such as Africa, Asia, Yugoslavia, or Rumania, occurred in the 1990s. During the early 1990s, about 1.4 million people immigrated to Germany (see Bade/Oltmer 2004, pp.127ff.; Bundesinstitut für Bevölkerungsforschung 2016, pp.38ff.; Statistisches Bundesamt 2016b, pp.28ff.). In the following years, the influx of immigrants steadily decreased and reached with about 600,000 new arrivals its lowest point in 2006. Especially high-qualified employees, self-employees as well as seasonal and contract workers moved to Germany during this time. Since the beginning of this decade, immigration to Germany has increased again.
Until 2014, this increase was primarily caused by Southern Europe’s market crisis and the first free movement of workers from Eastern European countries. In 2015 and 2016, especially international refugees seeking protection from the ongoing conflicts in the Middle East immigrated to Germany. In the first of these two years, more than one million asylum seekers were registered, with the majority of refugees coming from Syria, Albania, and Kosovo (see Bundesinstitut für Bevölkerungsforschung 2016, pp.38ff.). Currently, about 18.6 million of the people living in Germany have a migration background, which is a drastic increase from 1.5 million in 2015. About half (9.6 million) of them are German citizens (see Statistisches Bundesamt 2017b).
Although Germany currently sees strong immigration, it is also a country of emigration.
International mobility and the emigration from Germany into other countries have especially increased since the 1990s. These days, about 150,000 people leave the country every year, which is an increase from 50,000 emigrations in 1970 (see Bundesinstitut für Bevölkerungsforschung 2016, p.41).
As a consequence of these developments, the net migration rate in Germany has seen sharp fluctuations over the decades and is with a current rate of 4.5 relatively high. Although the rate
has mainly remained positive since the mid-1950s, indicating that more people immigrated than emigrated during the last seven decades, the rate is not large enough to counteract the discussed decline in the population size and the aging of the population. (see United Nations 2017h).
2.5 Aging of the Populations
Developments in fertility and mortality rates as well as migration are important influential factors on the population aging. Between the years 2015 and 2050, the number of older adults aged 60+ years worldwide is expected to increase by 133 percent from 901 million to nearly 2.1 billion (see United Nations 2015b, p.9). In comparison to 1950, the proportion of older adults aged 60+ on the world's population has grown from 8 percent to 12 percent in 2015 and is expected to experience a further increase to 21 percent by mid of the century. Therefore, about one in every five people will be 60+ years old (see United Nations 2013, p.11; 2015b, p.3). While the older adult population proliferates, the number of children and young adults will only slightly increase. As a consequence, the number of younger people in the world population decreases. For a long time, the global population consisted of more children under the age of 10 than older adults. The opposite will be the case by the mid of the century. In 2050, older adults (2.1 billion) will outnumber the youth aged 10 to 24 (2.0 billion; see United Nations 2015b, p.24).
Not only is the total global population aging, but also the older population itself. The reasons for this can be seen in the discussed increased life expectancy as well as in the aging of larger cohorts, such as the “Baby Boomers”, which were born in the post-World War II period. The oldest-old adult population aged 80+ will experience the fastest growth and will grow even faster than the overall older adult population. By the mid of the century, the oldest-old population is expected to triple from 125 million in 2015 to 434 million. Their fraction on the older population will grow from 14 percent (2015) to 21 percent until 2050 (see United Nations 2015b, pp.2&10).
The rate of aging is not evenly distributed in all parts of the world. The fastest growth of older adults aged 60+ is expected to occur in the less developed regions, which accounted for two-thirds of the global older adult population in 2015. This number is predicted to increase to nearly 80 percent by 2050. In comparison to 1950, the size of the older population in developing regions has grown from 108 million (1950) to 602.1 million (2015). Predictions estimate a further growth to 1.7 billion by 2050 (see United Nations 2013, pp.4&9; 2015b, p.9). The more
developed parts of the world are also aging, albeit with a much slower and even declining rate.
Between 2000 and 2015, the older population grew in these regions by 29 percent from 231 million to 298.8 million and is expected to continue to increase with a three percent slower rate, reaching 375.2 million people by 2030. Until 2050, the growth rate will continue to decline to about 12 percent, reaching 421.4 million older adults (see United Nations 2013, pp.4&9; 2015b, p.9).
While Europe and Northern America are expected to see a strong increase in the number of older adults aged 60+, their share on the world’s older population will decline. In Europe, the share is expected to decline from 20 percent in 2015 to 12 percent by 2050, taking into account a growth from 176.5 million in 2015 to 242 million older adults by 2050. In Northern America, the older population will grow from 74.6 million in 2015 to 122.7 million by 2050. Its share on the world’s older population will, therefore, decrease from eight percent to six percent during these years (see United Nations 2015b, pp.9&122ff.).
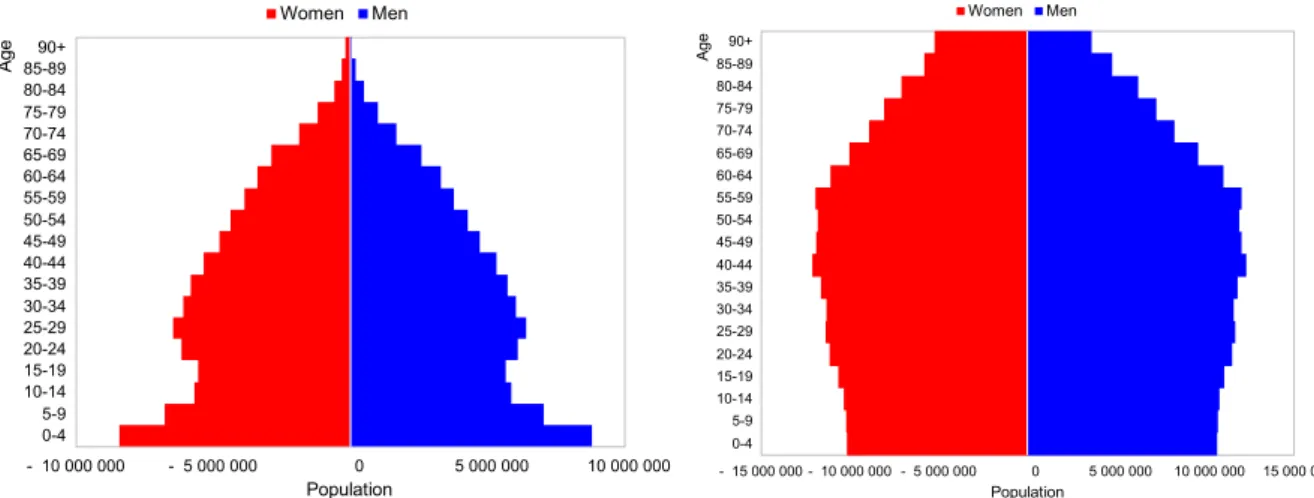
High-income countries see the strongest aging process. Out of the countries with at least 90.000 inhabitants, Germany has together with Japan and Italy the oldest populations worldwide. In 2015, 22.3 million people in Germany were 60 years old and over. The country’s age structure of the population has changed profoundly during the last century. At the beginning of the 20th century, mortality in the population in Germany was still high due to, for example, lower infant and maternal survival rates as well as to lower medical and hygiene standards. As a result, the age structure of the population had a pyramid-like shape with a broad base of young people and a small top of older adults (see Statistisches Bundesamt 2006, p.16; Bundesinstitut für Bevölkerungsforschung 2016, p.10). Consequently, the median age of the population was relatively young (23.6 years; see Rostocker Zentrum zur Erforschung des Demografischen Wandels 2005, p.11). In the following years, the age distribution of the population lost its pyramid shape and the base of younger adults got thinner due to a declining birth and mortality rate. Deep cuts in the population’s age distribution were also caused by the two world wars and the economic crisis, which increased the average age of the German population to 34.7 years in 1960 and also over-proportionately decimated the number of men in the population for a long time (see Rostocker Zentrum zur Erforschung des Demografischen Wandels 2005, p.11;
Bundesinstitut für Bevölkerungsforschung 2016, p.11; United Nations 2017g). Over the next five decades, the median age increased by about eleven years, resulting in a fir-tree-shaped age distribution. As discussed projections estimate a further growth of the older adult population.
By 2050, the median age is expected to increase to 50.4 years, which will cause the age structure
Figure 2.2: Germany’s population structure by gender in 1950 & 2050. (Source: United Nations 2017j)
Figure 2.3: Relative population growth of age groups 60- 79 and 80+ in Germany, 1950-2050.
(Source: United Nations 2017j)
of the population to reach a mushroom-like shape (see Bundesinstitut für Bevölkerungsforschung 2016, p.10; United Nations 2017f). Figure 2.2 visualizes this development of the population’s age structure in comparison between the years 1950 and 2050.
According to the Bundesinstitut für Bevölkerungsforschung (2013, p.11), this trend would also continue if the number of children per woman would increase because of a general decrease of potential mothers. A reversal seems only possible on a long-term basis. In addition to an overall increase in the median age of the population, the share of older adults on the total population in Germany is expected to grow. While only 15 percent of the population were aged 60+ in 1950, the number increased to 27 percent in 2015. In comparison, the ratio of young people in the age bracket 0 to 24 years decreased from 38 percent to 24 percent during the same time period. Projections indicate a further change in the old and young people ratio to 38 percent
- 4 000 000 - 2 000 000 0 2 000 000 4 000 000 0-4
5-9 10-14 15-19 20-24 25-29 30-34 35-39 40-44 45-49 50-54 55-59 60-64 65-69 70-74 75-79 80-84 85-89 90+
Population
Age
Women Men
- 3 000 000 - 2 000 000 - 1 000 000 0 1 000 000 2 000 000 3 000 000 0-4
5-9 10-14 15-19 20-24 25-29 30-34 35-39 40-44 45-49 50-54 55-59 60-64 65-69 70-74 75-79 80-84 85-89 90+
Population
Age
Women Men
0 5 10 15 20 25 30
1950 1960 1970 1980 1990 2000 2010 2020 2030 2040 2050
Percentage
Years 60-79
80+
Figure 2.4: Development of the population structure in the U.S. by gender, 1950 & 2050.
(Source: United Nations 2017j)
Figure 2.5: Relative population growth of age groups 60-79 and 80+ in the U.S., 1950-2050.
(Source: United Nations 2017j)
(60+) and 22 percent (0-24) by the mid of the century (see United Nations 2017i). The oldest- old population aged 80+ will experience the strongest growth in Germany. In 2015, about six percent of the total population in Germany was 80 years old and over. Their share is expected to double by 2050 (13.3%) and to triple by 2100 (15.2%; see United Nations 2017i). The relative population growth of the age groups 65 to 79 and 80+ in Germany is visualized in Figure 2.3.
According to these developments and a shrinking working-age population, Germany can be described as an “oldest country” (Hayutin 05/2010, p.1).
The U.S. is a “middle-aged country” (Hayutin 05/2010, p.1). In 2015, 54 million adults were 60+ years old (see United Nations 2017j). Although the country is also facing an aging and thus shrinking working-age population, the U.S. is with a current median age of 37.6 years about eight years younger than Germany (see United Nations 2017g). At the beginning of the
- 10 000 000 - 5 000 000 0 5 000 000 10 000 000 0-4
5-9 10-14 15-19 20-24 25-29 30-34 35-39 40-44 45-49 50-54 55-59 60-64 65-69 70-74 75-79 80-84 85-89 90+
Population
Age
Women Men
- 15 000 000 - 10 000 000 - 5 000 000 0 5 000 000 10 000 000 15 000 000 0-4
5-9 10-14 15-19 20-24 25-29 30-34 35-39 40-44 45-49 50-54 55-59 60-64 65-69 70-74 75-79 80-84 85-89 90+
Population
Age
Women Men
0 5 10 15 20 25
1950 1960 1970 1980 1990 2000 2010 2020 2030 2040 2050
Percentage
Years 60-79
80+
last century, the median age in the U.S. was 22.9 years. During the 20th century, the country experienced a rapid population aging, but strong immigration trends and the mentioned “baby boom” (1946-1964) resulted in an overall younger age structure and median age (see Hobbs/Stoops 2002, p.51; United Nations 2017g). Although the U.S. is still younger than other developed countries, an ongoing aging of the population is anticipated. By 2050, the median age will increase to 42.0 years and the structure of the population is expected to shift towards a house-like shape in which the younger and middle-aged groups are relatively evenly distributed and the older adults build a pointed roof (see Hayutin et al. 2010; United Nations 2017g, p.10).
In addition, the share of older adults in the total population is projected to increase. In 1950, the majority of the population consisted of young people aged 0 to 24 (42%), and only 12 percent were older adults aged 60+. By 2015, the ratio changed to 33 percent for young (0-24) and 21 percent for older people (60+) and is projected to become more balanced by the mid of the century, reaching a 29 percent and 28 percent ratio, respectively. Figure 2.4 visualizes the development of the population’s age structure in comparison between the years 1950 and 2050.
Like in Germany, the oldest-old population aged 80+ will experience the strongest increase.
While their share on the total population was four percent in 2015, the number is expected to grow 2.5 times, reaching nine percent by 2050 (see United Nations 2017i). The relative population growth of the age groups 65 to 79 and 80+ is highlighted in Figure 2.5.
2.6 Conclusion and Relevance for Older Adult Education
Increased life expectancy has led to a new generation of older adults. Together with the decrease in the number of working-age adults in countries like Germany and the U.S., this development leads inevitably to the question of how the workforce and current retirement systems can be maintained in the future. Utilizing the older generation as a resource on either a paid or volunteer basis could help to counterbalance the increasing shortage of younger people in the labor force. In this regard, second careers after retirement – Freedman (2008) popularized the term “encore career” – will serve an important function. Such careers do not only respond to individual motivations, like the wish for further contribution to the labor force, professional fulfillment, or financial reasons, but also have to be discussed from a resource-oriented and social responsibility standpoint (an in-depth discussion of post-retirement careers and volunteering in old age takes place in Sec. 3.4.4). A general trend of increased paid labor force
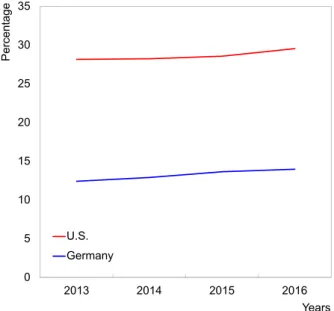
Figure 2.6: Percentage of adults aged 55+ with a college degree in the U.S. and Germany, 2013-2016.
(U.S.: 4+ years of college completed, Germany:
Fachhochschulabschluss and higher; Source: Own calculations; Statistisches Bundesamt 2013; 2014;
2015a; 2017c; United States Census Bureau 2017a)
participation of older adults in Germany and the U.S. is already visible (see Deutscher Bundestag 2013, p.6; Encore.org 2014, p.1). Also, the educational attainment of older adults sees a constant increase in both countries (Fig. 2.6). Between 2013 and 2016, the percentage of adults aged 55+ with a college degree has increased in Germany from 12 percent to 14 percent.
In the U.S., the percentage of older adults who have completed at least four years of college is generally higher than in Germany. Here, the rate grew from 28 percent (2013) to 30 percent (2016). Looking at the population in retirement age (65+) only, about one-fourth (27%) of the 65+-year-olds in the U.S. held a Bachelor’s degree or higher in 2015 (see Ryan/Bauman 2016, p.2). In Germany, 13 percent of the total population aged 65+ held an academic degree in 2017 (Bachelor, Master, Diploma, Doctoral degree), with the majority being men (men: 20%, women: 8%; see Statistisches Bundesamt 2018a, p.40). Due to a constant increase in the educational backgrounds of older adults in both countries since the middle of the last century (see Bundeszentrale für politische Bildung 2014; United States Census Bureau 2017c), further growth in the educational attainment of the elderly can be expected in the future. In this regard, learning in later life gains relevance. As a result, older adults will also likely have higher demands for ongoing learning and high-quality education, which older adult education needs to
0 5 10 15 20 25 30 35
2013 2014 2015 2016
Percentage
Years U.S.
Germany
address. In addition, education in later life also needs to fulfill the vital function to prepare and accompany the older adult for new labor force or volunteering tasks. However, as Klercq (2010, p.24) claims, a vision for the importance of education in old age still needs to be developed in aging societies as well as structured attempts to address the growing educational demands and needs of older adults.
3 Age and Aging
Improvements in public health, hygiene, and health care during the last century have led to increased life expectancy and declining death rates in developed countries, like the U.S. and Germany. As a consequence, the remaining life time after retirement has developed into an independent and expanded life stage. However, a generalization of old age as only one life phase is not adequate as the older population shows a strong heterogeneity in terms of their cognitive and physiological abilities, their overall health status, and living situation. Although aging is a highly heterogenous and individualized process, older adults are often generalized with stereotypes, such as frailness, apathy, social exclusion, and low mobility (see Lehr 1979, p.6). In addition, declining productivity and uselessness are other common ascriptions of the late life stage (see Findsen/Formosa 2011, pp.12f.). These stereotypes are not adequate anymore as older adults nowadays are more active, healthier, (see Baltes/Smith 2003, p.126) better educated than previous generations (see BMFSFJ, pp.169ff.; United States Census Bureau 2017), and also show a growing interest in second careers after retirement (see Deutscher Bundestag 2013, p.6; Encore.org 2014, p.1). In addition, studies suggested that the size of personal social networks remains relatively stable (see van Tilburg 2003, p.355). Considering these trends, society needs to move away from a loss-oriented to a resource-oriented perspective of old age.
This chapter discusses the multi-dimensionality of age, old age, and the idea of multiple age stages. In this regard, the concept of the third and fourth age find particular attention. In addition, the chapter presents selected aging theories as well as definitions, characteristics, and potentials of older and oldest-old age. Also selected physical and psychological changes that accompany the natural aging process are discussed.
3.1 Age Stages
3.1.1 Dimensions of Age
The term age has multiple meanings. It is commonly used to describe the “state of being old” (Oxford Dictionaries 2017). Furthermore, it is also used to classify the age of an individual or the age of a society as a collective of individuals. In both cases, the chronological time passed since the birth of an organism or the beginning of a specific time period is used to express such age (see Laslett 1991, p.24). The following discussion focuses on the age of an individual.
The chronological age is one of the most essential information pieces about an individual in our society (see Schroots/Birren 1988, p.5). Shared with members of the same birth cohort, it is together with skin color or gender one of the most important social categories and serves as a universal distinguishing mark to classify individuals (Wahl/Heyl 2004, p.14; Kade 2009, p.14). For example, the chronological age specifies when children have to enter the school system or when employees may transition into retirement (see Neugarten 1996, p.19). However, this index does not take different personalities, developmental stages, or life and socialization experiences into account. Strong heterogeneity is an especially promoted characteristic of the older population. For instance, Lowsky et al. (2014, p.640) emphasized that some people are in good health in their 90s while others experience severe physical or cognitive impairments much earlier in life. In general, the inter-individual variance – meaning the comparison of one individual with another – increases with age (see Laslett 1991, p.25; Oswald 2000, p.108;
Wahl/Heyl 2004, p.19). As Wahl and Heyl (2004, pp.19f.) discussed, older adults show a larger inter-individual variance than any other age group in regard to, e.g., cognitive abilities, social relationships, and personality features. The authors pointed out that a variety of cognitive tests indicate a general performance decline with increasing age, but that the variance of cognitive abilities between individuals is the highest for the older population (Sec. 3.3). To address these inter-individual differences, various authors (e.g., Birren/Cunningham 1985; Schroots/Birren 1988; Laslett 1991) suggested dividing age into multiple dimensions. The most common ones are discussed in the following.
While the chronological age measures the actual time that has passed since the birth of an individual (see Schroots/Birren 1988, p.5), the biological age describes the developmental stages between birth and death (see Laslett 1991, p.25; Kohli/Kühnemund 2000, p.94). Birren and Cunningham (1985, p.8) understood the biological age as the estimate of “the individual’s present position with respect to his potential life span”, which should allow a more precise prediction of the remaining years than the chronological age (see Schroots/Birren 1988, p.6).