doi: 10.3389/fmars.2020.617324
Edited by:
Paul F. J. Wassmann, Arctic University of Norway, Norway Reviewed by:
Haakon Hop, Norwegian Polar Institute, Norway Ulf Karsten, University of Rostock, Germany
*Correspondence:
Dorte Krause-Jensen dkj@bios.au.dk
Specialty section:
This article was submitted to Global Change and the Future Ocean, a section of the journal Frontiers in Marine Science
Received:14 October 2020 Accepted:30 November 2020 Published:23 December 2020
Citation:
Krause-Jensen D, Archambault P, Assis J, Bartsch I, Bischof K, Filbee-Dexter K, Dunton KH, Maximova O, Ragnarsdóttir SB, Sejr MK, Simakova U, Spiridonov V, Wegeberg S, Winding MHS and Duarte CM (2020) Imprint of Climate Change on Pan-Arctic Marine Vegetation. Front. Mar. Sci. 7:617324.
doi: 10.3389/fmars.2020.617324
Imprint of Climate Change on Pan-Arctic Marine Vegetation
Dorte Krause-Jensen1,2* , Philippe Archambault3, Jorge Assis4, Inka Bartsch5, Kai Bischof6, Karen Filbee-Dexter3,7, Kenneth H. Dunton8, Olga Maximova9,
Sunna Björk Ragnarsdóttir10, Mikael K. Sejr1,2, Uliana Simakova9, Vassily Spiridonov9, Susse Wegeberg1,11, Mie H. S. Winding12and Carlos M. Duarte1,13
1Arctic Research Centre, Aarhus University, Århus, Denmark,2Department of Bioscience, Aarhus University, Silkeborg, Denmark,3ArcticNet, Québec-Océan, Université Laval, Québec, QC, Canada,4Centre of Marine Sciences, University of Algarve, Faro, Portugal,5Alfred-Wegener Institute, Helmholtz Centre for Polar and Marine Research, Bremerhaven, Germany,6Department of Marine Botany, Faculty of Biology/Chemistry and MARUM, University of Bremen, Bremen, Germany,7Institute of Marine Research, His, Norway,8Marine Science Institute, University of Texas at Austin, Port Aransas, TX, United States,9Shirshov Institute of Oceanology, Moscow, Russia,10Icelandic Institute of Natural History, Akureyri, Iceland,11Department of Bioscience, Aarhus University, Roskilde, Denmark,12Greenland Climate Research Centre, Greenland Institute of Natural Resources, Nuuk, Greenland,13Red Sea Research Center, King Abdullah University of Science and Technology, Thuwal, Saudi Arabia
The Arctic climate is changing rapidly. The warming and resultant longer open water periods suggest a potential for expansion of marine vegetation along the vast Arctic coastline. We compiled and reviewed the scattered time series on Arctic marine vegetation and explored trends for macroalgae and eelgrass (Zostera marina). We identified a total of 38 sites, distributed between Arctic coastal regions in Alaska, Canada, Greenland, Iceland, Norway/Svalbard, and Russia, having time series extending into the 21st Century. The majority of these exhibited increase in abundance, productivity or species richness, and/or expansion of geographical distribution limits, several time series showed no significant trend. Only four time series displayed a negative trend, largely due to urchin grazing or increased turbidity.
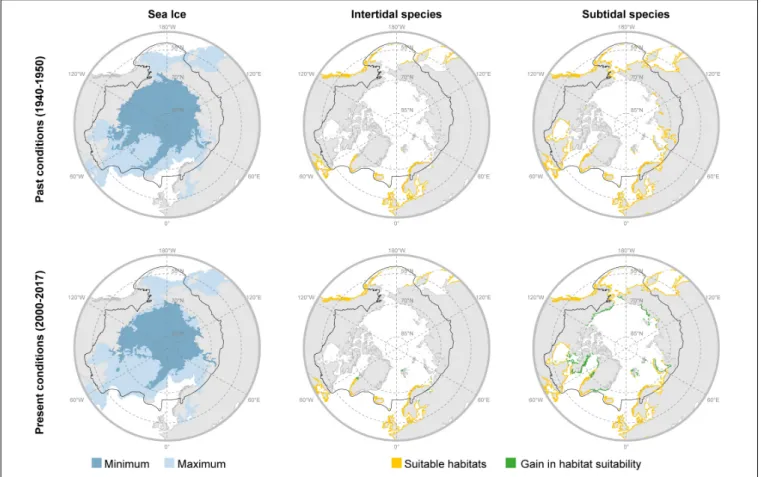
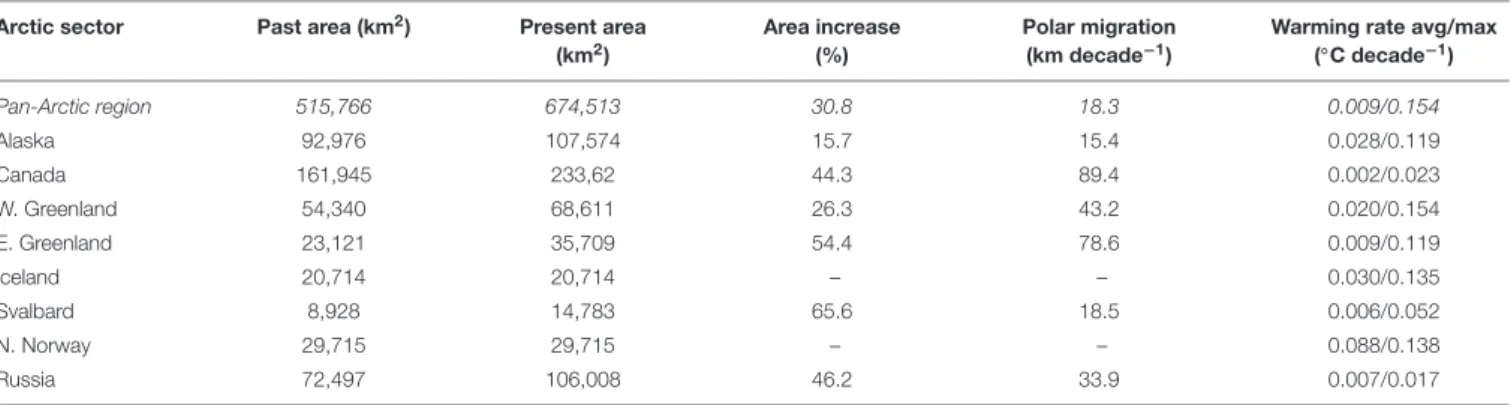
Overall, the observations support with medium confidence (i.e., 5–8 in 10 chance of being correct, adopting the IPCC confidence scale) the prediction that macrophytes are expanding in the Arctic. Species distribution modeling was challenged by limited observations and lack of information on substrate, but suggested a current (2000–
2017) potential pan-Arctic macroalgal distribution area of 820.000 km2 (145.000 km2 intertidal, 675.000 km2 subtidal), representing an increase of about 30% for subtidal- and 6% for intertidal macroalgae since 1940–1950, and associated polar migration rates averaging 18–23 km decade−1. Adjusting the potential macroalgal distribution area by the fraction of shores represented by cliffs halves the estimate (412,634 km2).
Warming and reduced sea ice cover along the Arctic coastlines are expected to stimulate further expansion of marine vegetation from boreal latitudes. The changes likely affect the functioning of coastal Arctic ecosystems because of the vegetation’s roles as habitat, and for carbon and nutrient cycling and storage. We encourage a
pan-Arctic science- and management agenda to incorporate marine vegetation into a coherent understanding of Arctic changes by quantifying distribution and status beyond the scattered studies now available to develop sustainable management strategies for these important ecosystems.
Keywords: distribution, abundance, trends, Arctic, sea-ice, warming, eelgrass (Zostera marina), macroalgae
INTRODUCTION
Rapid warming of the Arctic with associated melting of ice sheets, glaciers, and reduced extent and thickness of sea ice is causing major changes in high latitude coastal ecosystems (Pörtner et al., 2019). While sea-ice associated communities and endemic Arctic species are experiencing losses, benthic marine vegetation may respond positively to warming and loss of sea ice, which potentially allows more light to reach the seafloor (Krause-Jensen and Duarte, 2014;Filbee-Dexter et al., 2019). The Arctic marine vegetation does include some endemic species that depend on the low temperatures currently experienced in the Arctic (Müller et al., 2009;Wulff et al., 2009;Wilce, 2016;Küpper et al., 2016;Bringloe et al., 2020). However, a large component of macroalgae growing in the Arctic have a boreal origin, shaped through cycles of glaciation to unique assemblages in polar waters (Bringloe et al., 2020). Many of these macroalgae as well as eelgrass (Zostera marina), the sole seagrass species occurring in sub-Arctic areas, are characterized by optimum temperatures for growth which are considerably higher than those currently experienced in the Arctic (Müller et al., 2009;Wulff et al., 2009;
Beca-Carretero et al., 2018). Higher temperatures are therefore likely to stimulate the growth of these species (Olesen et al., 2015;
Marbà et al., 2017;Wilson and Lotze, 2019; Franke and Bartsch, unpublished data). However, while the combination of reduced sea-ice cover and warming is expected to stimulate growth of Arctic marine vegetation (Krause-Jensen and Duarte, 2014), sediments delivered with glacier runoff may locally increase water column light attenuation and, thereby, counteract the effect of reduced extent of sea ice on light availability (Bartsch et al., 2016;
Bonsell and Dunton, 2018;Pavlov et al., 2019).
Benthic vegetation (including microalgae) has been estimated to contribute approximately 20% of the total marine primary production in the Arctic (Attard et al., 2016). Marine vegetation supports key ecosystem functions such as providing habitat that promote biodiversity and climate change mitigation and adaptation (Duarte et al., 2013;Smale et al., 2013;Filbee-Dexter et al., 2019), and changes in the distribution of these vegetated habitats will affect the functioning of Arctic marine ecosystems (Paar et al., 2016, 2019a; Marbà et al., 2018). Given the vast extension of Arctic permafrost coastline (34% of the global coastline), with 20% of the Arctic shelf areas being shallower than 20 m (Lantuit et al., 2012), changes in marine vegetation in this region should also be significant in a global context.
While there are clear global imprints of climate change on marine vegetation, with several reports on warming as a stressor at the equatorial edge of distribution (Raybaud et al., 2013; Filbee-Dexter et al., 2016; Wernberg et al., 2016), documentation is sparse for polar regions. A decade
ago, a review of trends identified multiple responses of Arctic marine biota to climate change (Wassmann et al., 2011), but no reports for Arctic marine vegetation were available. Likewise, a review in 2013 of global imprint of climate change on marine life included no studies reporting realized responses of Arctic marine vegetation (Poloczanska et al., 2013), which are also lacking from the recent special IPCC Oceans and the Cryosphere report (Pörtner et al., 2019). In the interim, the focus on Arctic marine vegetation has intensified both in terms of research, monitoring effort, and assessment status of Arctic kelp forests (Filbee-Dexter et al., 2019). Several Arctic research programs address marine vegetation and while the Circumpolar Biodiversity Monitoring Program (CMBP) does not yet include a marine vegetation component, efforts to assess changes in marine vegetation are ongoing in Alaska, Arctic Canada (i.e., ArcticNet-ArcticKelp project, Hudson Bay coastal habitat research project (seagrass), Greenland (i.e., Greenland Ecosystem Monitoring1), Iceland, Svalbard Islands (Bartsch et al., 2016), and Arctic Russia (assessment of macrophytobenthos within the Arctic Centre program of preparation of ecological atlases of Russian Arctic seas, i.e., Maximova, 2016, 2017b). Thus, there is a need to compile available information on trends in marine vegetation across the Arctic.
The status of marine vegetation can be characterized through a variety of metrics that include species composition and diversity, distribution area, depth extent, abundance, productivity, nutrient content (e.g.,Marbà et al., 2013), and phenology (e.g.,Clausen et al., 2014; Blok et al., 2018). Trends can be assessed as site- specific changes over time in such parameters, and if information is available along a latitudinal gradient, changes in species occurrence can also be used to derive poleward migration rates (Poloczanska et al., 2013).
Here, we review, compile, and synthesize available time series on Arctic marine vegetation in relation to climate change with the aim of providing an overview of trends in distribution, abundance, and performance of intertidal and subtidal macroalgae and eelgrass in the Arctic. The focus is Pan-Arctic, encompassing all major coastal Arctic regions (Alaska, Canada, Greenland, Iceland, Norway/Svalbard, Russia). We supplement by modeling past (1940–1950) and current (2000–2017) potential distribution areas and associated distributional shifts of macroalgae in the region. We hypothesize that Arctic marine vegetation is exhibiting rapid change in response to warming and melting of the cryosphere in terms of polar expansion of distribution limits and changed
1https://g-e-m.dk
local distribution, community composition, process rates, and associated ecosystem functions.
MATERIALS AND METHODS Data Compilation and Analysis
We searched the literature to generate an overview of available trends on Arctic marine vegetation. We looked for studies reporting trends in macroalgae or seagrasses (eelgrass, Zostera marina) from the Arctic region as defined by the Arctic Council (Huntington, 2001), including Arctic Canada, Alaska, Greenland, Iceland, Norway/Svalbard, and Russia (Figure 1). Our major objective focused on locating time- series observations at a given site/area encompassing at least a 10-year span, which could be represented at a minimum by initial and final observations, although three or more data points over time provide more robust assessments. If a time series contained various sub-periods and trends, a trend was reported for each sub-period that fulfilled the above criteria. We also searched for the records (location, time) of species reported further north than the previous northernmost observation and potentially allowed estimating the migration rate (km yr−1) of the leading, poleward, biogeographical range (Poloczanska et al., 2013).
We searched the web of Science (accessed 30 June 2019) using the search string: “[(“marine vegetation” or macroalga∗ or seaweed or kelp or seagrass or Zostera) and (Arctic or subarctic or polar) and (change or trend) and (Russia or Canada or Alaska or Greenland or Svalbard or Norway or Iceland)].”
This rendered 84 hits, of which only 13 publications contained relevant information on time series of Arctic marine vegetation, while the remainder represented laboratory studies, referred to other organism groups or contained information on marine vegetation other than data on trends. Additional studies from Arctic regions, whether published or unpublished, were also compiled to yield a total of 39 Arctic sites (some of these including sub sites) with information on time series in one or more vegetation parameters (Figure 1andTable 1).
For each time series, we noted location, tidal zone (intertidal or subtidal), vegetation type (macroalgae or eelgrass; species if relevant), metric/parameter (e.g., number of species, depth limit, biomass), direction of change [increase (I), decline (D), no change (N), polar migration (P), migration toward deglaciated sites (G)], whether climate drivers were identified [longer open water period (O), increased turbidity (T), reduced ice scouring (S), warming (W), not determined (nd)], and whether other potential drivers were specified [increase(i)/release(r) of eutrophication/pollution (Ei,r), harvesting pressure (H), sea urchin grazing (Ui,r), disease (Dr), and new volcanic habitats (V)]. An overview of trends was compiled for each region. Additional information and synthesis is provided in the Supplementary Information (SI) for Greenland (Supplementary Information I), Iceland (Supplementary Information II), Svalbard (SI-III), and Russia (Supplementary Information IV).
Modeling of Past and Current Potential Pan-Arctic Distribution Area of
Macroalgae
Species distribution models (SDM), also known as habitat suitability models, bioclimatic envelope models, or ecological niche models (for review and definition see, e.g., Peterson et al., 2011) were used to estimate recent distributional shifts of Arctic marine macroalgae. These methods identify and describe correlation patterns between species occurrences and environmental data, and provide useful ecological understanding of large-scale biogeographic patterns by predicting regions of habitat suitability where it is likely for species to occur (Dormann et al., 2012). Among the numerous algorithms available (Peterson et al., 2011) we chose Boosted Regression Trees (BRT) and Adaptive Boosting (AdaBoost), two machine learning approaches that systematically retrieve high predictive performances (Elith et al., 2008; Assis et al., 2017) by fitting complex interactions between predictors and non-linear relationships, while avoiding overfitting through monotonic responses and optimal parametrization (Elith et al., 2008;
Hofner et al., 2011).
To estimate recent distributional shifts of Arctic marine macroalgae, SDM were developed with the machine learning algorithms Boosted Regression Tress (BRT) and Adaptive Boosting (AdaBoost) fitting environmental predictors against distribution records (see Supplementary Information V).
These algorithms were chosen because they fit complex interactions between predictors and non-linear relationships, while avoiding overfitting through monotonic responses and optimal parametrization (Elith et al., 2008;Hofner et al., 2011).
Biologically meaningful environmental predictors for macroalgae were extracted from Bio-ORACLE V2.1 (Assis et al., 2017); surface predictors for intertidal species and benthic predictors (i.e., along bottom) for subtidal species. Predictors were selected to reflect factors affecting the physiology of species (ocean temperature and salinity), disturbance (sea ice cover), and essential resources (nutrients as nitrate). These data were derived from the Global Ocean Biogeochemistry Non-assimilative Hindcast and the Global Ocean Physics Reanalysis of the European Centre for Medium-Range Weather Forecasts. To model subtidal species, predictors were clipped down to 30 m depth (the typical depth distribution of macroalgae), while for intertidal species, predictors were clipped with a continuous gridded mask delimiting global coastlines (e.g.,Assis et al., 2017).
Records of brown macroalgae presence were compiled from the fine-tuned dataset of marine forests (Assis et al., 2020) for the Arctic marine realm (Spalding et al., 2007), as well as the temperate Northern Atlantic and Pacific realms, from which species might potentially shift poleward. For modeling purposes, the same amount of pseudo-absences as presences were randomly generated in cells where no presences were recorded (Barbet-Massin et al., 2012). To reduce the potential effect of spatial autocorrelation in the models, the spatial variability of predictors was tested as a function of distance.
In this approach, a correlogram was built for intertidal and subtidal species to pinpoint the minimum significant correlated
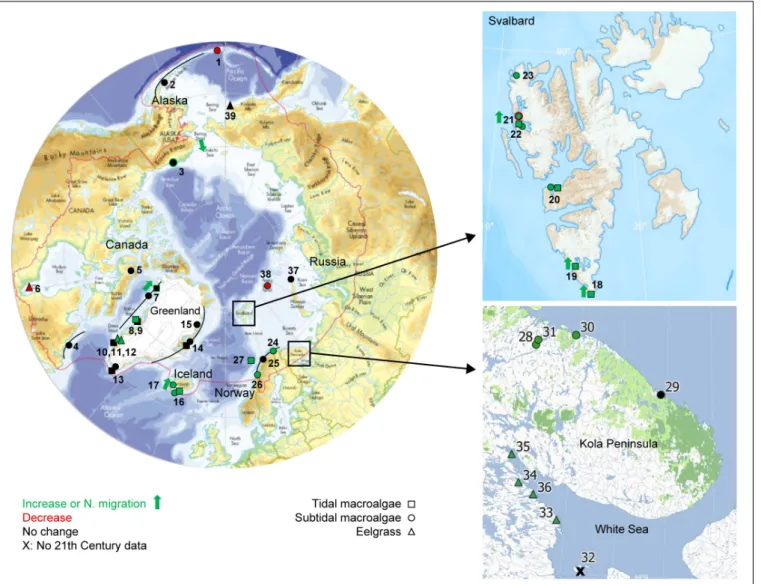
FIGURE 1 |Overview of compiled studies on pan-Arctic marine vegetation trends spanning at least 10 years and entering into the 21th Century. Trends are marked as increasing (green), declining (red) or no change (black) for subtidal macroalgae (circles), intertidal macroalgae (squares), and eelgrass (triangles). Northward migration is indicated by green arrow. If the site represents trends for more than one period, only the most recent is shown, and if this did not include the 21th Century, the site is marked by X. A line through a circle/square indicates that there are several sites along a gradient. The red line defines the Arctic region based on the Arctic Council definition (Huntington, 2001). Numbers refer to sites specified inTable 1. Close-up of study sites in Svalbard and Russian Barents Sea/White Sea.
Main map fromHuntington, 2001, Svalbard map from Norwegian Polar Institute.
distances of predictors. These were used to prune the records of both datasets, by randomly choosing one record of occurrence from a pool of records found within such distances (e.g., Boavida et al., 2016).
A cross-validation framework using sixfold independent latitudinal bands (e.g., Assis et al., 2017) was implemented to tune the models by testing distinct parameter combinations of tree complexity (1–6), number of trees (50–1000, step 50), and learning rate (0.01, 0.005, and 0.001) for BRT, shrinkage (0.25–1, step 0.25), degrees of freedom (1–12), and number of interactions (50–250, step 50) for AdaBoost. Cross-validation also allowed assessing the performance and transferability of models with the area under the curve (AUC) and sensitivity (true positive rate;
Allouche et al., 2006). Models were forced to produce positive monotonic responses while fitting nitrate, salinity, minimum
temperature, cloud cover, and negative responses while fitting maximum temperature and ice thickness (Hofner et al., 2011;
Assis et al., 2017;Gouvêa et al., 2020).
Distribution maps were developed by ensembling (mean function;Araújo and New, 2007) the outputs of both BRT and AdaBoost models using the optimal parameters. Maps were then reclassified to binomial responses - reflecting presence and absences – using a threshold maximizing the sum of specificity (true negative rate) and sensitivity (Jiménez-Valverde and Lobo, 2007; Assis et al., 2017). Range shifts were estimated, based on the change in potential distribution area of the intertidal and subtidal vegetation by comparing the past (period 1940–
1950) and present (period 2000–2017) potential distributions.
Because we lack data on benthic substrate composition (i.e., discrimination between rocky and sedimentary coastlines), the
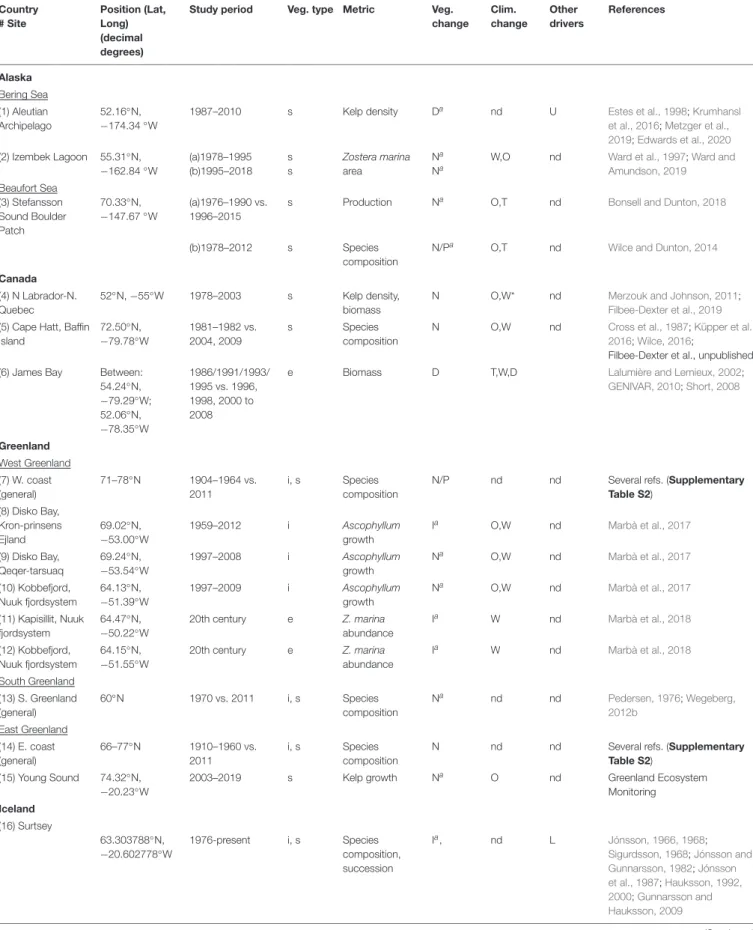
TABLE 1 |Overview of compiled timeseries for pan-Arctic marine vegetation spanning at least 10 years.
Country
# Site
Position (Lat, Long) (decimal degrees)
Study period Veg. type Metric Veg.
change Clim.
change Other drivers
References
Alaska Bering Sea (1) Aleutian Archipelago
52.16◦N,
−174.34◦W
1987–2010 s Kelp density Da nd U Estes et al., 1998;Krumhansl
et al., 2016;Metzger et al., 2019;Edwards et al., 2020 (2) Izembek Lagoon 55.31◦N,
−162.84◦W
(a)1978–1995 (b)1995–2018
s s
Zostera marina area
Na Na
W,O nd Ward et al., 1997;Ward and Amundson, 2019 Beaufort Sea
(3) Stefansson Sound Boulder Patch
70.33◦N,
−147.67◦W
(a)1976–1990 vs.
1996–2015
s Production Na O,T nd Bonsell and Dunton, 2018
(b)1978–2012 s Species
composition
N/Pa O,T nd Wilce and Dunton, 2014
Canada (4) N Labrador-N.
Quebec
52◦N,−55◦W 1978–2003 s Kelp density, biomass
N O,W* nd Merzouk and Johnson, 2011;
Filbee-Dexter et al., 2019 (5) Cape Hatt, Baffin
Island
72.50◦N,
−79.78◦W
1981–1982 vs.
2004, 2009
s Species
composition
N O,W nd Cross et al., 1987;Küpper et al.,
2016;Wilce, 2016;
Filbee-Dexter et al., unpublished (6) James Bay Between:
54.24◦N,
−79.29◦W;
52.06◦N,
−78.35◦W
1986/1991/1993/
1995 vs. 1996, 1998, 2000 to 2008
e Biomass D T,W,D Lalumière and Lemieux, 2002;
GENIVAR, 2010;Short, 2008
Greenland West Greenland (7) W. coast (general)
71–78◦N 1904–1964 vs.
2011
i, s Species composition
N/P nd nd Several refs. (Supplementary
Table S2) (8) Disko Bay,
Kron-prinsens Ejland
69.02◦N,
−53.00◦W
1959–2012 i Ascophyllum
growth
Ia O,W nd Marbà et al., 2017
(9) Disko Bay, Qeqer-tarsuaq
69.24◦N,
−53.54◦W
1997–2008 i Ascophyllum
growth
Na O,W nd Marbà et al., 2017
(10) Kobbefjord, Nuuk fjordsystem
64.13◦N,
−51.39◦W
1997–2009 i Ascophyllum
growth
Na O,W nd Marbà et al., 2017
(11) Kapisillit, Nuuk fjordsystem
64.47◦N,
−50.22◦W
20th century e Z. marina
abundance
Ia W nd Marbà et al., 2018
(12) Kobbefjord, Nuuk fjordsystem
64.15◦N,
−51.55◦W
20th century e Z. marina
abundance
Ia W nd Marbà et al., 2018
South Greenland (13) S. Greenland (general)
60◦N 1970 vs. 2011 i, s Species
composition
Na nd nd Pedersen, 1976;Wegeberg,
2012b East Greenland
(14) E. coast (general)
66–77◦N 1910–1960 vs.
2011
i, s Species composition
N nd nd Several refs. (Supplementary
Table S2) (15) Young Sound 74.32◦N,
−20.23◦W
2003–2019 s Kelp growth Na O nd Greenland Ecosystem
Monitoring Iceland
(16) Surtsey
63.303788◦N,
−20.602778◦W
1976-present i, s Species
composition, succession
Ia, nd L Jónsson, 1966, 1968;
Sigurdsson, 1968;Jónsson and Gunnarsson, 1982;Jónsson et al., 1987;Hauksson, 1992, 2000;Gunnarsson and Hauksson, 2009
(Continued)
TABLE 1 |Continued
Country
# Site
Position (Lat, Long) (decimal degrees)
Study period Veg.
type
Metric Veg.
change
Clim.
change Other drivers
References
(17) Hvalfjörður and southwest coast
64.047771◦N,
−22.062938◦W
1903 vs. 1998/2014 s N. migration/expansion ofFucus serratus
Pa nd nd Jónsson, 1903;
Thorarinsdottir et al., 2014;
IINH database, unpublished data
Svalbard (18) S. Spitsbergen, Sörkapp
App.:
76.48◦N, 16.56◦E
1988 vs. 2007–2008 i Composition/richness, biomass, cover, depth range, distribution, size ofFucusfronds
Ia(all variables), Ga
W,S nd Weslawski et al., 2010
(19) S. Spitsbergen, Hornsund
App. mean:
78◦N, 15.5◦E
1988 vs. 2007–2008 i Composition/richness, biomass, cover, depth range, distribution, size ofFucusfronds
Ia, Pa W,S nd Weslawski et al., 2010
(20) W. Spitsbergen, outer Isfjorden
78.2◦N, 14◦E 1954–1955 vs. 2007 i, s Composition/richness Ia W nd Fredriksen and Kile, 2012
(21) Kongsfjorden, Hansneset
78.99◦N, 1.95
◦E
1996, 1998 vs.
2012–2014
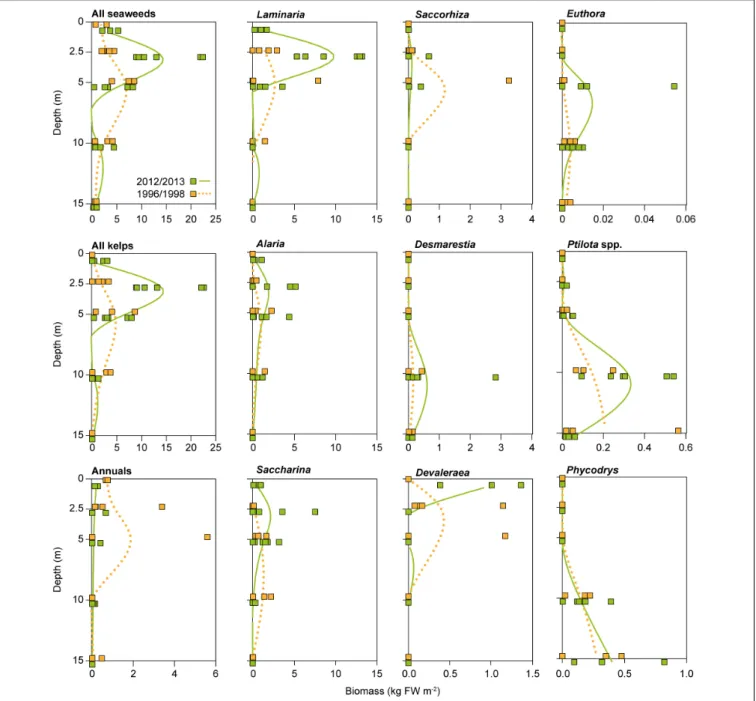
s Composition/ richness, biomass,
depth range
Ia
(composition, biomass) Da(depth range)
O,W,S, T
nd Bartsch et al., 2016;Paar et al., 2016
1996, 1998 vs.
2012–2014
i Composition/richness I O,W, S nd Fredriksen et al., 2014
(22) W. Spitsbergen, Kongsfjorden
78.9◦N, 11.9◦E 1980s-current s Composition, cover Ia O, W nd Beuchel et al., 2006;
Beuchel and Gulliksen, 2008;Kortsch et al., 2012 (23) W. Spitsbergen,
Smeerenburgfjorden
79.6◦N, 11.1◦E 1980s-current s Composition, cover Ia O, W nd Beuchel et al., 2006;
Beuchel and Gulliksen, 2008;Kortsch et al., 2012 Norway
(24) N. Norway coast (vast areas)
70◦N (a)1970–1980s
(b)1980–
2000s/2010s
s s
Kelp cover Kelp cover
Da
Ia W
Ui
Ur
Norderhaug and Christie, 2009
Christie et al., 2019
(25) N. Norway coast (vast areas)
65–69◦N (a)1970–1980s (b)1980–
2000s/2010s
s s
Kelp cover Kelp cover
Da
Na W
Ui
U
Norderhaug and Christie, 2009
Christie et al., 2019
(26) Mid-Norway coast (vast areas)
63.30-
>65.5◦N
(a)1970–1980s (b)1980s-2007
s s
Kelp cover Kelp cover
Da
Ia W
Ui
Ur
Norderhaug and Christie, 2009
Christie et al., 2019
(27) Lofoten 67.835◦N, 12.820◦E
1997–2009 i Ascophyllumgrowth Na W nd Marbà et al., 2017
RussiaThe southern Barents Sea (28) Kola Bay (1) 69.00◦N,
33.00◦E; (2) 69.08◦N, 33.60◦E;
(3) 69.12◦N, 33.57◦E
(a) 1909–1910 vs.
1999
s Species richness, Kelp depth limit
Da nd Ei Zinova, 1912, 1914;
Zavalko and Shoshina, 2008
(b) 1999 vs. 2009 s Species richness, Kelp depth limit
Ia W Er Zavalko and Shoshina,
2008;Malavenda and Malavenda, 2012 (29) Guba
Ivanovskaya
8.30◦N, 38.65◦E
1960s vs. 2011 s Species composition, Distribution
Na W nd Blinova, 1964;Malavenda
and Metelsky, 2013 (Continued)
TABLE 1 |Continued
Country
# Site
Position (Lat, Long) (decimal degrees)
Study period Veg. type Metric Veg.
change Clim.
change Other drivers
References
(30) Guba Zelenaya 69.21◦N, 34.78◦E
1973 vs. 2015 s Species composition Kelp depth limit
Ia W Ur Pogrebov et al., 1975;Propp
et al., 1975;Deart et al., 2017 (31) Kola Peninsula
coast
Coastline between:
69.40◦N, 33.50◦E;
69.05◦N, 36.10◦E
1960–1990 vs.
2009–2017
s Laminaria hyperborea, Ulva lactuca
P W nd Mikhaylova, 2010, 2012;
Malavenda et al., 2018
White Sea (32) White Sea (general)
The sea within:
66.70◦N, 33.90◦E;
66.50◦N, 33.63◦E;
66.50◦N, 38.50◦E;
64.00◦N, 38.00◦E
(a) 1940–1980s (b) 1980–1990s
s Harvestable biomass Harvestable biomass, cover
Da Da
nd nd
H H
Gemp, 1962;Mikhaylova, 2000;Pronina and Repina, 2005;Blinova, 2007;
Shoshina, 2012
(33) White Sea (general)
The sea within:
66.70◦N, 33.90◦E;
66.50◦N, 33.63◦E;
66.50◦N, 38.50◦E;
64.00◦N, 38.00
◦E
(a) 1960–1970s (b) 1970–2000s
e Eelgrass distribution/
abundance
Da Ia
nd D Vekhov, 1992;Maximova,
2017a
(34) Karelian coast White Sea coast between:
69.75◦N, 32.00◦E;
65.75◦N, 35.00◦E
Pre 1960 vs. late 2000s/2010s
e Eelgrass
distribution/abundance
Ia(except one site:
Babie More)
W Dr Bukina et al., 2010;Simakova, 2016;Simakova et al., 2016;
Maximova, 2017a
(35) Ryazhkov I 67.02◦N, 32.55◦E
1973–2009 e Eelgrass cover Ia W Dr Shklyarevich, 2014
(36) S.E.
Kandalaksha Bay
(1) 66.35◦N, 33.60◦E (2) 66.34◦N, 33.62◦E
1987–2019 e Eelgrass biomass Ia W nd Savchenko and Naumov,
2020
High Arctic archipelagoes –Novaya Zemlya (37) Ledianaya
Gavan
76.29◦N, 68.28◦E
1870s vs. 2000s s Species composition Na nd nd Kjellman, 1883b;Shtrik et al., 2000;Shoshina and Anisimova, 2013 High Arctic archipelagos – Franz Josef Land
(38) Tikhaya Bay, Hooker Island
80.34◦N, 52.78◦E
1991 vs. 2013 s Kelp distribution Da T nd Averintsev, 1992;Averintseva,
1994;Gagaev et al., 2019 Bering Strait and the northwestern Bering Sea
(39) Anadyr Liman 64.75◦N,
−177.63◦W
1970s vs. 2011/15 e Eelgrass presence N nd nd Simakova et al., 2016
Timeseries are numbered (1–39) with indication of geographic position, study period [separate time series representing the same location are indicated by (a) and (b);
where the study period involves a baseline versus (vs.) a later period, this is indicated], vegetation type [“Veg. type,” i.e., intertidal macroalgae (i), subtidal macroalgae (s), eelgrass (e)], and metric (density, biomass, composition etc.). For each timeseries, the direction of vegetation change (“Veg. change”) is reported as either “No change (N),” ”Decline (D),” ”Increase (I),” ”Polar migration (P),” or ”Migration toward deglaciated sites (G).” Cases of combined N and P or G indicate that despite observations of migration, there is no major change in composition.
aIndicates that the assessment of veg. change is based on formal analysis/statistical assessment of repetitive studies in similar sites/regions with largely comparable information. Information on climate change (Clim. change) as potential driver of veg. change is reported as “Longer open water period (O),” “increased turbidity (T),” “Reduced ice scouring (S),” “Warming (W),” or “not determined (nd).” Reports of other potential drivers of veg. change are listed as increase(i)/release(r) of
“eutrophication/pollution (Ei,r),” “harvesting pressure (H),” “sea urchin grazing (Ui,r),” “disease (Dr),” or “arrival of new volcanic land (L).” References of observed veg.
change are given. Trends entering the 21th Century are mapped inFigure 1.
distribution maps reflect suitable habitats based on climate- and seawater conditions alone, and may therefore overestimate potential distribution areas.
RESULTS
Changes in Benthic Vegetation in Alaska (United States)
Arctic macroalgal habitats in Alaska have been studied for decades and three time-series exist between the cold temperate Aleutian Islands in the southern Bering Sea and the High Arctic Beaufort Sea (Figure 1). All time-series data relate to shallow subtidal eelgrass and macroalgal stands at depths less than 15 m (Table 1). Intertidal macroalgae are very abundant in the Aleutians, but the Beaufort Sea coast is devoid of intertidal algae because of ice scour. Overall, patterns in the abundance of subtidal marine vegetation are not correlated with regional climatic change with respect to temperature or ice extent, although there is some indication of northward migration of subarctic or boreal species.
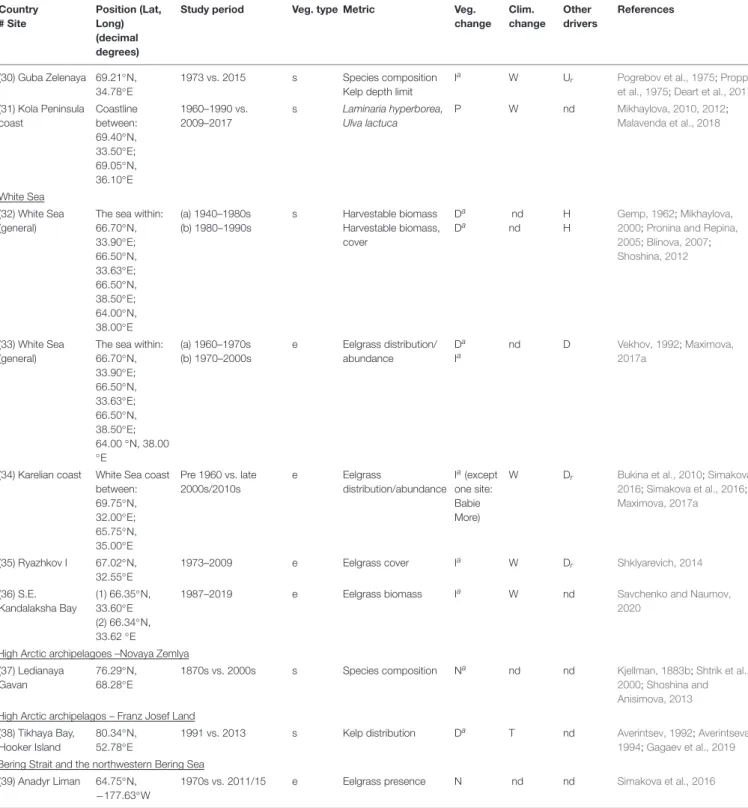
A recent review of trends in kelp abundance include a long- term (>10 years) record of kelp abundance in the Aleutian Archipelago (Table 1, Site 1) that was included in Krumhansl et al.’s (2016) global change analysis of kelp abundance. The Aleutian Islands in Alaska have quantitative records of kelp abundance from the 1980s to 2016 and anecdotal records of high kelp abundance starting in the 1970s (Estes et al., 1998;
Metzger et al., 2019). In this chain of islands, Adak Island has the most extensive and the longest time series of data (from 1987 to 2010) and shows a loss of kelp in the 1990s (Krumhansl et al., 2016; seeFigures 1, 2). This was attributed to declining sea otter populations during this period, which triggered a dramatic increase in sea urchins that destructively grazed kelp forests creating barrens along the archipelago between the islands of Amchitka (179◦E) and Adak (176◦W) (Estes et al., 2004). Although sea otter abundances throughout the Aleutian Archipelago remain low and many kelp forests have not recovered, small patches of isolated kelp forests still persist over 800 km (from 173◦E to 171◦W) in shallow waters and on pinnacles around some of the islands (Konar et al., 2014). This suggests that top down control of sea urchins has been more important in driving kelp abundance compared to climate change.
Izembek Lagoon (Site 2) in the northeast Aleutian Islands, possess the largest eelgrass meadow along the Pacific Coast of North America, which covers about half the lagoon (15,000–
16,000 ha) that has had stable area distribution over a 17-year study period from 1978 to 1995 (Ward et al., 1997). Trends from 2007 to 2018 are also reported as stable (Ward and Amundson, 2019) (Table 1andFigure 1, Site 2). Overall, the lower Alaska Peninsula has 31,000 ha eelgrass (Hogrefe et al., 2014). Coastal Alaska represents both the northern- and western-most limits of Z. marina in the Northeast Pacific region and is also of phytogeographic interest because the meadows occur along the southern margin of what was once the Bering Land Bridge (Talbot et al., 2016). Increasing water temperature and decreased ice
FIGURE 2 |Time series of kelp density (Mean±SD) in Aleutian Islands, Alaska:(A)Adak Island 1987–2009 (the most data-rich site, –176.6◦W),(B) various sites in Aleutian Islands in 1994 and late 2000s. Data sourced from NCEAS dataset (Krumhansl et al., 2016).
cover since 1943 (Petrich et al., 2014) suggest the potential for future expansion of the meadows.
Over 800 km north of the Bering Strait at the confluence of the northern Chukchi and western Beaufort Sea near Barrow (now Utqia˙gvik, Alaska), qualitative beach collecting efforts between 1992 and 1997 documented liveSaccharina latissima andLaminaria solidungulaattached to mussels and cobbles after storm events (Feder et al., 2003). This occurred in an area where brown algae are not common although a kelp forest is well documented 60 km south of the area, in Peard Bay (Mohr et al., 1957).Feder et al. (2003)were not able to associate this change with warming and/or Arctic range extension, although genetic assessments of the mussels suggest they moved from the Bering Strait into the Chukchi Sea.
In the Beaufort Sea’s ‘Boulder Patch’ (Site 3), long-term records of kelp forest productivity exist forLaminaria solidungulaat 10 sites during two periods: from 1976 to 1990 and from 1996 to 2015 (Bonsell and Dunton, 2018) (Figure 1and Table 1, Site 3a). The ice-free season in this area increased by 17 days since 1979, leading the researchers to hypothesize that less sea ice would translate to more light reaching the seafloor and increased benthic macroalgal productivity. Yet, the time series data set
shows there was no significant change in annual productivity over the entire 40-year time period.Bonsell and Dunton (2018)found no evidence that earlier ice break-up or a longer summer ice- free period resulted in an increase in kelp production. This lack of change was attributed to increased turbidity from winds and coastal run-off due to the extended period of open water and increased fetch from sea ice loss. Lower water clarity buffered any positive effects of reduced sea ice, greatly attenuating the amount of light reaching the seabed (Bonsell and Dunton, 2018).
This data set is particularly comprehensive and is unique for the entire Arctic.
Wilce and Dunton (2014)described the benthic algal species composition of the Boulder Patch based on collections made between 1978 and 2012 (Figure 1andTable 1, Site 3b). They state that, despite evident climate warming and sea ice loss,
“by [2012], the impact of these changing physical environments on the composition of the Boulder Patch algal community had not yet become apparent.” Certainly, the relative isolation of the Boulder Patch from sources of immigrants from both the North Pacific (via the Chukchi Sea) and the North Atlantic (via the Canadian Archipelago) provides a long-term refugia for the established fauna and flora.Wilce and Dunton (2014)only reported four subarctic or boreal species that invaded the Boulder Patch community, two red algae and two green algae, but that no substantial change in the algal community had taken place.
Kelp abundance data from the Stefansson Boulder Patch (Krumhansl et al., 2016) includes a 5-year time series (2003–
2007) of kelp biomass at multiple dive sites. Although this dataset does not meet the 10-year required time span, the documented average biomass level of 66.3 (±117 SD) g dw m−2also showed no significant change over the 5-year period.
Changes in Benthic Vegetation in Arctic Canada
Macroalgae form dominant habitats along Canada’s extensive Arctic coastline and are found in areas that have experienced sea ice retreat of 2–15 km yr−1and rapidly rising sea temperature (0.35◦C±0.20 per decade) over the period 1986–2016 (Filbee- Dexter et al., 2019). Benthic marine algae of the Canadian Arctic have been studied intermittently since the early 19th century, yet early reports consisted mainly of little more than species lists (Lee, 1980) or single observation studies. Time series data allowing analysis of trends in distribution, community composition, and abundance are rare. One exception is a compilation of kelp data for northern Labrador and northern Quebec between 1978 and 2003, which show a distinct division between Arctic kelp communities and more temperate assemblages (Merzouk and Johnson, 2011). While there was no significant change over the period, the analysis was limited by relatively few data points distributed across multiple species, sites, depths, and regions (Merzouk and Johnson, 2011; Table 1 and Figure 1, Site 4). In general, marine Canadian Arctic ecologists are likely confronting the shifting baselines problem (Knowlton and Jackson, 2008), when the lack of baseline data sets prior to the onset of major environmental change renders change- detection difficult.
Further north in the Canadian Archipelago, algae diversity records from diving research at Cape Hatt, Baffin Island span 25 years (Cross et al., 1987; Küpper et al., 2016; Wilce, 2016).
From 1981, 1982, 2004, and 2009, a total of 73 benthic algal species have been recorded. Of this total, 13 species were recorded in 1981/1982 that were not observed in 2004 and 2009, and 5 more species, including some of temperate origin, observed in 2009 were not found in 1982 (Table 1 and Figure 1, Site 5).
Misidentifications and new techniques could potentially explain the different species lists between these periods, but the reduced diversity comes despite more advanced genomic techniques and assessment capability in 2009. In the same region in 2019, similar zonation patterns and communities of benthic algae were found compared to 1981 and 1982, although lack of historic biomass data for species prevents detection of changes in biomass and relative composition (K. Filbee-Dexter, personal observations and unpublished data). Interestingly there were no sea urchins recorded in 1982 at Cape Hatt and sea urchins were abundant in 2009 (Cross et al., 1987;Küpper et al., 2016), and 2019 (Filbee- Dexter et al., unpublished data), which could suggest increased abundances of these species.
Recent surveys from across 2500 km of the eastern Canadian Arctic show that the current macroalgal biomass and species composition are strongly related to sea ice cover, with larger macroalgal biomass and taller forests of Laminariales occurring in areas with longer open water periods (K. Filbee-Dexter et al., unpublished). This suggests loss of sea ice in the future could lead to increased benthic vegetation.
Eelgrass beds (Zostera marina) are not well documented in the Canadian Arctic, however, eelgrass is known to occur sporadically around the coast of Hudson Bay (Curtis, 1975).
In James Bay, dense and extensive eelgrass beds have been documented since the 1970s (Curtis, 1975). During a 5-year survey of eelgrass (1986–1991) along the coast of James Bay in the Grande river area, Lalumière et al. (1994) observed large variations, both in density and biomass of eelgrass, with depth, season, and from year to year. Natural variability in climatic conditions appear to be responsible for these variations. However, from 1975 and 2013 there was a 75% loss of eelgrass along the east James Bay coast (Cree Traditional Knowledge,Consortium Genivar-Waska, 2017; Figure 1, Site 6). This decline was first reported by the Cree Nation from their observations while hunting and fishing. Since 1996, there has been less eelgrass habitat in James Bay, and the eelgrass health has declined (Lalumière and Lemieux, 2002). In 1998, a sudden, large-scale decline of eelgrass occurred along the entire east coast of James Bay and Hudson Bay. The decline was thought to be caused by a microorganism bloom stimulated by abnormally high spring temperatures, changes on the coast due to isostatic rebound, and other changes related to global warming (Lalumière and Lemieux, 2002). Furthermore, an altered growth and survival rate due to a decrease in salinity of James Bay waters was observed as a result of more frequent and larger freshwater discharges from the La Grande River (Short, 2008). Eelgrass in some places are sparse, but in other areas it has disappeared altogether. Some eelgrass remains healthy, but much of the eelgrass habitat in James Bay is impacted to some degree by low salinity waters,
overgrowth of seaweeds, epiphytes, and by reduced water clarity (Short, 2019).
Changes in Benthic Vegetation in Greenland
Investigations of the diversity of intertidal and nearshore macroalgal communities in Greenland are sparse and sporadic since observations began in the late 19th Century (Rosenvinge, 1893, 1898). Nevertheless, the studies document that macroalgae occur from the southern tip at 60◦N to 82◦N (Supplementary Table S1), and that kelps tend to grow deeper and faster toward the south where the open water period is longest (Krause-Jensen et al., 2012).
Information on macroalgal biodiversity from the original surveys (Supplementary Table S1) are compiled in a series of reports (Wegeberg, 2011, 2012a,b, 2013) and in a book that also reports new records (Pedersen, 2011). On basis of the surveys, we assessed potential changes in distribution of species in W. and E. Greenland from the first half of the 20th century (incl. Lund, 1959a,b; Wilce, 1964) to recent, a time gap of
>50 years. We also assessed changes at Cape Farewell, a potential port for introduction of new species at the southern tip of Greenland over a 40-year period based on Pedersen’s (1976) survey in 1970 and a comparable (involving the same principal taxonomist Dr. Poul Møller Pedersen), but less intense survey in 2011 (Supplementary Table S1). As very few focused and systematic floristic surveys have been performed along the coasts of Greenland, only very prominent changes in common and characteristic macroalgal species can be detected. In addition to the floristic surveys, we included available time series for other metrics, such as growth parameters included in the Greenland Ecosystem Monitoring program (GEM, see footnote 1), which covers three regions (Nuuk in SW, Disko Bay in mid-W, Young Sound in NE).
Greenland’s West Coast
For Greenland’s west coast, the floristic investigation in North Star Bay (78◦N) in 2011 (designed to assess potential impacts from the Thule Airbase; Wegeberg, 2011) reported a suite of species (23) that had not been reported at such high latitudes in the past (Andersen et al., 2005; Table 1 and Figure 1, Site 7). This may not necessarily reflect change, as the area had not been thoroughly investigated before the 2011-survey (Andersen et al., 2005). This first High Arctic survey documented Fucus vesiculosus among the 23 species which also included mostly filamentous species of Rhodophyta and Phaeophyceae.
Since a conspicuous species as Fucus vesiculosus is expected to have been detected in less thorough earlier surveys, but was not, we propose that the finding of F. vesiculosus at North Star Bay in 2011 likely represents an expansion of the northern distribution from 73◦N to 76◦N since 1970, within 40 years (Pedersen, 1976; Wegeberg, 2011). This represents a northern migration rate of about 83 km per decade.
Wilce (1964)did also not observeF. vesiculosusin the macroalgal communities at Qaanaaq (78◦N), but reported a northern distribution limit for this species at 71◦N. Fucus vesiculosus grows in the upper intertidal zone in Greenland (Høgslund
et al., 2014; Thyrring et al., 2020) and, hence, is likely sensitive to changes in ambient environment, including ice scouring (Thyrring et al., 2020).
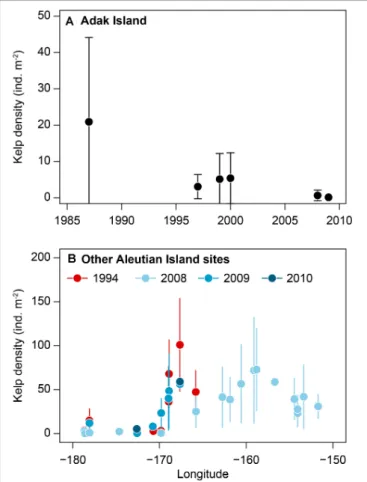
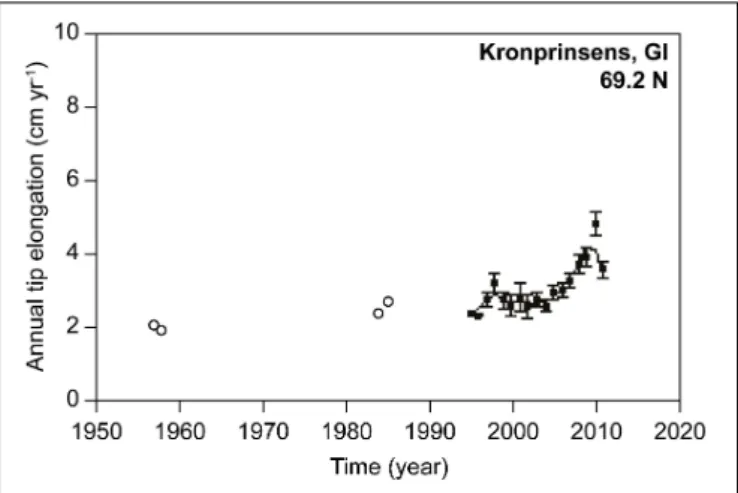
The intertidal habitat-forming macroalga Ascophyllum nodosum develops a biomass up to >30 kg m−2 near Nuuk (Ørberg et al., 2018), and has a reported northern distribution limit in the Disko Bay at about 69◦N (Pedersen, 2011). The growth rate of this species has been quantified at several sites along Greenland’s west coast from Nuuk to the Disko Bay, and has been monitored annually at Nuuk and Disko Bay as part of the GEM program. Ascophyllum nodosum growth shows a positive trend in growth rate at Kronprinsens Ejland, Disko Bay, over the period 1957–2012 (Table 1andFigure 1, Site 8, Figure 3), whereas time series from a site nearby (Qeqertarsuaq,Figure 1, Site 9), and a site further south along the west coast (Kobbefjord, Nuuk; Figure 1, Site 10) do not exhibit significant trends. Although growth rates oscillate, they tend to be higher in warmer years and warmer regions (Marbà et al., 2017).
Eelgrass,Zostera marina, also occurs in Greenland and has been studied on the west coast near Nuuk where it occurs in inner protected branches of the Nuup Kangerlua fjord system (64◦N) with the first reported occurrence in 1830 (Olesen et al., 2015). Dating of sediments in Z. marina meadows along with analyses of the origin of organic matter in these sediments suggest that eelgrass has been expanding in these locations over the past century (Marbà et al., 2018; Table 1 and Figure 1, Sites 11, 12). Further expansion of eelgrass in the region is expected with increasing temperature as leaf formation rates are fastest in the warmest fjord branches (Olesen et al., 2015) and sexual reproduction also appears to be most successful in the warmer years, since the sites where eelgrass occurs are located near the thermal limit for eelgrass reproduction (Olesen et al., 2015;
Blok et al., 2018).
FIGURE 3 |Time series ofAscophyllum nodosumtip growth at Kronprinsens Ejland, Disko Bay, Greenland (69◦N). Circles represent growth observations and solid lines 3-year running means. Data from 1957–1958 and 1984–1985 are shown with open circles while more recent data are shown with filled circles. Adapted fromMarbà et al. (2017)
(http://creativecommons.org/licenses/by/4.0/).
South Greenland
In the Cape Farewell area in South Greenland,Pedersen (1976) registered 104 species in 1970 (entities currently accepted taxonomically in algaebase, Guiry and Guiry, 2020, assessed 7 February 2020), while 70 species (about two thirds) were observed in 2011 (Wegeberg, 2012a) (Supplementary Table S2).
However, all of the conspicuous, habitat-forming species, such as fucoid and kelp species, that were recorded in 1970 were re-registered in 2011. Likewise, although ten species from the 2011-survey were not recorded in 1970, these were all relatively inconspicuous types (Supplementary Table S2). The species sampled in both 1970 and 2011 were identified by Dr. Poul Møller Pedersen with high taxonomic precision, so differences in identification are unlikely to have caused the differences in species number. It is more likely that the intensity and scope of sampling explains the differences in species number. For example, the relatively low number of species re-registered within Chlorophyta (Supplementary Table S2) is mainly due to lack of registration in 2011 of endophytes within this group, which were included in the 1970 survey. On this basis, we cannot verify changes in species composition within the 40-year gap between the two collections (Table 1andFigure 1, Site 13).
East Greenland
Along Greenland’s East coast, no prominent changes in macroalgal species distribution were identified. Species observed by underwater video camera in 2016–2017 (S. Wegeberg and O. Geertz-Hansen, unpublished data), such as the kelp species Agarum clathratum, Alaria esculenta, Laminaria solidungula, andSaccharina spp., as well as the red algal speciesCoccotylus truncatus and Turnerella pennyi, reach the same northward distribution as described in the past, based on numerous but local and sporadic samples (Rosenvinge, 1898, 1910, 1933;
Jónsson, 1904; Lund, 1959b; Table 1 and Figure 1, Site 14).
While the generally northward currents on the west coast of Greenland (Buch, 2000) likely support fast northward migration rates, the overall southward currents in NE Greenland may, on the contrary, limit northward migration. In the recent floristic baseline study at Mestersvig, E. Greenland (72◦N), Platysiphon verticillatus was registered (Birklund et al., 2006;
Wegeberg, 2012b). This species, likely a component of High- Arctic biodiversity, has not been observed in Greenland since it was erected byWilce (1962)on material from Qaanaaq (78◦N) on the west coast. It is possible that (Lund (1959a,b), working on material from the same east coast area, Ella Ø, may have identified this species, found epiphytically onFucus, asPunctaria plantaginea. Platysiphon verticillatus and P. plantaginea differ only in that the former has a long attenuated tip, therefore making it impossible to discriminate these two if the tip had been lost (both are found epiphytic on Fucus; Lund, 1959a,b; Birklund et al., 2006). Hence, we cannot conclude, on the basis of this evidence thatP. verticillatushas expanded its distribution.
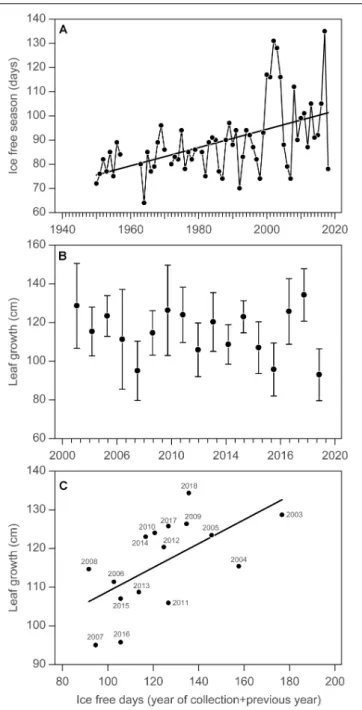
In Young Sound, NE Greenland, 74◦N, the annual growth ofSaccharina latissimahas been estimated since 2003 as part of the GEM program. About 20 specimens are collected in early August every year at 10 m depth and the length of the new blade is measured as a proxy for annual growth (Borum et al., 2002;
Krause-Jensen et al., 2012). Sea ice conditions in the fjord have been monitored for more than 70 years (Figure 4A), and show a significant increase in the duration of the ice-free season at a rate of 0.38±0.082 (SE) days per year (p<0.05,R2 =0.26). This suggests an overall increase in light availability for kelp growth but with considerable interannual oscillations. The time series of annual kelp growth shows marked interannual variation over the period 2003–2019, which may mask the increase expected from increased light availability (Table 1 and Figure 1, Site 15;Figure 4B). However, considering that kelp is able to store and transfer energy between years so that annual blade growth is determined by the light climate (as estimated by ice-free duration) of the year of collection and the previous year, we find a significant relationship between the total ice-free days in the year of collection and the previous year and annual leaf growth (p< 0.05,R2 = 0.38,Figure 4C), confirming the relationship established earlier based on data from 2003 to 2011 (Krause-Jensen et al., 2012).
Changes in Benthic Vegetation in Iceland
The intertidal areas of Iceland have an estimated cover of 1.008 km2, including skerries, island and beach ridges (Ottósson et al., 2016). Shores in Iceland range from very sheltered to heavily exposed. Apart from the southern coastline, the majority of shores are in bays and fjords and have little to moderate exposure.
Sheltered innermost parts of fjords and lagoons frequently freeze over during the winter months but coastal drift-ice has become rare during the last decades in Iceland (Ogilvie and Jónsson, 2001;
Simmonds, 2015), though Arctic sea ice occasionally drifts up to the northern and eastern shores.
Rocky shores with dominant macroalgae cover 28% (280 km2) of the coast (Ottósson et al., 2016). Macrovegetation on littoral sediments include eelgrass beds, which cover roughly 1%
(11 km2) of the coast and are dominated by a narrow-leaved form of Zostera marina (Ottósson et al., 2016). Other, less dominant habitat types also exist on some coastal stretches.
The algal vegetation on Icelandic shores has been relatively well known from the beginning of the 20th century (Jónsson, 1912), although trends in biomass or species composition changes for macroalgae have not been assessed for Iceland except for Surtsey (Table 1 andFigure 1, Site 16). There, macroalgae succession has been documented since the island, of volcanic origin, rose from the sea in late 1963. Existing data is relatively scattered in both space and time and much of it comes from surveys done in relation with human disturbances and environmental assessments at specific sites not involving trend surveys. These studies as well as other broad scale studies nevertheless establish a good baseline information (Supplementary Table S3) serving as a foundation for future studies on trends and patterns of macroalgae in Iceland.
It is very likely thatFucus serratuswas introduced to Icelandic waters by man. The first record of an occurrence ofF. serratus dates back to 1903 when the species was described in two locations in Iceland; Vestmanneyjar (63.4065, −20.2735) and Hafnarfjörður (64.0522, −22.0105) (Jónsson, 1903). In 1998 the species was found in Hvalfjörður (64.3775, −21.7331) (Thorarinsdottir et al., 2014), and confirmed in 2014 (IINH