Variability of Winter Snow Properties on Different Spatial Scales in the Weddell Sea
Stefanie Arndt1 and Stephan Paul1,2
1Alfred-Wegener-Institut Helmholtz-Zentrum für Polar- und Meeresforschung, Bremerhaven, Germany,2Department of Geography, Ludwig-Maximilians-Universität München, Munich, Germany
Abstract
The snow cover on Antarctic sea ice persists during most of the year, contributing significantly to the sea ice mass budget due to comprehensive seasonal transition processes within the snowpack as well as at the snow/ice interface. Consequently, snow on sea ice varies not only in depth but also in particular in its physical characteristics such as snow density and stratigraphy. In order to quantify the heterogeneous nature of the Antarctic snowpack on different spatial scales, that is, small (<10 m),floe-size (1-2 km), and regional (seasonal/perennial ice) scales, we present here a case study of snow analyses in the Weddell Sea in austral winter 2013. The resulting high variability of snow parameters in the basal snow layer reveals the need to distinguish between seasonal and perennial ice regimes, when retrieving, for example, snow depth using satellite microwave radiometry. Considering the full vertical snow column, a more detaileddistinction of the perennial sea ice regime into, for example, more ice classes is suggested in order to represent the high variability range. For the internal snowpack variability, however, we identify the grain size variability as the main driver, while snow density variations can be neglected. Moving from regional to floe-size scales, a similar variability range of the studied snow properties is found, suggesting that a large number of snow samples on a fewfloes is more crucial than covering a large region with fewerfloe-scale measurements. The spatiotemporally heterogeneous variability in snow accumulation, redistribution, and metamorphism is, however, too large to upscale the givenfindings beyond regional scale.
Plain Language Summary
Snow on sea ice alters the properties of the underlying ice cover as well as associated exchange processes at the interfaces between atmosphere, sea ice, and ocean due to its highly insulative and reflective properties. The snow cover on Antarctic sea ice generally persists throughout the year but undergoes substantial seasonal changes in its internal snowpack properties, as, for example, snow density, grain size, and grain shape. However, the spatial variability of these properties is poorly understood, yet this knowledge is crucial for sea ice mass budget calculations as well as the analysis of satellite remote sensing data. In this case study, we present a comprehensive snow data set covering different spatial scales. Thus, snow was sampled on seasonal and perennial sea icefloes across the Weddell Sea, while onefloe was more frequently sampled, respectively. An additional 10-m transect allows to conclude also on small-scale variability. Revealed scale-dependent snow property variability isdiscussed in the context of assumptions in energy and mass budget calculations as well as in recent retrievals of, for example, sea ice thickness, from satellite remote sensing observations in the ice-covered
Southern Ocean.
1. Introduction
Snow on sea ice alters the properties of the underlying ice cover as well as associated exchange processes at the interfaces between atmosphere, sea ice, and ocean. The snowpack on Antarctic sea ice generally persists throughout the year having a substantial year-round influence on the radiative and insulative properties of the sea ice cover, and thus, its role in climate and ecosystem processes (M. Sturm & Massom, 2017).
Significant seasonal changes do occur in its physical properties, however, with the transition from autumn/winter freezing to spring/summer melting conditions, and vice versa (Jeffries et al., 1997; Massom et al., 2001). One important process is the surface flooding and subsequent refreezing of slush at the snow/ice interface due to the generally thick Antarctic snowpack depressing the sea ice below water level (Eicken et al., 1994; Haas et al., 2001; Nicolaus et al., 2009). This process and the subsequent formation of snow-ice, as the surface slush freezes, are referred to asflood-freeze cycling (Fritsen et al., 1998). In situ measurements suggest that snow-ice formation contributes significantly to the sea ice mass budget of
RESEARCH ARTICLE
10.1029/2018JC014447
Key Points:
• Distinction between seasonal and perennial snow regimes is mandatory
• In the Weddell Sea, the same magnitude of snow property variability on regional andfloe size scale is found
• Snow grain sizes dominates the spatial variability of the Weddell Sea snowpack, while snow density variability can be neglected
Correspondence to:
S. Arndt,
stefanie.arndt@awi.de
Citation:
Arndt, S., & Paul, S. (2018). Variability of winter snow properties on different spatial scales in the Weddell Sea.Journal of Geophysical Research: Oceans,123, 8862–8876. https://doi.org/10.1029/
2018JC014447
Received 6 AUG 2018 Accepted 8 NOV 2018
Accepted article online 15 NOV 2018 Published online 6 DEC 2018
©2018. The Authors.
This is an open access article under the terms of the Creative Commons Attribution-NonCommercial-NoDerivs License, which permits use and distri- bution in any medium, provided the original work is properly cited, the use is non-commercial and no modifications or adaptations are made.
particularlyfirst-year ice in the Southern Ocean (Eicken et al., 1994; Eicken et al., 1995; Haas et al., 2001; Jeffries et al., 1997; Maksym & Markus, 2008; Nicolaus et al., 2009). Surfaceflooding is also thought to be seasonally and regionally dependent, with its occurrence increasing with the beginning of austral summer as basal ice melt increases due to high oceanic heatfluxes in the Southern Ocean (Martinson & Iannuzzi, 1998), while the thick snowpack remains. In addition, diurnal freeze-thaw cycles during spring and summer initiate the down- ward percolation of (fresh) meltwater through the snowpack, leading to formation of superimposed ice within the snowpack (Arndt et al., 2016; Haas et al., 2001, 2008; Nicolaus et al., 2009; Willmes et al., 2006).
Both snow-ice and superimposed ice formation are affected by snow metamorphism processes, which con- tribute to a strongly layered snowpack on Antarctic sea ice (M. Sturm & Massom, 2017). The compaction of the basal snow layer accompanied by snow-ice formation adds significantly to the sea ice growth at the sur- face, and thus to the mass budget of Antarctic sea ice (Eicken et al., 1994, 1995; Haas et al., 2001; Jeffries et al., 1997; Nicolaus et al., 2009). In contrast, sea ice melt processes are observed mainly at the bottom of Antarctic sea ice, as well as from lateral solar radiation input.
Detailed knowledge of the stratigraphy of the Antarctic snowpack is important for a better understanding of seasonal changes in the sea ice mass budget and is also required to quantify the radiative transfer processes in the climate system between atmosphere, sea ice, and ocean. In addition, snow is a major determinant of the sea ice surface albedo (Brandt et al., 2005; Perovich, 1996; Perovich et al., 2011) and light transmittance through sea ice (Light et al., 2008; Perovich, 2007; Zatko & Warren, 2015). However, the heterogeneous nature of the snow cover on Antarctic pack ice and its strong metamorphism over time obscure a direct correlation between, for example, the under-ice lightfield and snow depth (Arndt et al., 2017).
Understanding internal snow structures associated with liquid water changes in the snowpack does not only improve the understanding of seasonal and interannual sea ice mass budget variations in the Southern Ocean but is also a crucial step toward increasing the accuracy of important satellite-derived sea ice data products. A wet snowpack, for example, impacts and limits the accuracy of both sea ice concentration retrievals from passive microwave data (Comiso et al., 1992; Willmes et al., 2014) and sea ice thickness and snow depth retrievals based on microwave radiometry (Cavalieri et al., 2012; Kern et al., 2016; Kern &
Ozsoy-Çiçek, 2016), synthetic aperture radar (Paul et al., 2015), and radar altimetry (Ricker et al., 2014).
Thus, detailed information on seasonally changing snow stratigraphy, density, and liquid water content and potentially improve the accuracy of the freeboard-to-thickness conversion for Antarctic sea ice using, for example, CryoSat-2 data (Paul et al., 2018; Robert Ricker et al., 2015; Schwegmann et al., 2016), as well of existing snow depth retrieval algorithms (Comiso et al., 2003; Kern & Ozsoy-Çiçek, 2016).
In a recent study, seasonally evolving properties of sea ice and snow dominating its respective dielectric character, such as changing density, grain size, stratigraphy, and liquid water content, were utilized to detect both diurnal thawing and refreezing at the snow surface as well as internal snowmelt on a pan-Antarctic scale by satellite microwave observations (Arndt et al., 2016; Willmes et al., 2009). Results of the study suggest that in particular the Weddell Sea is highly spatially and temporally variable regarding the identified snowmelt patterns related to appearing/missing surface and internal snowmelt on the regional scale, respectively.
However, local point-to-point comparisons with in situ snow accumulation data indicate large uncertainties of the retrieved data product, suggesting large small-scale variability in local snow metamorphism and snow drift events, that cannot be sufficiently described by satellite remote sensing. These results rise the question:
To what extent do the described snow properties, such as snow stratigraphy, vertical density, and grain size distributions, actually vary on different spatial scales, that is, on small (<10 m),floe-size (1–2 km), and regional (seasonal/perennial sea ice) scales? Which snow properties are the main driver of the variability of different snow regimes and on which scales?
To answer these questions, we present here a comprehensive snow data set from theAntarctic Winter Ecosystem Climate Study(AWECS) in the Weddell Sea in austral winter 2013. The sampled 87 snow pits were examined for snow properties, such as depth, density, temperature profile, and stratigraphy. In order to quantify scale-dependent ranges of variations for these snow properties, measurements were carried out on both seasonal and perennial sea ice and snow regimes (regional scale), while onefloe was more frequently sampled, respectively (floe-size scale). An additional 10-m transect allows to conclude also on small-scale variability. Results are discussed in the context of scale-dependent snow property assumptions in energy and mass budget calculations as well as of recent retrievals of main sea ice variables (e.g., sea ice
thickness) from satellite remote sensing observations in the ice-covered Southern Ocean. Comparisons to data sets in a similar study area and in a similar time period supplement the discussion.
2. Data and Methods
2.1. Study Site Descriptions
All measurements were performed during the expedition PS81 of the German ice-breakerR/V Polarstern during the AWECS in the Weddell Sea (Figure 1, hereafter referred to as PS81; Lemke, 2014). The presented 87 snow pit measurements were carried out either during nine ice stations (in total 67 snow pits), lasting for 1 to 5 days, or by additional helicopter surveys along the cruise track (20 snow pits; Figure 1). Doing so, 20first-year and 9 multiyear icefloes were sampled. When distinguishing betweenfirst-year and multiyear icefloes, we are referring here to sea ice areas characterized by level ice with little ridges smooth surface structures in the Eastern Weddell Sea and to areas determined by rough surfaces with a high proportion of ridges in the Western Weddell Sea (close to the Antarctic Peninsula), respectively. During these ice stations, between 1 and 28 snow pits were sampled per icefloe. Sampling sites were chosen, on the one hand, by representativeness of thefloe examined by additional snow depth transects (see section 2.2) to ensure covering different snow depth regimes, and on the other hand, associated with other interdisciplinary sea ice measurements (Tison et al., 2017). Therefore, all presented snow data were well distributed over the ice floes. At station PS81/506, an additional 10-m transect line was sampled every meter to study the small-scale Figure 1.Locations of all snow pits sampled during the Antarctic Winter Ecosystem Climate Study R/V Polarstern cruise (PS81, ANT-29/6). The squares denote snow pit work during comprehensive ice stations (1 to 5 days), while the given numbers indicate the amount of snow pits sampled on the respective station. The green squares are analyzed in more detail in that paper. The purple triangles denote additional snow pits reached by helicopter (1 snow pit per landing).
variability in the snowpack. For the analysis of the fullfirst-year data set, the transect measurements were excluded a spatial bias.
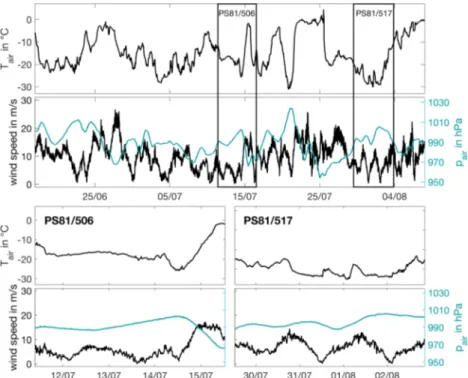
To examine the spatial variability of snow properties onfloe-size scale, one station onfirst-year and one station on multiyear were chosen for detailed analysis. Thefirst-year icefloe (PS81/506) was sampled at about 67°11.850S and 23°03.340W from 11 to 15 July 2013 (Table 1). The sea ice surface and weather conditions were stable from 11 to 14 July 2013, while afterward a strong low-pressure system has passed through (Figure 2).
The analysis of this station as well as for the fullfirst-year data set therefore excludes data of 15 July 2013 (four sampled snow pits) in order to ensure comparable surface conditions. Second, a multiyear icefloe (PS81/517) was sampled close to the Antarctic Peninsula at about 63°36.160S and 51°12.9210W from 29 July to 02 August 2013 (Table 1). During this period, sea ice surface and weather conditions were stable, which allows merging all snow pits sampled at this ice station (Figure 2).
2.2. Data Acquisition
All snow measurements were taken on the undisturbed shaded working wall of the snow pit. Vertical profiles of snow temperature and density were sampled in all snow pits with a vertical resolution of 2 to 5 cm from the top (snow-air interface) to the bottom, depending on the total snow depth and internal layering. However,
Table 1
Overview of Characteristic Parameters of One Station in the First-Year (PS81/506) and One in the Multiyear (PS81/517) Sea Ice and Snow Regimes in the Weddell Sea
Station PS81/506 PS81/517
Date 11–15 July 2013 29 July to 2 August 2013
Location 67°11.850S/23°03.340W 63°36.160S/51°12.9210W
Ice/snow type First year Multiyear
Mean ice thickness 69 ± 42 cm 153 ± 54 cm
Mean snow depth 21 ± 8 cm 55 ± 19 cm
Number of snow pits 28 (incl. 10 on transect line and four after significant snow surface changes)
12
Figure 2.Weather conditions during PS81 along the cruise track while R/V Polarstern was in ice-covered oceans (upper panel) and for the two detailed ice stations PS81/506 (lower left panel) and PS81/517 (lower right panel). Measurements were taken automatically on deck ofR/V Polarstern(König-Langlo, 2013).
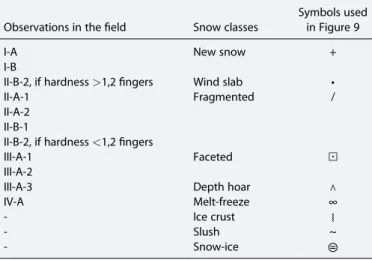
due to hard ice layers close to the snow/ice interface or time limitations, vertical snow density profiles may not reach the snow/ice interface at all sampled snow pits. Additional intermediate ice layers in 10 of the sampled snow pits might prevent a continuous profile. These limitations might lead to a slight underestimation of the given density values. Snow temperature was measured with a hand-held Pt-1000 thermometer, protected from direct solar radiation. Snow density was determined volumetrically with a density cutter (volume: 100 ml, height: 3 cm). Snow stratigraphy was visually classified according to Fierz et al. (2009) (Table 2). For each identi- fied layer (Figure 3), snow grain size and type as well as layer hardness were determined. Snow grain type and size were examined with an 8X magnifying glass and millimeter-scale grid card identifying the respective main grain size and type per layer.
For the grain type description (Table 2), we distinguish between unmeta- morphosed and metamorphosed snow (Sommerfeld & LaChapelle, 1970). (Unmetamorphosed) new snow consists of easy distinguishable snowflakes (I-A/B). As soon as the snow surface is subjected to wind, snow- flakes are rounded and hardened forming small-grained wind slab (II-B-2).
For snow metamorphism, the prevalent temperature gradient in the snowpack drives, for example, vapor moisture diffusion within the snowpack controlling the size and shape of the snow grains (Akitaya, 1974).
Therefore, within a snowpack with small temperature gradient or even equi-temperature conditions, frag- mented crystals develop preferable (II-A/B-1/2, destructive metamorphism). In contrast, strong temperature gradients foster the gradual formation of both faceted (III-A-1/2) and depth hoar grains (III-A-3), while the critical threshold for the latter is0.25 K/cm (e.g., Colbeck, 1982). In addition, diurnal freeze-thaw cycles during spring and summer initiate the downward percolation of (fresh) meltwater through the snowpack, leading to formation of melt-freeze forms (IV-A) as well as (superimposed) ice layers within the snowpack.
The hardness was determined from the snow pits’wall by hand testing the penetration resistance of each layer, which divided the hardness in six different classes: very soft (fist; F), soft (3,4fingers; 4F), medium (1,2fingers; 1F), hard (pencil; P), very hard (knife blade; K), and ice (I).
In addition to the vertical snow profiling, total sea ice thickness (sea ice thickness plus snow depth) was mea- sured on each ice station during transect measurements (length: one to several kilometers) with a ground- based multifrequency electromagnetic induction instrument (GEM-2, Geophex Ltd.; Hunkeler et al., 2016).
A Global Positioning System (GPS)-equipped Magna Probe (Snow Hydro, Fairbanks, AK, USA) was operated simultaneously in order to obtain snow depth along the GEM-2 tracks. Snow depth measurements were taken every 1.5 to 2.5 m along the track. Sea ice thickness was then calculated as the difference of total sea ice thickness and snow depth.
2.3. Data Analysis
Based on the measured vertical snow temperature and density profiles sampled in a certain depth, the mean density, thermal conductivity, and temperature gradient of the snowpack were calculated.
Figure 3.Pictures of the snow pit walls sampled on the 10-m transect at ice station PS81/506. The rods mark the identified layers (see Figure 9). The picture on meter 4 is missing.
Table 2
Snow Type Observations and According Classification During PS81 Following Fierz et al. (2009)
Observations in thefield Snow classes
Symbols used in Figure 9
I-A New snow +
I-B
II-B-2, if hardness>1,2fingers Wind slab •
II-A-1 Fragmented /
II-A-2 II-B-1
II-B-2, if hardness<1,2fingers
III-A-1 Faceted ⊡
III-A-2
III-A-3 Depth hoar ⋀
IV-A Melt-freeze ∞
- Ice crust ⧙
- Slush ~
- Snow-ice ⊜
Mean density values were derived by averaging the measured density of each 3-cm-thick snow layer over the entire snowpack. As the density cutter is missing hard ice layers in the snow, the resulting mean snow density values might tend to slightly too low values.
The thermal conductivity of snow is calculated dependent on the averaged density over the entire snowpack (ρexpressed in kg/m3(Calonne et al., 2011))
ks¼2:5·106·ρ21:23·104·ρþ0:024: (1) The temperature gradient within the snowpack is calculated as
dT
dz¼TsT0
zs ; (2)
whereTsis the temperature at the snow/air interface (snow surface),T0is the temperature at the snow/ice interface, and zs is the total snow depth. Throughout the manuscript, for zs, we define 0 cm as the snow/ice interface leading to negative temperature gradients forT0>Ts.
In order to quantify the variability of all analyzed snow parameters, including the grain size, their relative stan- dard deviation (RSD) is computed, which is the ratio of the calculated standard deviation (SD) and the mean of the respective parameter.
3. Results
3.1. Snow and Sea Ice Thickness
Separating all sampled snow pits for first-year (FYI) and multiyear ice (MYI) shows a clear shift in the distribution functions of snow depth toward shallower snow depth on FYI (Figure 4a). Data reveal an averaged snow depth of 22 ± 9 cm over FYI and 52 ± 22 cm over MYI. While the calculated mean values Figure 4.(left boxes) Relative frequency distribution functions of all snow measurements separated intofirst-year (grey) and multiyear (cyan) snow samples and (right boxes) boxplot comparison of all measurement separated forfirst-year and multiyear ice (FY/MY), the detailedfirst-year and multiyear icefloe (FY (f)/MY (f)), and the 10-m transect only (T10) for (a) snow depth, (b) density, (c) thermal conductivity (ks), (d) number of identified layers in the respective snowpack, (e) grain size, and (f) grain type. In the histograms of each plot, the dashed lines indicate the respective mean values. In the boxplots, boxes span over thefirst and third quartiles. The whiskers display the 20 and 80 percentiles. The solid lines indicate mean values; the dashed lines indicate median values.
match the modal snow depth over FYI well, the modal value over MYI is about 10–15 cm higher than the MYI average, which is related to a broader variation range compared to FYI (Table 3).
Sampled snow pits at ice station PS81/506 on FYI and PS81/517 on MYI only show an averaged snow depth of 18 ± 4 cm over FYI and 47 ± 24 cm over MYI. Considering the 10-m transect line at ice station PS81/506 on FYI, an averaged snow depth of 19 ± 2 cm is sampled, matching the prevalent snow depth at the ice station.
For the more detailed ice stations on FYI and MYI additional snow depth data from Magna Probe transects are available revealing an averaged snow depth of 21 ± 8 cm and 55 ± 19 cm, respectively (Figure 5).
However, the calculated mean values match the modal values of the respective distribution functions.
Even though the sample sizes from Magna Probe transects (FYI: 736, MYI: 355), sampled snow pits on the respective icefloes (FYI: 17, MYI: 12) and all snow pits (FYI: 64, MYI: 23) differ substantially, similar mean values andSDemphasize the representativeness of the selected sampling locations for the area.
For the sea ice thickness, both FYI and MYI reveal a bimodal distribution (Figure 5). For FYI, the distribution function indicates the strongest mode (33% of all measurements) for the bin of 45 to 55 cm, while the averaged ice thickness is 69 ± 42 cm. For MYI, three consecutive bins from 135 to 165 cm show the strongest mode of about 8% (of all measurements on thefloe), respectively, matching the mean sea ice thickness of 153 ± 54 cm.
3.2. Snow Density
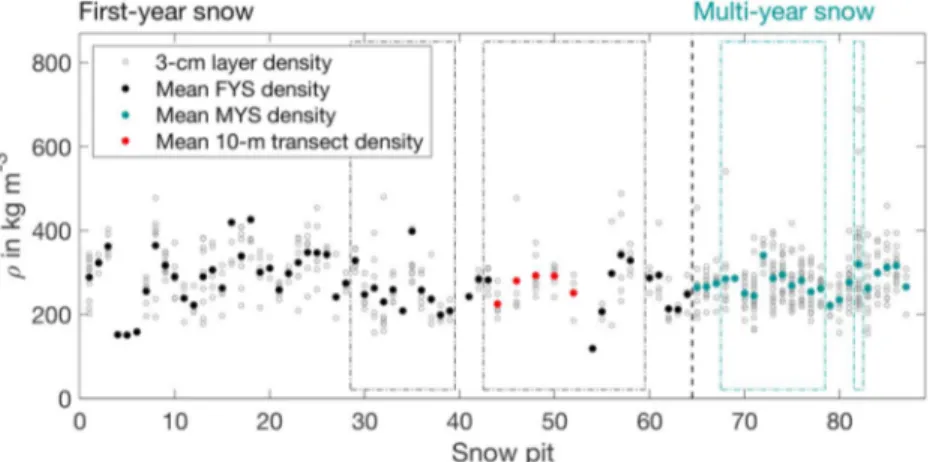
Figure 6 shows the vertically averaged snow density over the entire snow pit of all sampled snow pits as well as the snow density of each single layer (layer thickness 3 cm). While the latter is indicating the range of snow density values throughout the profile, the vertically averaged snow density is analyzed in more detail in the following.
The vertically averaged snow density of bothfirst-year (FYS) and multiyear snow (MYS) was rather similar with averaged values of 276 ± 66 kg/m3and 277 ± 29 kg/m3. The RSD of the snow density of FYS (0.24) was about 2.5 times higher than of MYS (0.10; Table 4). Analyzing the topmost 10 cm only, the vertically averaged den- sity was lower compared to entire snowpack with 263 ± 84 kg/m3for FYS and 270 ± 48 kg/m3for MYS (Figure 7). The RSD values for the topmost part are larger by 0.08 for both FYS and MYS compared to the entire snowpack.
Considering the individual station PS81/506 and PS81/517 only, differences betweenfirst-year and multiyear snow become a little clearer (Figure 4b). While the vertically averaged density was 258 ± 65 kg/m3for FYS, it was 281 ± 28 kg/m3for MYS. The RSD values of the density of FYSfloe (0.25) and MYSfloe (0.20) are similar to the entire FYS/MYS data set.
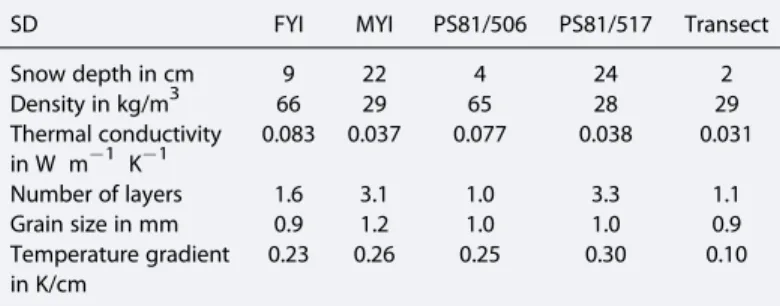
Table 3
Calculated Standard Deviations (SD) for Different Snow Properties in the Sampled Snowpack Separated for FYI/MYI, Detailed Ice-Floe (PS81/506 and PS81/517) Analysis, and the 10-m Transect
SD FYI MYI PS81/506 PS81/517 Transect
Snow depth in cm 9 22 4 24 2
Density in kg/m3 66 29 65 28 29
Thermal conductivity in W m1 K1
0.083 0.037 0.077 0.038 0.031
Number of layers 1.6 3.1 1.0 3.3 1.1
Grain size in mm 0.9 1.2 1.0 1.0 0.9
Temperature gradient in K/cm
0.23 0.26 0.25 0.30 0.10
Figure 5.Relative frequency distribution functions of measured snow (left, bin width: 5 cm) and sea ice (right, bin width:
10 cm) thicknesses during thefirst-year (PS81/505, gray) and multiyear (PS81/517, cyan) snow and ice station. The vertical dashed lines denote the calculated mean values of each class.
For the 10-m transect the density measurements were taken only every 2 m for time reasons. Here the vertically averaged density over thefive sampled snow pits was 268 ± 29 kg/m3(Figure 4b) with a resulting RSD of 0.11.
3.3. Snow Temperature Gradients and Thermal Conductivity
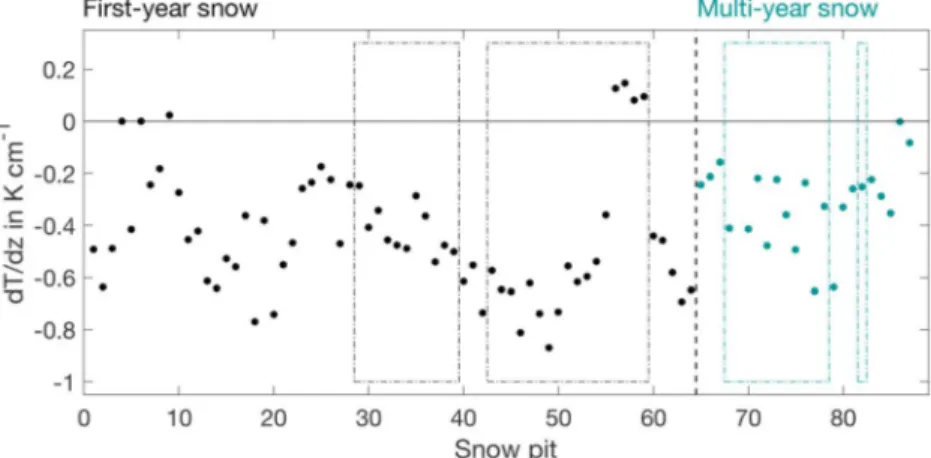
Figure 8 shows the calculated snow temperature gradient for the entire snowpack between snow surface (zs) and snow/ice interface (z0; equation (2)). Most of the presented measurements were conducted during twilight or night conditions due to the timing (polar night) of the expedition leading to air and snow surface temperatures far below freezing point (Figure 2). Also, temperatures at the snow/ice interface never exceeded2.1 °C, while they did not drop below12.3 °C either. Consequently, all calculated temperature gradients throughout the entire snowpack were negative, except for four measurements on 15 July after a strong low-pressure system has passed through bringing in warm air masses. Thus, temperature gradients ranged from0.77 to +0.15 K/cm in FYS with an averaged gradient of0.40 ± 0.23 K/cm (Figure 8). For MYS, the average temperature gradient was about 13% lower than for FYS (0.35 ± 0.26 K/cm) varying between1.30 and 0 K/cm. Separating for the detailed ice stations PS81/506 and PS81/517, similar results with a higher variability are obtained. Considering the upper snowpack only results in an averaged tempera- ture gradient of0.70 ± 0.48 K/cm in the FYS and0.62 ± 0.47 K/cm in the MYS.
Figure 4c shows that the calculated snow thermal conductivity (equation (1)) ranged from 0.043 to 0.426 W · m2· K1with a mean value of 0.192 ± 0.083 W · m2· K1in FYS. For MYS, the overall range is much smaller varying between 0.119 and 0.273 W · m2 · K1, while the mean value of 0.183 ± 0.037 W · m2· K1is roughly similar. Calculations for the more detailed icefloes PS81/506 and PS81/517 confirmed the mean values as well as the range of the variability with RSD values of 0.43 (all sam- ples) and 0.45 (PS81/506 only) for FYS and 0.20 for MYS. Also, the 10-m transect on FYS indicates the same mean snow thermal conductivity (0.192 W · m2 · K1); however, the RSD, and therefore the small-scale variability, is smaller than on larger scales (0.16).
3.4. Snow Stratigraphy
3.4.1. First-Year Versus Multiyear Snow Properties
In general, the snow stratigraphy of the FYS and MYS shows substantial dif- ferences. Based on observations from the snow pits, we identified on aver- age four distinct layers in the FYS, while, on average, in the MYS eight layers were found (Figure 4d). The additional layers are expected to be formed in the previous season by snow accumulation on top and internal seasonal variations in the snow structures due to, for example, melt-freeze cycles throughout the season. The different composition of the crystal Figure 6.Density (ρ) for every single layer per snow pit (3-cm height; gray circles) and as vertically averaged values forfirst- year snow (FYS, black), multiyear snow (MYS, cyan), and the 10-m snow pit transect (red). The dashed boxes denote ice station PS81/506 and PS81/517 onfirst year and multiyear ice, respectively, which are analyzed in more detail.
Table 4
Calculated Relative Standard Deviations (RSD) for Different Snow Properties in the Sampled Snowpack Separated for FYI/MYI, Detailed Ice-Floe (PS81/506 and PS81/517) Analysis, and the 10-m Transect
RSD of FYI MYI PS81/506 PS81/517 Transect
Snow depth 0.42 0.42 0.26 0.50 0.09
Density 0.24 0.10 0.25 0.10 0.11
Thermal conductivity 0.43 0.20 0.45 0.20 0.16
Number of layers 0.38 0.41 0.21 0.42 0.20
Grain size 0.49 0.61 0.51 0.57 0.55
Temperature gradient 0.58 0.73 0.77 0.67 0.15
structure in the respective snowpack confirms the differences between both snowpack types, as summarized in Figure 4f and Table 5. In the FYS, we observed that most of the snowpack consisted of wind slab (30%) and faceted (32%) layers. Only 6% of the FYS was made of fragmented crystals. Also, melt-freeze forms (10%) and icy (9%) layers were regularly observed. In contrast, the MYS was dominated by an almost equal number of layers with fragmented (21%), faceted (20%), and depth hoar (19%) crystals as well as melt-freeze forms (18%). Slush layers at the bottom of the snowpack were rarely observed in both FYS (2%) and MYS (2%).
One observation that was consistent for both FYS and MYS was that layers with (larger) depth hoar crystals were found predominantly near the snow/ice interface, while softer layers with smaller grains were more prevalent in the upper snow layers. The mean grain sizes varied between 1.5 and 2 mm for both FYS and MYS (Figure 4e). However, in the MYS also larger grains were observed frequently due to the larger amount of depth hoar crystals.
Considering the topmost 10 cm of the FYS only, the major crystal types are similar to the entire snowpack;
only the relative distribution shifted toward a higher proportion of wind slab layers (43%; Table 5 and
Figure 8.Calculated snow temperature gradients between snow surface (zs) and snow/ice interface (z0) according to equa- tion (2). The dashed boxes denote ice station PS81/506 and PS81/517 onfirst-year and multiyear ice, respectively, which are analyzed in more detail.
Figure 7.Relative frequency distribution function of all snow measurements in the topmost 10 cm only, separated into first-year (gray) and multiyear (cyan) snow samples. The vertical dashed lines denote the calculated mean values of each class.
Figure 7). In contrast, the MYS composition of the topmost 10 cm is significantly different when comparing it to the entire snowpack. Hence, the topmost 10 cm of the MYS was made of wind slab (42%) and fragmented (34%) layers.
3.4.2. Regional Versus Floe-Size-Scale Snow Properties
Comparing the snowpack composition of all sampled FY snow pits to the individual icefloe PS81/506 shows an enormous shift within the relative distribution of crystal types, while the averaged grain sizes and identified number of layers are similar for both spatial scales. However, faceted layers were observed as the main crystal type on both all FYS sites (32%) and the individualfloe (24%). In contrast, the individualfloe revealed a significant proportion of ice crusts (17%) and melt-freeze forms (12%), which were less dominant when considering all FYS samples. Also, the proportion of wind slab layers was higher on the individualfloe (14%) compared to all FYS pits (5%).
In contrast, the snow stratigraphy for all MYS samples and the individual icefloe PS81/517 are widely consistent. Thus, on average, the number of identified layers (8), the mean grain size (1.5–2 mm), and the crystal type composition, with major proportions of wind slab, fragmented, faceted, and depth hoar layers, over the respective spatial scale are similar.
3.4.3. Small-Scale Snow Properties on the 10-m Transect
Figure 9 shows the observed stratigraphy of the 10-m transect line of snow pits sampled at ice station PS81/506.
Based on the identified crystal types and hardness class per layer in each snow pit, four main layers A to D (bottom to top) were identified over the whole transect. The bottom layer, layer A, was a very hard layer, with values ranging from P to I. The 5- to 10-cm-thick layer was composed of fragmented, melt-freeze form, snow- ice through to icy layers. Layer B varied considerably in layer thickness with estimates between 3.5 and 9 cm.
Even though the main characteristic was comparatively soft layer structure with values ranging between 1F and 4F, the layer composition also showed a rather wide range, including faceted, fragmented, and wind slab layers. Layer C is an intermediate crust layer with an average thickness of about 1 to 2 cm. While it is missing in thefirst two sampled snow pits of the transect, it increases up to 5 cm in thickness in locations 8 and 9. The surface snow layer, layer D, is a soft (4F to F) new snow layer ranging between 1- and 9-cm thickness.
Table 5
Relative Amount of Different Snow Classes (in %) in the Sampled Snowpack Separated for FYS/MYS, Detailed Ice-Floe (PS81/506 and PS81/517) Analysis, and the 10-m Transect
Snow class
FYS MYS
PS81/
506 PS81/
517 Transect All 10 cm All 10 cm
New snow 5.4 11.2 0.6 5.8 14.1 0.0 19.0
Wind slab 30.3 43.2 14.6 41.7 16.4 14.6 21.1
Fragmented 6.3 9.8 21.4 34.2 10.5 20.2 12.5
Faceted 31.9 26.7 20.0 12.9 23.8 25.9 14.3
Depth hoar 3.2 0.8 19.2 2.4 0.9 14.3 0.0
Melt-freeze 9.7 3.1 18.4 2.2 12.3 18.5 4.2
Ice crust 9.4 3.6 3.6 0.8 16.9 2.5 23.7
Slush 2.0 1.6 2.2 0.0 2.7 4.0 0.0
Snow-ice 1.8 0.0 0.0 0.0 2.4 0.0 5.2
Figure 9.Schematic of observed stratigraphy and layering of a 10-m transect line of snow pits sampled at ice station PS81/506. All symbols are explained in Table 2.
The snow hardness is given right to each layer: F,fist; 4F, 4fingers; 1F, 1finger; P, pencil; K, knife; I, ice. The horizontal solid black lines denote identified main layers in the snowpack labeled with A to D.
4. Discussion
4.1. Winter Snowpack Properties in the Weddell Sea
The stratigraphy of a winter snowpack on sea ice is mainly controlled by internal snow metamorphism processes associated with internal snow temperature gradients, snow density, and grain size, leading to a comprehensive layering of the entire snowpack. However, after snowfall events, snow density of the new snow as well as recrystallization processes are determined by compaction as a function of air temperature and wind speed.
Previous studies have identified the vertical temperature gradient as a main driver for vapor moisture diffusion within the snowpack, which in turn controls the shape and size of the snow grains (e.g., Akitaya, 1974). In the presented case study, the observed linear temperature gradients of the austral snowpack on the Weddell Sea pack ice ranged from1.30 to 0.15 K/cm with largest temperature gradients in thin snow covers and vice versa, approving the reverse relationship between snow depth and temperature gradient.
In 76% of all sampled snow pits, the temperature gradient was below0.25 K/cm, which is the critical threshold that fosters depth hoar formation (e.g., Colbeck, 1982). Consequently, depth hoar and faceted crystals dominate both thefirst-year and multiyear snowpack composition (on average 37%), similar to the sampled snowpack during the Winter Weddell Gyre Study in 1992 (Massom et al., 1997).
Overall, the range of the temperature gradient and the snow composition of the presented snow samples are in high agreement with published literature on winter snow conditions (e.g., Massom et al., 1997, 2001). Also, the mean snow density values of 276 ± 64 kg/m3and 277 ± 29 kg/m3for FYS and MYS are in the same order of magnitude with that of about 320 kg/m3during the Winter Weddell Gyre Study in 1992 (Massom et al., 1997). The same holds for the estimated averaged thermal conductivity values of 0.192 ± 0.083 W · m2· K1and 0.183 ± 0.037 W · m2· K1in FYS and MYS comparing well with the averaged value of 0.178 ± 0.134 W · m2· K1estimated by M. Sturm et al. (1997) over seasonal sea ice.
The overall good agreement of the sampled snow pits with those from previous studies in a similar study area and time of the year emphasizes the representativeness of the selected data in the vicinity and allows therefore for an independent analysis of scale-dependent snow properties in the following sections.
4.2. Variability of Snow Properties in Different Snow Regimes
In order to compare and quantify the variability of the above described snow properties of the two snow regimes, we use two different approaches: While the RSD (Table 4) is a measure to compare that the variability of snow properties investigates in that study within a certain snow class (e.g., FYS/MYS), the (absolute)SD(Table 3) is used to compare the variability of the same snow property across different snow classes and scales. Doing so, we take only independent variables into account and therefore neglect the thermal conductivity which is a function of the snow density.
In our case study in the Weddell Sea, RSD values in FYS (all measurements) of snow depth (0.42), number of layers (0.37), and grain size (0.49) are up to twice as high as the RSD of snow density (0.24). For MYS, the RSD of snow density (0.10) is even lower compared to the other properties with the highest RSD in grain size (0.61). Thus, our study reveals that for both FYS and MYS the snow density is the weakest contributor to the spatial variability of both snow regimes in the Weddell Sea. This highlights that the mean snow density is the most homogeneously distributed parameter investigated in this study. Instead, snow depth, the number of layers, and the grain size determine the variability on the regional scale.
Analyzing the mean value as well as theSDof the grain size, the main driver of the snow regime variabilities, our results show rather similar values for FYS (1.8 ± 0.8 mm) and MYS (1.8 ± 1.2 mm). However, taking also the snow composition into account, the relative amounts of faceted and depth hoar layers tend to be lower in FYS (35.1%) than in MYS (39.2%), despite the observed large temperature gradients in both snow regimes (section 4.1). The difference of the fraction of faceted and depth hoar layers between FYS and MYS is larger for the detailed investigatedfloes: 24.7% and 40.2%, respectively (Table 5). To explain these differences, we must consider both the different snow regimes (FYS/MYS) and the regional differences. The western Weddell Sea close to the Antarctic Peninsula is characterized by strong storm activity driven by the Amundsen Sea Low (ASL; Parish, 1983; Turner et al., 2015), which might lead to temporal temperature gradient drops down to about 0 K/m. Consequently, the strong temperature gradients required for constructive metamorphism
and the subsequent formation of faceted and depth hoar grains are intermittently interrupted (e.g., Colbeck, 1982). Instead, thaw-refreezing events might have developed the pronounced melt-freeze forms in the MYS during the previous spring-summer transition, which is supported by observation of multiple basal and internal thaw-refreezing events by satellite microwave observations in the area (Arndt et al., 2016; Willmes et al., 2006).
In contrast, FYS is dominated by snow accumulation (wind slab) and fragmented grains, the prestate of depth hoar, dominated. Thus, the presented study rises the need to differentiate between FYI and MYI, since both the different snow composition of FYS and MYS and the examined significant higher number of internal snow layers in MYS (on average 8 layers) than in FYS (on average four layers) have a crucial impact on the calculation of energy and mass budgets for the ice-covered Southern Ocean. In particular, the higher number of internal layers results in an increased vertical variability of snow density and grain size leading to higher thermal conductivity of the prevalent snowpack. Including the larger grains also leads rather to an increased scattering and light absorption than to light transmission to the snow/ice interface and vice versa (Perovich, 1996).
Furthermore, following our assumption that the density can be neglected for the variability analysis, an overall higher property variability is evident for MYS than for FYS. This might be attributed to diurnal thaw-freeze cycles in the upper snowpack as well as internal melt events in the previous summer in the area observed in afield studies on snow properties during the spring-summer transition by, for example, Nicolaus et al. (2009) as well as identified by Arndt et al. (2016) from passive microwave observations. In contrast, FYS is expected to be more homogenous. We therefore suggest to differentiate for more detailed MY classes (e.g., second-year ice/snow and third-year ice/snow) for the calculation of the energy and mass budgets in order to represent the given variability.
Considering the topmost part of the snow regimes only, the differences between FYS and MYS increase for the mean values of the snow properties, while theSDsignificantly decrease, especially for the MYS. In this regard, it is expected that the variability of snow properties in the basal snow layer, although the snow is dry, might have a profound impact on microwave emissivity and might well impact snow depth retrieval using satellite microwave radiometry (Kern & Ozsoy-Çiçek, 2016; Markus & Cavalieri, 1998). Our results highlight therefore the importance to distinguish between FYS and MYS, while an additional subdivision of either snow types is not necessary for this application.
4.3. Variability of Snow Properties on Different Spatial Scales
To conclude on scale-dependent assumptions, the presented study examined one individual icefloe in each ice/snow regime, respectively, in more detail. It is shown that the variability within the MYS on regio- nal and onfloe-size scales is for all studied snow properties rather similar. For FYS, both thefloe-size and regional scale variabilities are mainly driven by the grain size distribution (RSD around 0.5). In contrast, the impact of the number of layers as well as the snow depth onfloe-size scale is reduced to RSD values of 0.21 and 0.26 compared to the entire FYI area (0.38 and 0.42). Temperature gradients, in contrast, show a substantial higher RSD onfloe-size than (0.77) on regional scale (0.58) suggesting an increasing variabil- ity with increasing scale range. However, the actual value range of the FYS and MYS parameters is similar on regional and floe-size scales. The previous section indicates the mean snow density as the most homogeneously distributed parameter, which becomes more evident when moving to smaller scales on the 10-m transect: RSD of the snow density, and therefore its impact on the snowpack variability, decreases with decreasing spatial scales from around 0.25 for the regional andfloe-size scales toward 0.11 on the local scale.
Also, on a 10-m transect, we examine a variability of individual properties, which is again dominated by the grain size variability but also by the vertical extent and position of the identified layers. Therefore, we hypothesize that the 10-m along-transect variations in the vertical composition of the snow and the resulting spread, that is, small-scale variability, are well represented by taking snow samples distributed on a single floe. Although the magnitude of the variations is by far not as pronounced as on larger scales, the small-scale variability highlights the need of a high sampling rate for local snow process studies in the snow column as well as in the coupled sea ice and snow system.
From these results of our study, we hypothesize that snow property variations on regional scale can be well approximated withfloe-scale data, meaning that a large number of measurements on a fewfloes is more
crucial than covering a comparably large region with fewerfloe-scale measurements. Therefore, we suggest to distribute 10 to 20 vertical snow measurements related to local effects leading to different prevalent snow patterns across thefloe in order to catch the examined variability. Doing so, a terrestrial laser scanner may be used prior to the snow measurements to obtain a high-resolution snow surface topography (Williams et al., 2013). Also, additional snow thickness transects with the Magna Probe might allow to identify different pat- terns of snow accumulation rates (e.g., snow dunes) across thefloe, which in turn might indicate areas of dif- ferent snow property evolution.
Comparing the ice cover in the Weddell Sea with, for example, the Ross Sea, where the sea ice area can also be subdivided into different ice-age classes, suggests a possible transfer of our outlined assumptions from the Weddell to the Ross Sea area. However, the snow properties of FYS/MYS and in particular their spatial variability in the Ross Sea differ crucially from those in the Weddell Sea as, generally, snow properties are predominantly a function of the atmospheric conditions in the respective area. This leads to higher snow accumulation rates in the Ross Sea during winter time (Matthew Sturm et al., 1998). Also, the snow density tends toward higher mean values in the Ross Sea, while a higher range of variability is observed in the Weddell Sea accompanied by a larger mean and value range of snow grain sizes compared to the Ross Sea sector (Massom et al., 1997). Thus, our study suggests that the large spatial variability in snow accumulation rates and the examined snow properties associated with seasonal snow structure changes (e.g., snow metamorphism) prevent an upscaling to a pan-Antarctic scale. Instead, to describe snow properties beyond the regional scale, comprehensive initial ice conditions, as for example, ice type and typical local atmospheric conditions, needs to be considered.
5. Conclusions
This case study presents a comprehensive data set on snow properties covering different snow regimes in the Weddell Sea pack ice during austral winter. An improved understanding of the variability of snow properties on different spatial scales and the quantification of the main driver determining the snow property variability are needed to further understand how satellite remote sensing data relate to Antarctic sea ice mass and energy budget variations in the ice-covered Southern Ocean.
The presented observations show the different compositions of seasonal and perennial snow associated with substantial differences in the number of layers highlighting the need to distinguish between seasonal and perennial snow regimes. Analyzing the full vertical snow column, the snow property variability tends to higher values in MYS than in FYS, suggesting more MY subclasses for calculations of the Antarctic sea ice energy and mass budgets. In contrast, assuming that, for example, for the retrieval of snow depth using satellite microwave radiometry, not the snowpack in general but the uppermost part is of particular interest, there is no need for additional classifications, as the internal snowpack variability diminishes. However, low RSD of the snow density, in both FYS and MYS, reveal that the snow density can be neglected when analyzing the snowpack variability, even though its absolute value plays a crucial role for satellite remote sensing approaches of snow depth and sea ice thickness. Instead, the RSD analysis indicates that the variability in snow depth and snow stratigraphy, in particular the grain size distribution, are the main drivers for the variability of FYS and MYS properties.
When moving from regional tofloe-size scales, similar variability ranges (absoluteSD) of the studied snow properties become apparent on both scales, suggesting that the number of snow samples prevails over their widespread regional-scale distribution. In other words, a large number of measurements on a fewfloes are more crucial than covering a comparably large region with fewerfloe-scale measurements suggesting that regional-scale snow property variations can be well approximated with thefloe-scale data. However, the spatially heterogeneous variability in snow accumulation rates as well as in seasonal snow processes, as for example, snow metamorphism, obscures an upscaling of snow properties to beyond the regional basin scale toward pan-Antarctic estimates. Doing so, we suggest to include a comprehensive analysis of processes at (1) the air/snow interface, that is, typical local atmospheric conditions, and (2) the snow/ice interface for proper estimates of energy and matterfluxes beyond the interface. Considering seasonal large-scale processes and its variations between air, snow, and sea ice will be key to understand energy and mass budget variations on a pan-Antarctic scale.
References
Akitaya, E. (1974). Studies on depth hoar.Contributions. Institute of Low Temperature Science,26, 1–67.
Arndt, S., Meiners, K. M., Ricker, R., Krumpen, T., Katlein, C., & Nicolaus, M. (2017). Influence of snow depth and surfaceflooding on light transmission through Antarctic pack ice.Journal of Geophysical Research: Oceans,122, 2108–2119. https://doi.org/10.1002/2016JC012325 Arndt, S., Willmes, S., Dierking, W., & Nicolaus, M. (2016). Timing and regional patterns of snowmelt on Antarctic sea ice from passive
microwave satellite observations.Journal of Geophysical Research: Oceans,121, 5916–5930. https://doi.org/10.1002/2015JC011504 Brandt, R. E., Warren, S. G., Worby, A. P., & Grenfell, T. C. (2005). Surface albedo of the Antarctic sea ice zone.Journal of Climate,18(17),
3606–3622. https://doi.org/10.1175/Jcli3489.1
Calonne, N., Flin, F., Morin, S., Lesaffre, B., du Roscoat, S. R., & Geindreau, C. (2011). Numerical and experimental investigations of the effective thermal conductivity of snow.Geophysical Research Letters,38, L23501. https://doi.org/10.1029/2011GL049234
Cavalieri, D. J., Markus, T., Ivanoff, A., Miller, J. A., Brucker, L., Sturm, M., et al. (2012). A comparison of snow depth on sea ice retrievals using airborne altimeters and an AMSR-E simulator.IEEE Transactions on Geoscience and Remote Sensing,50(8), 3027–3040. https://doi.org/
10.1109/tgrs.2011.2180535
Colbeck, S. C. (1982). An overview of seasonal snow metamorphism.Reviews of Geophysics,20(1), 45–61. https://doi.org/10.1029/
RG020i001p00045
Comiso, J. C., Cavalieri, D. J., & Markus, T. (2003). Sea ice concentration, ice temperature, and snow depth using AMSR-E data.IEEE Transactions on Geoscience and Remote Sensing,41(2), 243–252. https://doi.org/10.1109/Tgrs.2002.808317
Comiso, J. C., Grenfell, T. C., Lange, M., Lohanick, A. W., Moore, R. K., & Wadhams, P. (1992). Microwave remote sensing of the Southern Ocean ice cover. InMicrowave remote sensing of sea ice(pp. 243–259). Washington, DC: American Geophysical Union. https://doi.org/10.1029/
GM068p0243
Eicken, H., Fischer, H., & Lemke, P. (1995). Effects of the snow cover on Antarctic sea ice and potential modulation of its response to climate change.Annals of Glaciology,21, 369–376. https://doi.org/10.3189/S0260305500016086
Eicken, H., Lange, M. A., Hubberten, H. W., & Wadhams, P. (1994). Characteristics and distribution patterns of snow and meteoric ice in the Weddell Sea and their contribution to the mass balance of sea ice.Annales Geophysicae-Atmospheres Hydrospheres and Space Sciences, 12(1), 80–93. https://doi.org/10.1007/s00585-994-0080-x
Fierz, C., Armstrong, R. L., & Durand, Y. (2009). International classification for seasonal snow on the ground,Technical Documents in Hydrology.
International Association of Cryospheric Sciences/UNESCO.
Fritsen, C. H., Ackley, S. F., Kremer, J. N., & Sullivan, C. W. (1998). Flood-freeze cycles and microalgal dynamics in Antarctic pack ice. In M. P. Lizotte & K. R Arrigo (Eds.),Antarctic sea ice: biological processes, interactions and variability(Vol. 73, pp. 1–21). Washington, DC:
American Geophysical Union. https://doi.org/10.1029/AR073p0001
Haas, C., Nicolaus, M., Willmes, S., Worby, A., & Flinspach, D. (2008). Sea ice and snow thickness and physical properties of an icefloe in the western Weddell Sea and their changes during spring warming.Deep Sea Research Part II,55(8–9), 963–974. https://doi.org/10.1016/J.
Dsr2.2007.12.020
Haas, C., Thomas, D. N., & Bareiss, J. (2001). Surface properties and processes of perennial Antarctic sea ice in summer.Journal of Glaciology, 47(159), 613–625. https://doi.org/10.3189/172756501781831864
Hunkeler, P. A., Hendricks, S., Hoppmann, M., Farquharson, C. G., Kalscheuer, T., Grab, M., et al. (2016). Improved 1D inversions for sea ice thickness and conductivity from electromagnetic induction data: Inclusion of nonlinearities caused by passive bucking.Geophysics,81(1), Wa45–Wa58. https://doi.org/10.1190/Geo2015-0130.1
Jeffries, M. O., Worby, A. P., Morris, K., & Weeks, W. F. (1997). Seasonal variations in the properties and structural composition of sea ice and snow cover in the Bellingshausen and Amundsen Seas, Antarctica.Journal of Glaciology,43(143), 138–151. https://doi.org/10.3189/
S0022143000002902
Kern, S., & Ozsoy-Çiçek, B. (2016). Satellite remote sensing of snow depth on Antarctic sea ice: An inter-comparison of two empirical approaches.Remote Sensing,8(6), 450. https://doi.org/10.3390/rs8060450
Kern, S., Ozsoy-Çiçek, B., & Worby, A. P. (2016). Antarctic sea-ice thickness retrieval from ICESat: Inter-comparison of different approaches.
Remote Sensing,8(7), 538. https://doi.org/10.3390/rs8070538
König-Langlo, G. (2013). Meteorological observations during POLARSTERN cruise ANT-XXIX/6 (AWECS), PANGAEA. https://doi.org/10.1594/
PANGAEA.819610
Lemke, P. (2014). The expedition of the research vessel“Polarstern”to the Antarctic in 2013 (ANT-XXIX/6),Berichte zur Polar-und Meeresforschung=Reports on polar and marine research, 679. https://doi.org/10.2312/BzPM_0679_2014
Light, B., Grenfell, T. C., & Perovich, D. K. (2008). Transmission and absorption of solar radiation by Arctic sea ice during the melt season.
Journal of Geophysical Research,113, C03023. https://doi.org/10.1029/2006JC003977
Maksym, T., & Markus, T. (2008). Antarctic sea ice thickness and snow-to-ice conversion from atmospheric reanalysis and passive microwave snow depth.Journal of Geophysical Research,113, C02S12. https://doi.org/10.1029/2006JC004085
Markus, T., & Cavalieri, D. J. (1998). Snow depth distribution over sea ice in the Southern Ocean from satellite passive microwave data. In M. O. Jeffries (Ed.),Antarctic sea ice: physical processes, interactions and variability(Vol. 74, pp. 19–39). Washington, DC: American Geophysical Union.
Martinson, D. G., & Iannuzzi, R. A. (1998). Antarctic Ocean-ice interaction: Implications from ocean bulk property distributions in the Weddell Gyre. In M. Jeffries (Ed.),Antarctic sea ice: Physical processes, interactions and variability, Antarctic Research Series(Vol. 74, pp. 243–271).
Boston: American Geophysical Union. https://doi.org/10.1029/AR074p0243
Massom, R. A., Drinkwater, M. R., & Haas, C. (1997). Winter snow cover on sea ice in the Weddell Sea.Journal of Geophysical Research,102(C1), 1101–1117. https://doi.org/10.1029/96JC02992
Massom, R. A., Eicken, H., Hass, C., Jeffries, M. O., Drinkwater, M. R., Sturm, M., et al. (2001). Snow on Antarctic Sea ice.Reviews of Geophysics, 39(3), 413–445. https://doi.org/10.1029/2000RG000085
Nicolaus, M., Haas, C., & Willmes, S. (2009). Evolution offirst-year and second-year snow properties on sea ice in the Weddell Sea during spring-summer transition.Journal of Geophysical Research,114, D17109. https://doi.org/10.1029/2008JD011227
Parish, T. R. (1983). The influence of the Antarctic Peninsula on the windfield over the western Weddell Sea.Journal of Geophysical Research, 88(C4), 2684–2692. https://doi.org/10.1029/JC088iC04p02684
Paul, S., Hendricks, S., Ricker, R., Kern, S., & Rinne, E. (2018). Empirical parametrization of Envisat freeboard retrieval of Arctic and Antarctic sea ice based on CryoSat-2: Progress in the ESA Climate Change Initiative.The Cryosphere,12(7), 2437–2460. https://doi.org/10.5194/tc-12-2437-2018 Paul, S., Willmes, S., Hoppmann, M., Hunkeler, P. A., Wesche, C., Nicolaus, M., et al. (2015). The impact of early-summer snow properties on
Antarctic landfast sea-ice X-band backscatter.Annals of Glaciology,56(69), 263–273. https://doi.org/10.3189/2015AoG69A715 Acknowledgments
We gratefully acknowledge the support of the cruise leader Peter Lemke, all involved scientists, and the captain and crew of R/V Polarstern during expedition ANT-29/6 (AWECS).
Especially, we thank the
interdisciplinary sea ice group on board, including Stefan Hendricks and Priska Hunkeler, for the provided GEM-2 sea ice thickness data and Seth White for the provided Magna Probe snow depth data. This work was supported by the German Research Council (DFG) in the framework of the priority program
“Antarctic Research with comparative investigations in Arctic ice areas” (SPP1158) by grants to projects“Snow Cover impacts on Antarctic Sea Ice (SCASI)”(NI1096/5-1 and KA2694/7-1) and“Sea Ice Mass Balance influenced by Ice Shelves (SIMBIS)”(HE2740/12 and NI1092/2), the Alfred-Wegener-Institut Helmholtz-Zentrum für Polar- und Meeresforschung, and the University of Trier. All presented snow data are available at PANGAEA (snow temperature: https://doi.pangaea.de/
10.1594/PANGAEA.881716, snow density: https://doi.pangaea.de/
10.1594/PANGAEA.881717, and snow stratigraphy: https://doi.pangaea.de/
10.1594/PANGAEA.881713).
Perovich, D. K. (1996). The optical properties of sea IceRep., 25 pp pp, U.S. Cold Reg. Res. and Eng. Lab. Monogr., Hannover.
Perovich, D. K. (2007). Light reflection and transmission by a temperate snow cover.Journal of Glaciology,53(181), 201–210. https://doi.org/
10.3189/172756507782202919
Perovich, D. K., Jones, K. F., Light, B., Eicken, H., Markus, T., Stroeve, J., & Lindsay, R. (2011). Solar partitioning in a changing Arctic sea-ice cover.
Annals of Glaciology,52(57), 192–196. https://doi.org/10.3189/172756411795931543
Ricker, R., Hendricks, S., Helm, V., Skourup, H., & Davidson, M. (2014). Sensitivity of CryoSat-2 Arctic sea-ice freeboard and thickness on radar- waveform interpretation.The Cryosphere,8(4), 1607–1622. https://doi.org/10.5194/tc-8-1607-2014
Ricker, R., Hendricks, S., Perovich, D. K., Helm, V., & Gerdes, R. (2015). Impact of snow accumulation on CryoSat-2 range retrievals over Arctic sea ice: An observational approach with buoy data.Geophysical Research Letters,42, 4447–4455. https://doi.org/10.1002/2015GL064081 Schwegmann, S., Rinne, E., Ricker, R., Hendricks, S., & Helm, V. (2016). About the consistency between Envisat and CryoSat-2 radar freeboard
retrieval over Antarctic sea ice.The Cryosphere,10(4), 1415–1425. https://doi.org/10.5194/tc-10-1415-2016
Sommerfeld, R., & LaChapelle, E. (1970). The classification of snow metamorphism.Journal of Glaciology,9(55), 3–18. https://doi.org/10.1017/
S0022143000026757
Sturm, M., Holmgren, J., Konig, M., & Morris, K. (1997). The thermal conductivity of seasonal snow.Journal of Glaciology,43(143), 26–41.
https://doi.org/10.1017/S0022143000002781
Sturm, M., & Massom, R. A. (2017). Snow & sea ice. In D. Thomas (Ed.),Sea ice(3rd ed., pp. 65–109). New York (UAS) & Oxford (UK):
Wiley-Blackwell.
Sturm, M., Morris, K., & Massom, R. (1998). The winter snow cover of the West Antarctic pack ice: Its spatial and temporal variability. In M. O. Jeffries (Ed.),Antarctic sea ice physical processes, interactions and variability, Antarctic Research Series(Vol. 74, pp. 1–18). Washington, DC: American Geophysical Union.
Tison, J. L., Schwegmann, S., Dieckmann, G., Rintala, J. M., Meyer, H., Moreau, S., et al. (2017). Biogeochemical impact of snow cover and cyclonic intrusions on the winter Weddell Sea Ice Pack.Journal of Geophysical Research: Oceans,122, 9548–9571. https://doi.org/10.1002/
2017JC013288
Turner, J., Hosking, J. S., Bracegirdle, T. J., Marshall, G. J., & Phillips, T. (2015). Recent changes in Antarctic sea ice.Philosophical Transactions of the Royal Society of London A: Mathematical, Physical and Engineering Sciences,373(2045), 20140163. https://doi.org/10.1098/
rsta.2014.0163
Williams, G. D., Maksym, T., Kunz, C., Kimball, P., Singh, H., Wilkinson, J., et al. (2013). Beyond point measurements: Sea icefloes characterized in 3-D.Eos, Transactions American Geophysical Union,94(7), 69–70. https://doi.org/10.1002/2013EO070002
Willmes, S., Bareiss, J., Haas, C., & Nicolaus, M. (2006). The importance of diurnal processes for the seasonal cycle of sea-ice microwave brightness temperatures during early summer in the Weddell Sea, Antarctica.Annals of Glaciology,44, 297–302. https://doi.org/10.3189/
172756406781811817
Willmes, S., Haas, C., Nicolaus, M., & Bareiss, J. (2009). Satellite microwave observations of the interannual variability of snowmelt on sea ice in the Southern Ocean.Journal of Geophysical Research,114, C03006. https://doi.org/10.1029/2008JC004919
Willmes, S., Nicolaus, M., & Haas, C. (2014). The microwave emissivity variability of snow coveredfirst-year sea ice from late winter to early summer: A model study.The Cryosphere,8(3), 891–904. https://doi.org/10.5194/tc-8-891-2014
Zatko, M. C., & Warren, S. G. (2015). East Antarctic sea ice in spring: Spectral albedo of snow, nilas, frostflowers and slush, and light-absorbing impurities in snow.Annals of Glaciology,56(69), 53–64. https://doi.org/10.3189/2015AoG69A574