L E T T E R Intraspecific trait variation and trade-offs within and across populations of a toxic dinoflagellate
Karen M. Brandenburg,1* Sylke Wohlrab,2,3Uwe John,2,3 Anke Kremp,4Jacqueline Jerney,4 Bernd Krock2and
Dedmer B. Van de Waal1
Abstract
Intraspecific trait diversity can promote the success of a species, as complementarity of functional traits within populations may enhance its competitive success and facilitates resilience to changing environmental conditions. Here, we experimentally determined the variation and relationships between traits in 15 strains of the toxic dinoflagellate Alexandrium ostenfeldii derived from two populations. Measured traits included growth rate, cell size, elemental composition, nitrogen uptake kinetics, toxin production and allelochemical potency. Our results demonstrate substantial variation in all analysed traits both within and across populations, particularly in nitrogen affin- ity, which was even comparable to interspecific variation across phytoplankton species. We found distinct trade-offs between maximum nitrogen uptake rate and affinity, and between defensive and competitive traits. Furthermore, we identified differences in trait variation between the genetically similar populations. The observed high trait variation may facilitate development and resilience of harmful algal blooms under dynamic environmental conditions.
Keywords
Eco-evolutionary dynamics, biodiversity, population ecology, harmful algal blooms, Alexandrium ostenfeldii.
Ecology Letters(2018)
INTRODUCTION
Ecosystem functioning is often linked to biodiversity, with enhanced productivity and stability in systems with higher species richness (Cardinale et al. 2006; Ptacnik et al. 2008;
Cardinale 2011; Schindleret al.2015). By increasing the num- ber of species in the community, complementarity of func- tional traits within the system may increase, resulting in higher resource use efficiencies, enhanced resistance to con- sumers and resilience to environmental changes (MacArthur 1955; Hooper et al. 2005; Bolnick et al. 2011; Cardinale 2011). Similarly, a high intraspecific trait diversity, as well as variation within traits may facilitate population growth by enhanced complementarity (Violle et al. 2012). Moreover, high standing genetic and trait variation within populations allows species to adapt more quickly to changes in the envi- ronment (Barrett & Schluter 2008). This variation is ulti- mately responsible for the diversification and evolutionary adaptation of species, which can even happen on ecological time scales (Carroll et al. 2007; Pelletier et al. 2009). Espe- cially with respect to climate change, intraspecific trait varia- tion could modulate species’ responses to changing environments and buffer biodiversity losses (Reusch et al.
2005; Albertet al.2010; Sj€oqvist & Kremp 2016).
Phytoplankton populations can possess a very high genetic diversity with substantial intraspecific trait variation (Mar- anda et al. 1985; Medlin et al. 2000; Burkholder & Glibert
2006; Alpermann et al.2010; Godhe et al. 2016). Specifically, harmful algal bloom (HAB) populations have been shown to exhibit a high variation in the expression of traits (Tillmann et al. 2009; Hakanenet al. 2014; John et al.2015). HAB spe- cies are known to possess specialized functional traits, includ- ing toxin production, as well as N2 fixation and mixotrophy (Fogg 1969; Hallegraeff 1993; Burkholder et al. 2008), which are expected to contribute to the success of HAB populations (Paerl & Huisman 2009; Litchman et al. 2010; Carey et al.
2012). Among common HAB-forming phytoplankton groups are dinoflagellates, a ubiquitous group of protists that particu- larly contributes to primary production in coastal waters (Falkowski & Knoll 2007). The toxic dinoflagellate genus Alexandriumis among the most common HAB species, impos- ing an eminent threat to human health and ecosystem func- tioning by causing shellfish poisoning and fish kills (Cembella et al. 2002; Durbin et al. 2002; Anderson et al. 2012). Like most HAB species, Alexandrium populations possess a high functional trait diversity (Ogata et al. 1987; Cembella et al.
2002; Masseret et al. 2009; Tillmann et al. 2009; Alpermann et al.2010). Indeed, strains can substantially differ in the pro- duction of paralytic shellfish poisoning (PSP) toxins, with some strains even lacking the ability to produce these toxins (John et al. 2014; Murray et al. 2015). Furthermore, some Alexandrium species and strains can produce two additional types of neurotoxins; gymnodimines (GYM) and spirolides (SPX; Cembella et al.2000; Kremp et al. 2014; Van de Waal
1Department of Aquatic Ecology, Netherlands Institute of Ecology (NIOO- KNAW), Droevendaalsesteeg 10, 6708 PB Wageningen, The Netherlands
2Department of Ecological Chemistry, Alfred Wegener Institute (AWI), Helmholtz Centre for Polar and Marine Research, Am Handelshafen 12, 27570 Bremerhaven, Germany
3Helmholtz-Institut f€ur Funktionelle Marine Biodiversit€at (HIFMB), Ammerl€ander Heerstraße 231, 23129 Oldenburg, Germany
4SYKE Marine Research Laboratory, Agnes Sj€obergin katu 2, FI-00790 Helsinki, Finland
*Correspondence: E-mail: k.brandenburg@nioo.knaw.nl
©2018 The Authors Ecology Letters published by CNRS and John Wiley & Sons Ltd
et al. 2015), as well as allelopathic compounds that are excreted from the cell and can lyse competing phytoplankton species and small protozoan grazers (Tillmann & John 2002;
Tillmannet al.2007).
The high functional trait variation within Alexandriumpop- ulations can partly be attributed to their life histories. In addi- tion to vegetative growth, Alexandrium reproduces sexually and forms resting cysts, allowing recombination of genetic material (Andersonet al.2012). Cysts may hatch continuously throughout the vegetative growth season and thereby supply novel genotypes to the water column (Genovesi et al. 2009;
Angles et al. 2012; Kremp et al. 2015). This mechanism may contribute to a high genotypic diversity, and support a high variation in traits within a population (Alpermann et al.
2009). High trait variation is further enhanced by shifting selection pressures that can occur during toxic algal blooms (Driscoll et al. 2015). For instance, before the onset of a bloom, interactions occur mainly interspecifically, and compe- tition with other phytoplankton species together with a high grazing pressure may select for defensive traits, such as toxin and allelochemical production. During the development of a bloom, however, when population densities increase and nutrients become depleted (Brandenburg et al. 2017), intraspecific interactions become more important, and selec- tion may shift towards higher resource use efficiencies. Such low nutrient conditions may support the success of non-toxic or non-allelopathic strains, as production of secondary metabolites involves biochemical and energetic costs (Pohnert et al.2007). Consequently, populations may exhibit intraspeci- fic trade-offs, for instance between defensive and competitive traits. Trade-offs between functional traits stand at the base of eco-evolutionary dynamics, and are key drivers underlying phenotypic diversity and variation, as they constrain trait evo- lution and thereby prevent selection for a ‘super-clone’.
Trade-offs furthermore facilitate coexistence of species and strains, and are important for maintaining diversity (Tilman 1982; Grover 1997; Kneitel & Chase 2004; Blows & Hoffmann 2005; Van de Waal et al. 2011). The variation in selection pressures during a bloom can concede and maintain a high genetic and functional diversity within a population, and result in genetic differentiation over very short time scales (Richlenet al.2012). However, empirical data on intraspecific trade-offs in HAB populations is still lacking.
Here, we assessed the variation in eight traits in 15 isolates from two geographically distinct toxicAlexandrium ostenfeldii populations.A. ostenfeldiiis a globally widespread dinoflagel- late species that can produce several types of neurotoxins (PSP, GYM and SPX), as well as allelochemicals (Kremp et al. 2009; Van de Waal et al. 2015). It generally occurs in background levels, but may also cause dense harmful blooms in brackish waters including embayments, creeks and coastal marine ecosystems (Kremp et al. 2009). One of the studied populations is relatively large and already established between 8000 and 3000 BP in the Baltic Sea (Tahvanainenet al.2012).
The other population is much smaller and only established recently in a small creek in the Netherlands (Burson et al.
2014; Van de Waalet al.2015). For all isolates, we first deter- mined general traits such as growth rate, cell size and stoi- chiometry; nitrogen (N) acquisition traits including the
maximum N uptake rate and affinity (since N is the limiting nutrient during summer blooms at both locations); and defen- sive traits including production of toxins (i.e. PSP toxins, GYM and SPX), as well as allelopathic potency, and after- wards tested for putative trade-offs. We aim to assess how dif- ferent environments affect diversification of traits, and how physiological constraints lead to intraspecific trade-offs.
Specifically, we expect a higher trait variation in the longer established Baltic Sea population as this population had more time to diversify, and we predict selection of defensive traits (i.e. toxin quota and allelochemical potency) in the recently established Dutch population as this would support its coloni- sation. Moreover, we anticipate distinctive trade-offs between traits that scale with size, such as growth rate and cell volume, as well as between defensive and competitive traits. Lastly, we expect a positive relationship between relative phosphorus (P) content and growth rate following the growth rate hypothesis, which predicts that cells require more P in order to grow fas- ter (Elseret al.1996, 2003; Sterner & Elser 2002).
MATERIAL AND METHODS Culturing
Alexandrium ostenfeldiistrains from the Netherlands were iso- lated in summer blooms from the Ouwerkerkse Kreek (51˚620N, 3˚990E) in 2015 and 2016.A. ostenfeldii strains from the F€ogl€o Archipelago (Aland) in the Northern Baltic Sea (60°050N, 20°310E) were isolated from a late summer bloom in 2015. Both geographic populations are phylogenetically clo- sely related (Van de Waal et al. 2015) representing a distinct group of estuarineA. ostenfeldii (group I; Krempet al.2014).
Clonal isolates were genotyped using six microsatellite mark- ers (Nagai et al. 2014), which confirmed that strains repre- sented different haplotypes (Table S1). We randomly selected 15 A. ostenfeldii strains (five from the Netherlands in 2015, five from the Netherlands in 2016, and five from the Baltic Sea), which we cultured in ½K – medium (after Kelleret al.
1987) with 0.2 lm sterilized North Sea water adjusted to a salinity of 10. Cultures were grown at a temperature of 18 °C and an incident light intensity of 85lmol photons m2 s1, with a light:dark cycle of 16:8 h. First, the cultures were accli- mated to experimental conditions for 2 weeks (approximately five generations), after which they were transferred to 500 mL Erlenmeyer flasks using four biological replicates. Cultures were grown as batch starting at a cell density of 400 cells mL1. Each replicate was grown for three to five generations, and cultures were harvested for the assessment of traits while in exponential growth phase at densities of approximately 5.0 9103 cells mL1.
Growth rate and cell size
To estimate cell densities, 5 mL samples were taken every sec- ond or third day and fixed with neutral Lugol’s iodine solu- tion (Lugol) to a final concentration of 1%. Samples were stored in the dark at 4°C until analysis. A. ostenfeldii cells were counted on an inverted microscope (DMI 4000B; Leica Microsystems CMS GmbH, Mannheim, Germany). Maximum
growth rates (l) were calculated for each replicate by fitting an exponential function through cell counts over time (exclud- ing potential lag phases; see also Fig. S1 and Table S2), fol- lowing:
Nt¼N0explt
where Ntrefers to the cell concentrations at time t, and N0to the cell concentrations at the start of each experiment (or exponential growth phase).
To establish cell size data, Lugol fixed samples from the last day were analysed using a FlowCam (Fluid Imaging Tech- nologies, Yarmouth, ME, USA), where surface area was mea- sured and used to calculate cell volume based on a sphere.
For each replicate, at least 100 cells were measured.
Elemental composition
Cellular carbon (C), nitrogen (N) and phosphorus (P) were determined at the end of the experiment in 20 mL of culture material collected on a prewashed (100 mL distilled water) glass microfiber filter (Whatman GF/F, Maidstone, UK). Fil- ters were dried overnight at 60°C and stored in the dark until further analyses. For C and N analyses, a subsample (14%) of each filter was folded into a tin cup and analysed on a FLASH 2000 organic elemental analyser (Brechbueler Incorporated, Interscience B.V., Breda, the Netherlands). Cellular P was analysed by combusting the remainder of the filter (86%) for 30 min at 550°C in Pyrex glass tubes, followed by a digestion step with 5 mL persulfate (2.5%) for 30 min at 120°C. This digested solution was measured for PO43 on a QuAAtro39 AutoAnalyzer (SEAL Analytical Ltd., Southampton, UK).
Allelopathic potency
The allelopathic potency of the A. ostenfeldii cultures was determined after Tillmann et al. (2009), using a short-term bioassay with the cryptophyte Rhodomonas salina as target species. Lytic effects were quantified by adding A. ostenfeldii filtrate to anR. salina culture at concentrations reflecting dif- ferent cell densities, and subsequently assess theA. ostenfeldii cell densities required to reduce the R. salina abundance by 50%.
To collect the filtrate, 200 mL of A. ostenfeldiiculture from the end of the experiment was centrifuged at 168gfor 10 min (Thermo Scientific SL16, Thermo Fisher Scientific, Langensel- bold, Germany). Hereafter, the cell pellet was used for the N uptake bioassays (see below) and the filtrate was filtered over a sterile 0.2lm cellulose acetate filter and stored at 20°C until further analyses.
Cell counts from the end of the experiment were used to estimate the cell densities of A. ostenfeldiiassociated with the filtrate. From the filtrate, eight dilutions were made corre- sponding to a range of 0.3–89103cells mL1 in vials of 4 mL. Medium without filtrate was used during each run as a control.
For the bioassays, 0.1 mL ofR. salinaculture was added to each vial containingA. ostenfeldii filtrate reaching a final cell density of 109103 cells mL1. The samples were incubated for 24 h under the same culture conditions as the experiment.
At the end of the incubations, R. salina cells were counted using an automated cell counter (Beckman Coulter Multisizer 3, Indianopolis, IN, USA).
In order to estimate the EC50 for each strain (i.e. the A.
ostenfeldiicell density leading to a 50% decline inR salinacell densities), the following function was fitted through R. salina counts as a function of log-transformedA. ostenfeldiicell con- centrations associated with the filtrate (Fig. S2):
Nfinal¼ Ncontrol
1þECx50h
where Nfinalis the final target cell density ofR. salinausingA.
ostenfeldiifiltrates, Ncontrolis the final target cell density ofR.
salina in control samples, x is the log-transformed A. osten- feldiicell density, and EC50and h are fitted parameters, where h is the Hill coefficient.
Nitrogen uptake kinetics
Determination of the N uptake kinetics of the different A.
ostenfeldii strains was done using 15N bioassays, after Moschonas (2015). Centrifuged cell pellets of A. ostenfeldii were re-suspended in medium lacking N and incubated under experimental culture conditions for 24 h.
Hereafter, samples for cell counts were taken and the A.
ostenfeldii culture was divided and transferred to 7950 mL tubes. Afterwards, 15N labelled NO3 (Sigma Aldrich, Stein- heim am Albuch, Germany, 10 atom % 15N) was added to yield the following concentrations: 0.1, 0.3, 0.6, 1, 3, 10 lmol L1. For everyA. ostenfeldiistrain, a control without addition of15N labelled NO3was taken in order to estimate background 15N values. The samples were incubated for 1 h under the same culture conditions, and afterwards filtered through glass microfiber filters (GF/F; Whatman, Maidstone, UK). Filters were dried overnight at 60°C and stored in the dark until further analyses.
A subsample (14%) of every filter was folded in a tin cup and analysed on an elemental analyser (Flash 2000, Thermo- scientific, Langenselbold, Germany) coupled to an isotope ratio mass spectrometer (IRMS, Thermoscientific), and d15N values were calculated as the difference in 15N abundance between the sample and a reference gas (with 0.366 atom%
15N).
The d15N values were subsequently used to calculate N uptake rates using the equation from Dugdale & Wilkerson (1986):
q¼ 15NðtÞsink15Nðt0Þsink
15Nðt0Þsource15Nðt0Þsink
tPON
where q is the absolute N uptake rate (in lmol N L1h1),
15N(t0)source is the isotopic ratio of the enriched dissolved N pool (in atom%), 15N(t0)sink is the natural abundance of 15N (in atom%), 15N(t)sinkis the abundance of 15N in the sample after the incubation (in atom%), t is the incubation time (in hours) and PON, the particulate organic nitrogen concentra- tion (inlmol N L1).
The absolute N uptake rates calculated for each concentra- tion of NO3 can then be used to estimate the N uptake
kinetics for each A. ostenfeldii strain. To this end, a Michae- lis-Menten function was fitted through all data points within the bioassays for each replicate of each strain:
q¼ VmaxNO3 K1=2þNO3
whereq (in lmol N L1h1) is the N uptake rate,Vmax the maximum uptake rate (inlmol N L1 h1),K1/2 the half sat- uration constant (inlmol N L1) and NO3 the nitrate con- centration. Subsequently, Vmax was divided by the cell densities at the end of each experiment and units were converted to pmol N cell1 day1.
Toxin sampling and analyses
Samples for toxin analyses (PSP toxins and cyclic imines) were taken by filtration of 20 mL of A. ostenfeldii culture over glass microfiber filters (GF/F, Whatman, Maidstone, UK), which were stored at20 °C until further analysis. PSP toxins were determined by ion pair liquid chromatography coupled to post-column derivatization and fluorescence detection, as described in Krock et al. (2007) and Van de Waal et al.
(2015). The cyclic imine toxin measurements (SPX and GYM) were performed on an Agilent 1100 LC liquid chromatograph (Waldbronn, Germany) coupled to a 4000 Q Trap triple-quad- rupole mass spectrometer (AB-Sciex, Darmstadt, Germany) with a Turbo V ion source. Toxins were quantified by external calibration curves of SPX-1 and GYM A with standard solu- tions ranging from 10 to 1000 pglL1, each. Other SPXs and GYMs for which no standards are available were cali- brated against the SPX-1 and GYM A calibration curve, respectively, and expressed as SPX-1 or GYM A equivalents.
For further details, also see Van de Waalet al.(2015).
Statistical analyses
Statistical analyses were performed in R version 3.2.2 (R Core Team 2015). For the measured traits across all strains, coeffi- cients of variation (CV) were calculated as the ratio of the stan- dard deviation to the mean. Significant differences in the expression of traits between the three groups ofA. ostenfeldii strains were determined using a one-way ANOVA, including all replicates, followed by post hoc comparison of the means using Tukey’s HSD. Trade-offs and relationships were recognized using a linear regression between the log-transformed trait val- ues, including all replicates. Differentiation of traits within the distinct populations was assessed with the R package ‘vegan’
(Oksanenet al. 2017), where the multivariate homogeneity of group dispersions was analysed. Significant differences between the groups were determined using a permutation test.
RESULTS
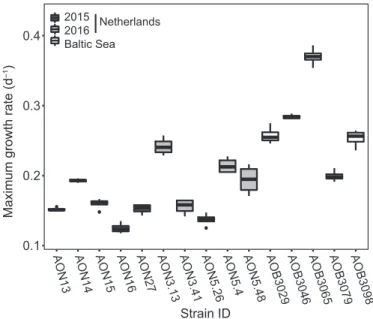
We observed substantial variation of the analysed traits among the 15 studiedA. ostenfeldiistrains within and among their cor- responding populations. Maximum growth rates ranged from 0.12 to 0.39 d1in different strains (Figs 1 and 2a), and cell vol- umes from 7.5 to 32.49 103lm3 (Fig. 2d), with CVs of 0.32 and 0.38, respectively. PSP toxin quotas varied from 1.1 to
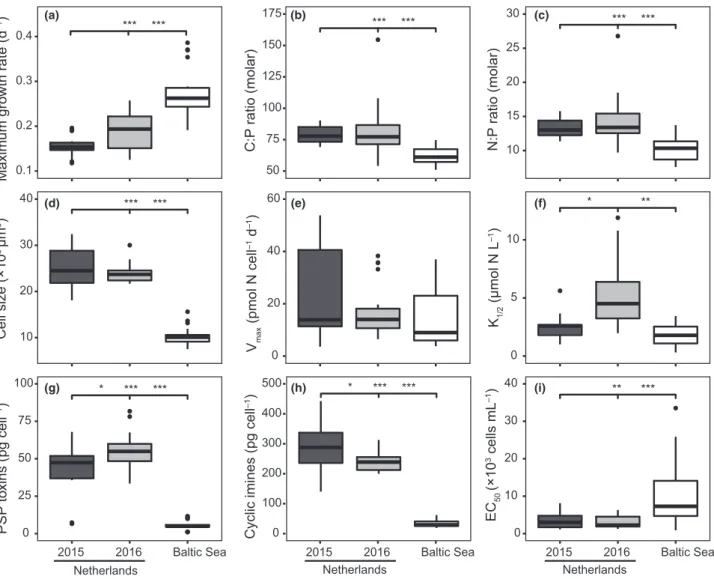
81.7 pg cell1 (CV 0.73) and cyclic imine toxin quotas from 18.8 to 443 pg cell1(CV 0.66; Fig. 2g–h; Fig. S3). Allelopathic potencies also varied strongly between the strains, with esti- mated EC50 values from 0.9 to 33.5 9103 A. ostenfeldii cells mL1(CV 1.09; Fig. 2i). For N uptake kinetics,K1/2val- ues ranged from 0.3 to 11.9lmol N L1 (CV 0.8), and Vmax values from 3.6 to 5.4 pmol N cell1 day1(CV 0.74; Fig. 2e– f). Moreover, we also observed variation in the elemental stoi- chiometry of the different strains, ranging from 5.4 to 7.2 for cellular C:N ratios (CV 0.08; data not shown), from 50.9 to 154.6 for cellular C:P ratios (CV 0.21) and from 7.6 to 18.5 for cellular N:P ratios (CV 0.23; Fig. 2b–c).
Significant differences in the expression of traits between the Dutch and Baltic Sea A. ostenfeldii populations were found for growth rate (P <0.001), cell size (P <0.001), C:P ratio (P <0.001), N:P ratio (P<0.001), PSP toxin quotas (P <0.001), cyclic imine toxin quotas (P <0.001) and allelo- pathic potencies (P <0.01; Fig. 2). Differences were less pro- nounced for N uptake kinetics, with significant differences only between the Baltic Sea population and the 2016 Dutch population forK1/2(P <0.01; Fig. 2). Strains from the Dutch population isolated in different years were generally similar in their trait expression. Significant differences were only found for PSP toxin quotas (P <0.01), cyclic imine toxin quotas (P <0.05) andK1/2(P< 0.05; Fig. 2).
Using non-metric multidimensional scaling in an ordination plot we could define two distinct clusters that clearly sepa- rated the two geographically distinctA. ostenfeldiipopulations (Fig. 3a). There was more variation in the expression of traits within the Baltic Sea population as compared to the Dutch population from both years together (Fig. 3b;P <0.001).
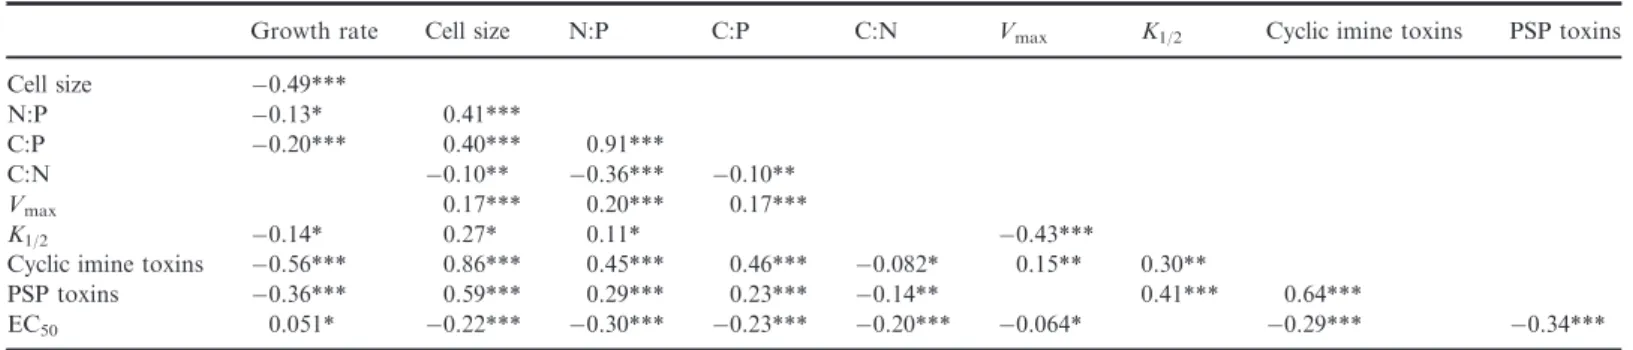
The analysed selection of traits showed various distinct rela- tionships. For instance, we observed strongest positive corre- lations between cell size and toxin quota and between PSP toxins and cyclic imines, while we observed negative
0.1 0.2 0.3 0.4
AON13 AON14 AON15 AON16 AON27 AON3.13 AON3.41 AON5.26 AON5.4 AON5.48 AOB3029AOB3046 AOB3065 AOB3079 AOB3098
Strain ID 2015
2016 Baltic Sea
Netherlands
Maximum growth rate (d–1)
Figure 1 Maximum growth rates of the different Alexandrium ostenfeldii strains (n=4), isolated from the Netherlands (2015, light grey; 2016, dark grey) and the Baltic Sea (white).
correlations between growth rate and cell size as well as between growth rate and toxin quota, which may represent putative trade-offs (Table 1). We note that these trade-offs were mainly driven by clustering of the two distinctA. osten- feldiipopulations (Fig. S4). Interestingly, we observed a very distinct trade-off between Vmax and K1/2, both within and across populations (Fig. 4).
DISCUSSION
Our results reveal large intraspecific variation in trait expres- sion within one phytoplankton species at two different levels, namely across and within two distinct populations. In fact, even within the recently established Dutch population, we found substantial variation in trait expression, which may point towards rapid diversification. We also observed distinct differences in the analysed traits between the two populations.
Overall, the Baltic Sea strains grew faster, were smaller, con- tained relatively more P and produced less toxins and
allelopathic compounds than the Dutch strains (Fig. 2). These particular traits are closely linked, and exhibit fundamental relationships and trade-offs.
The observed intraspecific trade-off between growth rate and cell size is in line with earlier findings on interspecific trade-offs, where smaller phytoplankton cells typically grew faster than larger cells (Banse 1976; Finkel et al. 2010). Fur- thermore, in order to grow faster, the growth rate hypothesis predicts that organisms should contain relatively more P, as more P-rich rRNA is required (Elser et al.1996, 2003; Sterner
& Elser 2002). The applicability of the growth rate hypothesis for phytoplankton, however, has been debated (Flynn et al.
2010). Phytoplankton may accumulate P under non-limiting growth conditions, as well as at limitations other than P (Elrifi & Turpin 1985; Hillebrandet al. 2013). Thus, the rela- tionship between growth rate and the relative cellular P con- tents will strongly depend on the growth-controlling factors.
Our results show intrinsic differences in growth rate between strains cultured under the same non-limiting conditions, with
***
***
0.1 0.2 0.3 0.4
Maximum growth rate (d–1) ******
50 75 100 125 150 175
C:P ratio (molar)
10 15 20 25 30
N:P ratio (molar)
***
***
10 20 30 40
Cell size (×103 µm3)
0 20 40 60
Vmax (pmol N cell–1 d–1)
* **
0 5 10
K1/2 (µmol N L–1)
* *** ***
0 25 50 75 100
2015 2016 Baltic Sea PSP toxins (pg cell–1)
0 100 200 300 400 500
2015 2016 Baltic Sea
Cyclic imines (pg cell–1) *****
0 10 20 30 40
2015 2016 Baltic Sea EC50 (×103 cells mL–1)
Netherlands Netherlands Netherlands
(a) (b) (c)
(d) (e) (f)
(g) (h) (i)
***
***
* *** ***
Figure 2Overview of traits assessed for the differentAlexandrium ostenfeldiipopulations (n=20), showing variation in (a) maximum growth rates, (b) C:P ratios, (c) N:P ratios, (d) cell sizes, (e)Vmax, (f)K1/2, (g) PSP toxin quotas, (h) cyclic imine toxin quotas and (i) EC50, isolated from the Netherlands (2015, light grey; 2016, dark grey) and the Baltic Sea (white). Significance differences between the populations are indicated by the asterisks (***P<0.001,
**P<0.01,*P<0.05).
a close association with the relative P contents (i.e. C:P ratio, Table 1). This was further confirmed by a positive correlation between growth rate and cellular P contents corrected to cell volume (R2 =0.16, P <0.01). Our results thus revealed an ideal test for the growth rate hypothesis, showing that the
Baltic SeaA. ostenfeldiicells contained relatively more P, and could indeed grow faster than Dutch isolates.
Faster growth and smaller cells were also associated with lower toxin quota inA. ostenfeldii (Table 1). Interestingly, the negative relationships between growth rate and PSP toxins (R2 =0.21, P <0.001) as well as cyclic imines (R2=0.52, P <0.001) remained significant after correcting for cell size.
This may represent a trade-off between toxin synthesis and growth, as the production of these secondary metabolites has certain biochemical and energetic costs (Pohnert et al. 2007).
Cellular toxin content also positively correlated with C:P and N:P ratios (Table 1), suggesting that a relatively lower P con- tent is associated with higher toxin quota. This relationship, however, might as well be caused by differences in cell size, where larger cells contain relatively less P and more toxins.
Toxin production may have developed in dinoflagellates as an adaptation to offset the ecological disadvantage of low nutrient uptake affinities by reducing grazing pressure (Smayda 1997; Guisandeet al.2002; Frangopuloset al.2004).
Consequently, there may be a trade-off between toxin produc- tion and species’ competitive ability for nutrients. Indeed, a higher PSP toxin content was associated with a lower affinity
−0.075
−0.050
−0.025 0.000 0.025 0.050
−0.15 −0.10 −0.05 0.00 0.05
NMDS1
NMDS2
***
0.025 0.050 0.075
Baltic Sea Netherlands
Distance to centroid for each population
Growth rate C:N
N:P
C:P Cell size EC50
Vmax K1/2
GYM SPX PSP
(a)
(b)
Figure 3Observed variation between all analysed traits of Alexandrium ostenfeldii populations illustrated by (a) non-metric multidimensional scaling ordination, where symbols denote the Dutch (2015, light grey;
2016, dark grey) and Baltic Sea (white) populations for each replicate, and the arrows indicate which traits vary along the axes, and (b) differences in total variation between the Dutch and Baltic Sea populations.
Table 1 R2values derived from linear regressions between log-transformed trait values ofA. ostenfeldii
Growth rate Cell size N:P C:P C:N Vmax K1/2 Cyclic imine toxins PSP toxins
Cell size 0.49***
N:P 0.13* 0.41***
C:P 0.20*** 0.40*** 0.91***
C:N 0.10** 0.36*** 0.10**
Vmax 0.17*** 0.20*** 0.17***
K1/2 0.14* 0.27* 0.11* 0.43***
Cyclic imine toxins 0.56*** 0.86*** 0.45*** 0.46*** 0.082* 0.15** 0.30**
PSP toxins 0.36*** 0.59*** 0.29*** 0.23*** 0.14** 0.41*** 0.64***
EC50 0.051* 0.22*** 0.30*** 0.23*** 0.20*** 0.064* 0.29*** 0.34***
Only significant regressions are presented and significance levels are indicated by the asterisks (***P<0.001,**P<0.01,*P<0.05).
5 10 20 40
0.5 1 5 10
K1/2 (µmol N L–1) Vmax (pmol N cell–1 d–1)
Figure 4 Trade-off between Vmax and K1/2 across the different Alexandrium ostenfeldiistrains. Symbols indicate strains isolated from the Netherlands (2015, light grey; 2016, dark grey) and Baltic Sea (white).
for P for several Alexandrium species (Frangopulos et al.
2004). Similarly, we observed a higher toxin content (PSP tox- ins and cyclic imines) with a lower N affinity (i.e. a higherK1/
2, Table 1), also after correcting for cell size (PSP: R2 =0.36, P<0.001; cyclic imines: R2 =0.27, P< 0.01). PSP toxins have been associated with grazer defence (Teegarden 1999;
Colin & Dam 2003; Wohlrabet al.2010, 2017), however their exact function is still under debate. Allelochemicals have been shown to act as a defence against competing phytoplankton species as well as grazers (Tillmann & John 2002; Tillmann et al. 2007; John et al. 2015). Yet, the putative trade-off between allelopathic potency and affinity for N is very weak (R2 =0.062, P =0.099). Excretion of allelochemicals can potentially play a role in heterotrophic feeding, as lysis of other algal species results in a release of organic compounds (Placeet al. 2012). Thus, allelochemicals may not only act as a defensive trait, but possibly also as an offensive trait, partic- ularly in mixotrophic algae such asA. ostenfeldii (Jacobson &
Anderson 1996; Gribbleet al.2005).
Nutrient uptake in phytoplankton is based on fundamental relationships between cell surface to cell volume scaling, and enzyme kinetics (Aksnes & Egge 1991; Litchmanet al. 2007).
Only a small area of the cell surface is available for nutrient uptake, and here the uptake sites with a small active area per site (resulting in a higherVmax and higher K1/2) compete with uptake sites with a relatively large active area (resulting in a lower Vmax and lower K1/2; Raven 1981). This trade-off between faster rates (i.e. higherVmax) and higher affinities (i.e.
lower K1/2; note the inverse correlation) for N uptake was observed earlier for different phytoplankton species (Litchman et al. 2007). Here, we demonstrate that this trade-off occurs intraspecifically, both within and across the tested A. osten- feldiipopulations (Fig. 4).
Most of the analysed traits were relatively conserved within A. ostenfeldii. Specifically, the observed intraspecific variation in growth rate, cell size, Vmax for nitrogen and elemental
composition across the tested A. ostenfeldii strains was lower as compared to the interspecific variation across phytoplank- ton species (Fig. S5). This is presumably caused by the vast range in cell size across species, that affects growth rate, nitro- gen acquisition and elemental composition (Finkelet al.2010;
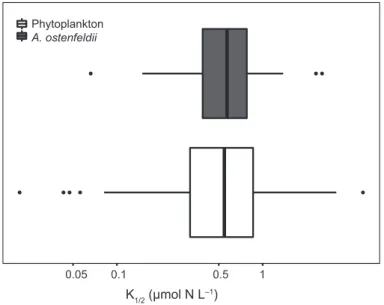
Edwards et al.2015a, b; Garcia et al. 2018). The intraspecific variation in K1/2 values for nitrogen, however, was compara- ble to the earlier reported interspecific variation across marine phytoplankton species (Fig. 5; Edwards et al. 2015a). These ranged from high K1/2 values (i.e. low affinities) observed for larger phytoplankton groups such as dinoflagellates, down to low values (i.e. high affinities) observed for small phytoplank- ton groups such as coccolithophores. This emphasises that trait variation occurring in a single phytoplankton species can be substantial, and may have important implications for its ecological functioning. Indeed, K1/2 largely determines the competitive ability for a resource (Tilman 1982; Litchman et al. 2007; Edwards et al.2011). Consequently, low K1/2 val- ues may support strains under low nutrient conditions, while high K1/2 values associated with high nutrient uptake rates (Fig. 4; Litchman et al. 2007; Edwards et al. 2011) may increase the competitive ability of strains under nutrient replete conditions.
Both of the studied A. ostenfeldii populations are phyloge- netically closely related, belonging to the same ribotype, but live in different habitats (Kremp et al. 2014; Van de Waal et al. 2015). The Baltic Sea isolates showed more pronounced trait variation than the Dutch isolates (Fig. 3). Besides habitat constraints, this might be explained by the presumably differ- ent histories of the populations in their respective habitats.
Colonisation of the Baltic Sea by marine organisms is esti- mated to have occurred after the postglacial opening of the North Sea, approximately 8000–3000 BP. The population genetic structure of A. ostenfeldii in the Baltic Sea, together with long plankton records, supports this early colonisation scenario (Bj€orck 1995; Tahvanainen et al. 2012). In contrast, the A. ostenfeldii population in the Netherlands was first reported in 2012 (Burson et al. 2014). The Dutch population has presumably colonised the small creek very recently, and may have only started with a small inoculum through the bot- tleneck effect selecting for functional traits supporting the establishment of an invasive species in a new environment (Carson 1959; Nei et al. 1975; Olden et al. 2004). For instance, the Dutch population exhibited a stronger expression of defensive traits such as the production of toxins and allelo- pathic compounds, which might be more important in novel environments with high interspecific competition. The recent establishment of the Dutch population is supported by genetic analysis of the A. ostenfeldiiisolates using microsatellites. The applied markers could not differentiate between all the differ- ent Dutch genotypes, suggesting that the tested strains were genetically very similar while showing a high variation in phe- notypic trait expression, which is consistent with rapid evolu- tion. The same microsatellite markers clearly differentiated the Baltic Sea isolates and thus indicate larger genetic differences (Table S1). The observed difference in intraspecific variation between the Baltic Sea and Dutch population might thus rep- resent an example of established and founder populations, respectively (Carson 1959; Dlugosch & Parker 2008).
K1/2 (µmol N L–1)
0.05 0.1 0.5 1
Phytoplankton A. ostenfeldii
Figure 5Variation in K1/2 across marine phytoplankton species (white;
Edwards et al. 2015a) and Alexandrium ostenfeldii strains (grey; this study).
The differences in trait expression between both populations may not only derive from different evolutionary histories, but also from distinct environmental conditions. Both populations occur in relatively calm and shallow water bodies, with high nutrient inputs from the surrounding land. Yet, the environ- mental conditions in the F€ogl€o area of the Baltic Sea are likely more stable than in the creek where the DutchA. osten- feldiipopulation resides, which is strongly influenced by nutri- ent and salinity fluctuations caused by rainfall (Brandenburg et al. 2017). In contrast to the Dutch creek, nutrient condi- tions quickly become limiting at the F€ogl€o bloom site in the Baltic Sea (Hakanen et al.2012). The cell density of compet- ing phytoplankton species or abundance of grazers during the blooms in the Dutch creek appears higher than during blooms in the F€ogl€o area (Fig. S6). The more stable conditions in the F€ogl€o area together with a relatively weaker competition with other algal species, lower grazing pressure and stronger nutri- ent limitation may have selected for smaller and faster grow- ing, and thereby less toxic genotypes. In contrast, the more intensive competition, the higher grazing pressure and the higher availability of nutrients in the Dutch creek may have selected for more toxic and allelopathic, and thereby larger but slower growing genotypes. In addition, a higher genetic diversity and trait variation within populations can be attained through gene flow (Slatkin 1987; Sextonet al. 2014).
In the northern Baltic Sea bloom areas, multiple differentiated localA. ostenfeldiipopulations have established in close prox- imity due to a highly fragmented coast line (Tahvanainen et al. 2012). Gene flow between these different populations allows for genetic exchange, which is in a strong contrast to the isolated bottleneck population from the Dutch creek. This may explain the higher degree of differentiation in the Baltic Sea isolates. We note that the described traits were derived from cultures grown under a constant salinity and tempera- ture, while both factors can vary substantially during a bloom and may affect the expression of traits.
Overall, we found considerable intraspecific trait variation within and across populations ofA. ostenfeldii, which was for one trait even comparable to the interspecific trait variation across marine phytoplankton species. Such large trait variation can be achieved and maintained through shifting selection pres- sures during toxic algal bloom periods, which can possibly con- tribute to their prevalence and success (Driscoll et al. 2015).
Varying ecological pressures may thus result in high functional trait variation within populations, and lead to intraspecific trade-offs between, for instance, defensive and competitive traits. Moreover, our results suggest the importance of evolu- tionary history that may have led to the higher trait variation in the Baltic Sea population. We here report a high functional trait variation withinA. ostenfeldiipopulations that allows for rapid diversification, as was observed for the Dutch population.
This intraspecific trait variation may facilitate bloom develop- ment under dynamic environmental conditions and promote the success of HABs under global environmental change.
ACKNOWLEDGEMENTS
The authors thank Nico Helmsing, Guus van den Heuvel and Inge Oostveen for their help during the experiments and
technical support. We also thank Annegret M€uller for analyses of PSP toxins. The work of KB is funded by the Gieskes-Strijbis Foundation. This work was partially funded by the Helmholtz-Gemeinschaft Deutscher Forschungszentren through the research programme “Polar regions And Coasts in the changing Earth System” (PACES) of the Alfred Wege- ner Institut-Helmholtz Zentrum f€ur Polar- und Meeres- forschung and by the German Research Foundation (DFG) Priority Programme DynaTrait (SPP1704; Jo 702/7-1) for UJ and SW. AK and JJ acknowledge grants from the Academy of Finland (310449) and the Walter and Andree de Nottbeck Foundation. We thank two anonymous reviewers for their constructive comments that helped to improve the manu- script.
AUTHORSHIP
KB, UJ, SW and DvdW designed the experiment; KB, SW, AK and JJ supplied the analysed strains; and KB performed the experiment. BK helped with the toxin analyses. KB and DvdW wrote a first draft of the manuscript, and all authors contributed to the writing process.
DATA ACCESSIBILITY STATEMENT
All data supporting this study are stored in the Dryad Digital Repository under https://doi.org/10.5061/dryad.6502mg2.
REFERENCES
Aksnes, D.L. & Egge, J.K. (1991). A theoretical model for nutrient uptake in phytoplankton.Mar. Ecol. Prog. Ser., 70, 65–72.
Albert, C.H., Thuiller, W., Yoccoz, N.G., Soudant, A., Boucher, F., Saccone, P. et al. (2010). Intraspecific functional variability: extent, structure and sources of variation.J. Ecol., 98, 604–613.
Alpermann, T.J., Beszteri, B., John, U., Tillmann, U. & Cembella, A.D.
(2009). Implications of life-history transitions on the population genetic structure of the toxigenic marine dinoflagellateAlexandrium tamarense.
Mol. Ecol., 18, 2122–2133.
Alpermann, T.J., Tillmann, U., Beszteri, B., Cembella, A.D. & John, U.
(2010). Phenotypic variation and genotypic diversity in a planktonic population of the toxigenic marine dinoflagellate Alexandrium tamarense(Dinophyceae).J. Phycol., 46, 18–32.
Anderson, D.M., Alpermann, T.J., Cembella, A.D., Collos, Y., Masseret, E. & Montresor, M. (2012). The globally distributed genus Alexandrium: multifaceted roles in marine ecosystems and impacts on human health.Harmful Algae, 14, 10–35.
Angles, S., Garces, E., Rene, A. & Sampedro, N. (2012). Life-cycle alternations inAlexandrium minutumnatural populations from the NW Mediterranean Sea.Harmful Algae, 16, 1–11.
Banse, K. (1976). Rates of growth, respiration and photosynthesis of unicellular algae as related to cell size–a review.J. Phycol., 12, 135–140.
Barrett, R.D.H. & Schluter, D. (2008). Adaptation from standing genetic variation.Trends Ecol. Evol., 23, 38–44.
Bjorck, S. (1995). A review of the history of the Baltic Sea, 13.0-8.0 ka€ BP.Quat. Int., 27, 19–40.
Blows, M.W. & Hoffmann, A.A. (2005). A reassessment of genetic limits to evolutionary change.Ecology, 86, 1371–1384.
Bolnick, D.I., Amarasekare, P., Araujo, M.S., Burger, R., Levine, J.M., Novak, M. et al. (2011). Why intraspecific trait variation matters in community ecology.Trends Ecol. Evol., 26, 183–192.
Brandenburg, K.M., De Senerpont, L.N., Wohlrab, S., Krock, B., John, U., Van Scheppingen, Y. et al. (2017). Combined physical, chemical
and biological factors shape Alexandrium ostenfeldii blooms in the Netherlands.Harmful Algae, 63, 146–153.
Burkholder, J.M. & Glibert, P.M. (2006). Intraspecific variability: an important consideration in forming generalisations about toxigenic algal species.Afr. J. Mar. Sci., 28, 177–180.
Burkholder, J.M., Glibert, P.M. & Skelton, H.M. (2008). Mixotrophy, a major mode of nutrition for harmful algal species in eutrophic waters.
Harmful Algae, 8, 77–93.
Burson, A., Matthijs, H.C.P., de Bruijne, W., Talens, R., Hoogenboom, R., Gerssen, A. et al. (2014). Termination of a toxic Alexandrium bloom with hydrogen peroxide.Harmful Algae, 31, 125–135.
Cardinale, B.J. (2011). Biodiversity improves water quality through niche partitioning.Nature, 472, 86–89.
Cardinale, B.J., Srivastava, D.S., Duffy, J.E., Wright, J.P., Downing, A.L., Sankaran, M. et al. (2006). Effects of biodiversity on the functioning of trophic groups and ecosystems.Nature, 443, 989–992.
Carey, C.C., Ibelings, B.W., Hoffmann, E.P., Hamilton, D.P. & Brookes, J.D. (2012). Eco-physiological adaptations that favour freshwater cyanobacteria in a changing climate.Water Res., 46, 1394–1407.
Carroll, S.P., Hendry, A.P., Reznick, D.N. & Fox, C.W. (2007).
Evolution on ecological time-scales.Funct. Ecol., 21, 387–393.
Carson, H.L. (1959). Genetic conditions which promote or retard the formation of species. Cold Spring Harb. Symp. Quant. Biol., 24, 87– 105.
Cembella, A.D., Lewis, N.I. & Quilliam, M.A. (2000). The marine dinoflagellate Alexandrium ostenfeldii (Dinophyceae) as the causative organism of spirolide shellfish toxins.Phycologia, 39, 67–74.
Cembella, A.D., Quilliam, M.A., Lewis, N.I., Bauder, A.G., Aversano, C.D., Thomas, K. et al. (2002). The toxigenic marine dinoflagellate Alexandrium tamarense as the probable cause of mortality of caged salmon in Nova Scotia.Harmful Algae, 1, 313–325.
Colin, S.P. & Dam, H.G. (2003). Effects of the toxic dinoflagellate Alexandrium fundyenseon the copepodAcartia hudsonica: a test of the mechanisms that reduce ingestion rates.Mar. Ecol. Prog. Ser., 248, 55– 65.
Dlugosch, K.M. & Parker, I.M. (2008). Founding events in species invasions: genetic variation, adaptive evolution, and the role of multiple introductions.Mol. Ecol., 17, 431–449.
Driscoll, W.W., Hackett, J.D. & Ferriere, R. (2015). Eco-evolutionary feedbacks between private and public goods: evidence from toxic algal blooms.Ecol. Lett., 19, 81–97.
Dugdale, R.C. & Wilkerson, F.P. (1986). The use of 15N to measure nitrogen uptake in eutrophic oceans; experimental considerations.
Limnol. Oceanogr., 31, 673–689.
Durbin, E., Teegarden, G., Campbell, R., Cembella, A., Baumgartner, M.F. & Mate, B.R. (2002). North Atlantic right whales, Eubalaena glacialis, exposed to paralytic shellfish poisoning (PSP) toxins via a zooplankton vector, Calanus finmarchicus. Harmful Algae, 1, 243– 251.
Edwards, K., Klausmeier, C.A. & Litchman, E. (2011). Evidence for a three-way trade-off between nitrogen and phosphorus competitive abilities and cell size in phytoplankton.Ecology, 92, 2085–2095.
Edwards, K.F., Klausmeier, C.A. & Litchman, E. (2015a). Nutrient utilization traits of phytoplankton.Ecology, 96, 2311.
Edwards, K.F., Thomas, M.K., Klausmeier, C.A. & Litchman, E. (2015b).
Light and growth in marine phytoplankton: allometric, taxonomic, and environmental variation.Limnol. Oceanogr., 60, 540–552.
Elrifi, I.R. & Turpin, D.H. (1985). Steady-state luxury consumption and the concept of optimum nutrient ratios: a study with phosphate and nitrate limitedSelenastrum minutum(Chlorophyta).J. Phycol., 21, 592– 602.
Elser, J.J., Dobberfuhl, D.R., MacKay, N.A. & Schampel, J.H. (1996).
Organism size, life history, and N:P stoichiometry.Bioscience, 46, 674– 684.
Elser, J.J., Acharya, K., Kyle, M., Cotner, J., Makino, W., Markow, T.
et al. (2003). Growth rate-stoichiometry couplings in diverse biota.
Ecol. Lett., 6, 936–943.
Falkowski, P.G. & Knoll, A.H. (2007).Evolution of Primary Producers in the Sea. Elsevier Academic, Boston.
Finkel, Z.V., Beardall, J., Flynn, K.J., Quigg, A., Rees, T.A.V. & Raven, J.A. (2010). Phytoplankton in a changing world: cell size and elemental stoichiometry.J. Plankton Res., 32, 119–137.
Flynn, K.J., Sa, S., Raven, J.A., Rees, T.A.V., Finkel, Z. & Quigg, A.
(2010). Is the growth rate hypothesis applicable to micoalgae? J.
Phycol., 46, 1–12.
Fogg, G.E. (1969). The physiology of an algal nuisance.Proc. R. Soc. B, 173, 175–189.
Frangopulos, M., DeBlas, E., Guisande, C. & Maneiro, I. (2004). Toxin production and competitive abilities under phosphorus limitation of Alexandriumspecies.Harmful Algae, 3, 131–139.
Garcia, N.S., Sexton, J., Riggins, T., Brown, J., Lomas, M.W. &
Martiny, A.C. (2018). High variability in cellular stoichiometry of carbon, nitrogen, and phosphorus within classes of marine eukaryotic phytoplankton under sufficient nutrient conditions.Front. Microbiol., 9, 1–10.
Genovesi, B., Laabir, M., Masseret, E., Collos, Y. & Grzebyk, D. (2009).
Dormancy and germination features in resting cysts of Alexandrium tamarense species complex (Dinophyceae) can facilitate bloom formation in a shallow lagoon (Thau, southern France). J. Plankton Res., 31, 1209–1224.
Godhe, A., Sjoqvist, C., Sildever, S., Sefbom, J., Harðarddottir, S., Bertos-Fortis, M. et al. (2016). Physical barriers and environmental gradients cause spatial and temporal genetic differentiation of an extensive algal bloom.J. Biogeogr., 43, 1130–1142.
Gribble, K.E., Keafer, B.A., Quilliam, M.A., Cembella, A.D., Kulis, D.M., Manahan, A. et al. (2005). Distribution and toxicity of Alexandrium ostenfeldii (Dinophyceae) in the Gulf of Maine, USA.
Deep.Res. Part II Top. Stud. Oceanogr., 52, 2745–2763.
Grover, J.P. (1997).Resource Competition. Chapman and Hall, London.
Guisande, C., Frangopulos, M., Maneiro, I., Vergara, A.R. & Riveiro, I.
(2002). Ecological advantages of toxin production by the dinoflagellate Alexandrium minutum under phosphorus limitation. Mar. Ecol. Prog.
Ser., 225, 169–176.
Hakanen, P., Suikkanen, S., Franzen, J., Franzen, H., Kankaanpaa, H. &
Kremp, A. (2012). Bloom and toxin dynamics of Alexandrium ostenfeldii in a shallow embayment at the SW coast of Finland, northern Baltic Sea.Harmful Algae, 15, 91–99.
Hakanen, P., Suikkanen, S. & Kremp, A. (2014). Allelopathic activity of the toxic dinoflagellate Alexandrium ostenfeldii: intra-population variability and response of co-occurring dinoflagellates.Harmful Algae, 39, 287–294.
Hallegraeff, G.M. (1993). A review of harmful algal blooms and their apparent global increase.Phycologia, 32, 79–99.
Hillebrand, H., Steinert, G., Boersma, M. & Malzahn, A. (2013).
Goldman revisited: faster-growing phytoplankton has lower N: P and lower stoichiometric flexibility.Limnol. Oceanogr., 58, 2076–2088.
Hooper, D.U., Chapin, F.S., Ewel, J.J., Hector, A., Inchausti, P., Lavorel, S. et al. (2005). Effects of biodiversity on ecosystem functioning: a consensus of current knowledge.Ecol. Monogr., 75, 3–35.
Jacobson, D.M. & Anderson, D.M. (1996). Widespread phagocytosis of ciliates and other protists by marine mixotrophic and heterotrophic thecate dinoflagellates.J. Phycol., 32, 279–285.
John, U., Litaker, R.W., Montresor, M., Murray, S., Brosnahan, M.L. &
Anderson, D.M. (2014). Formal revision of theAlexandrium tamarense species complex (Dinophyceae) taxonomy: the introduction of five species with emphasis on molecular-based (rDNA) classification.
Protist, 165, 779–804.
John, U., Tillmann, U., Hulskotter, J., Alpermann, T.J., Wohlrab, S. &
Van de Waal, D.B. (2015). Intraspecific facilitation by allelochemical mediated grazing protection within a toxigenic dinoflagellate population.Proc. R. Soc. B, 282, 20141268.
Keller, M.D., Seluin, R.C., Claus, W. & Guillard, R.R.L. (1987).
Media for the culture of oceanic ultraphytoplankton. J. Phycol., 23, 633–638.