The Benguela System under climate change Effects of variability in physical forcing on carbon and oxygen budgets
Cruise No. M157
04.08.2019 – 16.09.2019
Mindelo (Cape Verde) – Walvis Bay (Namibia) BUSUC 1
Matthias Zabel, Volker Mohrholz, Heide Schulz-Vogt, Stefan Sommer, Michael Zettler
Chief Scientist: Matthias Zabel
MARUM – Center for Marine Environmental Sciences 2019
Table of Contents
1 Cruise Summary ... 3
1.1 Summary in English ... 3
1.2 Zusammenfassung ... 3
2 Participants ... 4
2.1 Principal Investigators ... 4
2.2 Scientific Party ... 4
2.3 Participating Institutions ... 5
3 Research Program ... 5
3.1 Description of the Work Area ... 5
3.2 Aims of the Cruise ... 6
3.2 Agenda of the Cruise ... 7
4 Narrative of the Cruise ... 9
5 Preliminary Results ... 11
5.1 Environmental Chemistry ... 11
5.2 Hydrography ... 12
5.3 Marine Chemistry ... 22
5.4 Microbial Ecology ... 27
5.5 Geomicrobiology ... 32
5.6 Macrobenthic Ecology ... 35
5.7 In Situ Flux Measurements and Experiments ... 38
5.8 Sediment Geochemistry ... 43
6 Ship’s Meteorological Station ... 46
7 Station List M157 ... 48
8 Data and Sample Storage and Availability ... 56
9 Acknowledgements ... 56
10 References ... 57
11 Abbreviations ... 58
1 Cruise Summary 1.1 Summary in English
R/V METEOR expedition M157 was directly connected with the collaborative research project EVAR (The Benguela Upwelling System under Climate Change – Effects of Variability in Physical Forcing on Carbon and Oxygen Budgets), which is funded by the Ministry of Education and Research (BMBF). The major goal of this expedition was to obtain high-resolution data and samples from shelf and upper slope to document and to understand the variability of the geochemical environment and the present day physical forcing of the Benguela Upwelling System (BUS). For this purpose, comprehensive, multidisciplinary investigations were conducted along three transects perpendicular to the coast of Namibia at about 17,3°S, 23°S and 25°S. The work concentrated in particular on four selected locations, two on each of the southern transects, at which almost all devices could be deployed and all planned measuring methods and sub-sampling could be carried out. This program was complemented by comparative studies at numerous other stations along the three transects, as well as profiling measurements in the water column between all stations and on the transit from Cape Verde Islands to the working area. The geochemical measurements showed that, as expected at this time of year, the oxygen content in the bottom water was not completely depleted. A total of 330 deployments of different devices at 49 individual stations with water depth between 32 m and 2078 m were used to collect and gained extremely valuable samples and sensor data.
1.2 Zusammenfassung
Die FS METEOR-Expedition M157 stand in direktem Zusammenhang mit dem Verbund- forschungsprojekt EVAR (The Benguela Upwelling System under Climate Change - Effects of Variability in Physical Forcing on Carbon and Oxygen Budgets), das vom Bundesministerium für Bildung und Forschung (BMBF) finanziert wird. Das Hauptziel dieser Expedition war es, hochauflösende Daten und Proben von Schelf und oberem Hang zu erhalten, um die Variabilität der geochemischen Umweltbedingungen und den heutigen physikalischen Antrieb des Benguela- Auftriebssystems (BUS) zu dokumentieren und zu verstehen. Zu diesem Zweck wurden umfassende, multidisziplinäre Untersuchungen entlang dreier Transekte senkrecht zur Küste Namibias auf etwa 17,3°S, 23°S und 25°S durchgeführt. Die Arbeiten konzentrierten sich insbesondere auf vier ausgewählte Standorte, je zwei auf beiden südlichen Schnitte, an denen fast alle Geräte eingesetzt und alle geplanten Messmethoden durchgeführt und alle Unterproben genommen werden konnten.
Ergänzt wurde dieses Programm durch vergleichende Studien an zahlreichen anderen Stationen entlang der genannten Transekte sowie durch Profilmessungen in der Wassersäule zwischen allen Stationen und auf der Anreise von den Kapverdischen Inseln in das Arbeitsgebiet. Die geochemischen Messungen zeigten, dass der Sauerstoffgehalt im Bodenwasser, wie zu dieser Jahreszeit erwartet, nicht vollständig erschöpft war. Insgesamt 330 Einsätze verschiedener Geräte an 49 Einzelstationen mit Wassertiefen zwischen 32 und 2078 m wurden zur Gewinnung äußerst wertvoller Proben und Messdaten eingesetzt.
2 Participants
2.1 Principal Investigators
Name Institution
Mohrholz, Volker, Dr. IOW
Schulz-Vogt, Heide, Prof. IOW
Sommer, Stefan, Dr. GEOMAR
Zabel, Matthias, Dr. MARUM
Zettler, Michael, Dr. IOW
2.2 Scientific Party
Name Discipline Institution
Amorim, Katherine B Biological Oceanography IOW
Anderson, Chloe, Dr. B Sediment Geochemistry MARUM
Beck, Antje B Technician GEOMAR
Beier, Sebastian B Technician IOW
Burmeister, Christian A+B Technician IOW
Dangl, Gabriela B Biological Oceanography IOW
Fabian, Jenny, Dr. B Biological Oceanography IOW
Glockzin, Michael A+B Technician IOW
Heene, Toralf B Technician IOW
Herrán, Natalia, Dr. B Physical Oceanography IOW
Kolbe, Martin A+B Technician IOW
Kossak, Michael B Sediment Geochemistry MARUM
Langeloh, Hendrik B Technician IOW
Meckelnburg, Isabelle B Technician GEOMAR
Meeske, Christian B Technician IOW
Mohrholz, Volker, Dr. A+B Physical Oceanography IOW
Otto, Stefan, Dr. A+B Technician IOW
Nolte, Gabriel B Technician GEOMAR
Sabbaghzadeh, Bita, Dr. A+B Marine Chemistry IOW
Scholz, Florian, Dr. B Sediment Geochemistry GEOMAR
Schulz-Vogt, Heide, Prof. B Biological Oceanography IOW
Sommer, Stefan, Dr. B Marine Biogeochemistry GEOMAR
Stelzner, Martin A+B Technician DWD
Tambo, Munyaradzi, Dr. B Geomicrobiology IOW
Tewes, Simon A Oceanography BSH
Türk, Matthias B Engineer GEOMAR
Wäge, Janine, Dr. B Microbial Ecology IOW
Wiezoreck, Marco A Chemistry MPI-C
Zabel, Matthias, Dr. B Sediment Geochem. / Chief Scientist MARUM
Name Discipline Institution
Zettler, Michael, Dr. B Biological Oceanography IOW
A – Leg/Transit 04.-18.08.2019; B – Leg 18.08.-16.09.2019
2.3 Participating Institutions
BSH Bundesanstalt für Seeschifffahrt und Hydrographie Hamburg DWD Deutscher Wetterdienst, Geschäftsfeld Seeschifffahrt
GEOMAR Helmholtz-Zentrum für Ozeanforschung Kiel IOW Leibniz-Institut für Ostseeforschung Warnemünde
MARUM Zentrum für Marine Umweltwissenschaften, Universität Bremen MPI-C Max-Planck-Institut für Chemie Mainz
3 Research Program
3.1 Description of the Work Area
The Benguela Upwellig System (BUS) belongs to the eastern boundary current systems, which are among the most productive areas of the world`s oceans. It is driven by upwelling of nutrient-rich intermediate waters as a result of atmospheric forcing and oceanographic circulation. Yet, upwelling intensity is not constant, and can vary on time scales from days to millennia. In the northern BUS a number of high quality field data and time series are available from recent research projects (NAMIBGAS, GENUS, SACUS, PREFACE) and the environmental monitoring of the Ministry of Fisheries and Marine Resources of Namibia. Based on the available data, that also display decadal variability, a significant long-term trend in upwelling intensity cannot be detected (Junker et al., 2017). Accordingly, the Bakun hypothesis of intensification of upwelling with global warming (Bakun, 1990) has not been verified for the BUS so far (Rykaczewski et al., 2015). However, paleo- studies based on sediment archives indicate that the productivity in the BUS has been subject to strong fluctuations in the geological past (Little et al., 1997).
It is well-recognized that the feedback of benthic and pelagic communities to upwelling variability can lead to changes in extent and intensity of oxygen minimum zones (OMZ). Benthic communities further control the burial of detritus sinking to the seafloor and the flux of dissolved and gaseous compounds across the sediment water interface. In the BUS, the benthic contribution to the pelagic nutrient budget is considered to be of local or temporal importance only (Neumann et al., 2016).
However, this assessment is based on diffusive fluxes determined ex situ from pore water profiles during low upwelling intensity. Studies in other upwelling areas instead show that total fluxes determined in situ using flux chambers can greatly exceed diffusive fluxes (e.g. Noffke et al., 2012) and are further modulated by seasonal variability of bottom water redox conditions (e.g. Sommer et al., 2016). A systematic investigation of benthic fluxes as a function of bottom water redox-variability is so far lacking for the BUS. Upwelling also fosters the release of the greenhouse gases methane, nitrous oxide and carbon dioxide to the atmosphere. Several investigations have addressed methane biogeochemistry in the BUS, in particular on the shelf, mostly due to “gas eruptions” or sulfidic events that frequently occur in the late summer (Emeis et al., 2004). In contrast, the exact nature of the interaction between microbial nitrous oxide production and the variability of oxygen and sulfide distribution has not been investigated so far.
The collaborative BMBF project EVAR pursues three very interdependent goals: a) to decipher the interrelationships between macrobenthic diversity and microbial transformation processes in the
water column and in surface sediments as a function of the environmental conditions (i.e. oxic- suboxic-anoxic-sulfidic), b) to identify indicators of paleo-anoxia in sediment archives for assessing past variability in upwelling intensity, and c) to develop a comprehensive coupled, regional ecosystem model on the basis of our new analytical and experimental results to allow reliable predictions of future scenarios of OMZ intensity and extent. Through an innovative multi-disciplinary approach, EVAR will in particular gain new information on specific, essential processes such as the plasticity and feedback mechanisms of macrobenthic and microbiological communities to fluctuations in oxygen, sulfide and nutrient concentrations. EVAR will identify crucial parameters and concentrations that most likely dictate tipping points with positive or negative feedback for OMZ intensity such as the release of N2O to the atmosphere, build up of toxic sulfide concentrations in the water column as well as the detoxification potential of microbial communities, extinction of benthic macro-organisms and decline of bioturbation.
3.2 Aims of the Cruise
The major goal of this expedition, and a second cruise within the EVAR project scheduled in spring 2021, was to obtain high-resolution data and samples to document and to understand the variability of the geochemical environment and the present day physical forcing of the Benguela Upwelling System (BUS). For this purpose, comprehensive, multidisciplinary investigations were conducted along three transects perpendicular to the coast of Namibia at about 17,3°S, 23°S and 25°S. The work concentrated in particular on 4 selected locations at which all planned measuring methods and sampling could be carried out. This program was complemented by comparative studies at numerous other stations along the mentioned transects, as well as profiling measurements in the water column between all stations. Specific aims of the different working groups were as follows:
Hydrographic Regime
• Detection of short term upwelling peaks by recording standard hydrographic parameters
• Exchange the long-term mooring at 23°S and deployment of similar sensors at 25°S Assessing variability in past upwelling intensity
• Recovering of high resolution sediment archives to investigate the history of geochemical environmental conditions during the Holocene
Fluxes and turnover in response to variable redox conditions
• Estimate the pelagic microbial potential to react towards changes in abiotic parameters such as a sudden increase in sulfide or decrease in oxygen, and how this is related to trace gas production and sulfide oxidation. Identification of specific biogeochemical transformation zones and the involved microbial key organisms. Investigation of the effect of sulfide accumulation in the water column on the phosphorus cycling.
• Elucidation of the magnitude and pathways of benthic fluxes of nutrient (N-species, phosphate, Fe), dissolved gases (CH4, pCO2, N2/Ar) as well as dissolved inorganic carbon (DIC), sulfide and silicate in response to fluctuating and shifting regimes of the bottom water availability of O2 and NO3-. Determine microbial controls and tipping points of the sequestration and release of phosphate, as well as of the benthic N and S cycling. Investigation of the tolerance of distinct microbenthic species to oxygen availability
• Determination of the timing and magnitude of sulfidic events after stepwise depletion of O2 and NO3- in the bottom water
• Determination of the contribution of the macro- and microbenthic communities to the overall solute turnover in sediments at the upper and lower boundary of the OMZ
Trace gases
• Determination of sea surface concentration and fluxes of trace gases and relation to upwelling intensity and chemical physicochemical signature of the feed waters. Linking trace gas transformations to the microbial key players. Determination of the key depth horizons and processes for trace gas transformations and sensitivity of the underlying processes to variations in redox conditions (O2 and H2S levels).
3.3 Agenda of the Cruise
Figure 3.1 shows the detailed station map and the route of the cruise. Additionally to the program on the three transects at 25°S, 23°S and 17,3°S water column profiling with different sensors was done on some sites along the 18°S latitude, which are regularly measured by the Namibian partner institute (NatMIRC) as part of a joint monitoring program.
The time and work planning of the proposal did not include a very long transit to the actual work area. In addition to preparatory work, the transit could also be used for important, additional measurements. These include, among others, continuous, on-the-go measurements of the concentration of various trace gases in surface water, or the measurement of persistent organic pollutants (POPs) in the atmosphere.
Within the working area, the unexpected, extremely soft, not to say soupy consistency of the surface sediments within the coastal mud belt, which initially presented us with greater difficulties.
Especially the multicorer, but also the core catcher of the gravity corer and the bottom water trace profiler had to be modified several times to ensure the ultimately very successful sampling.
Due to the very high suspension load close to the seafloor, the planned use of the Ocean Floor Observation System (OFOS) for visual examination of the seafloor to find the most promising sites for the benthic lander deployments proved to be useless. In addition, no significant structures, such as bacterial mats, could be observed during the only 3, instead of at least 5 OFOS missions as planned.
In the end, we based our choice of stations mainly on the sampling scheme of the NatMIRC monitoring program. This also ensured that our measurement results from the water column can be integrated into the corresponding long-term data sets.
In general, this cruise made very high demands on the timing of the equipment deployment. For example, contamination of the water column with sediment particles had to be prevented. Due to the usually very shallow water depth and the resulting high frequency of sample collection and the time required to process the samples, many stations had to be visited several times. This was especially true for the stations where the benthic landing systems were used (see below).
A major difference compared to the previous planning concerned the time requirements of the two Biogeochemical Observatories (lander systems) BIGO-1/-2. The complicated preparation of the instruments required that this work, the deployments and recoveries should be carried out in daylight only. Additionally, the necessary processing of the samples obtained forced the deployment of the systems on different consecutive days. The conception of the in-situ measurements and experiments required several missions of the systems at all of the so-called main stations, where also all other devices were used and profiling measurements were carried out. This meant that the ship has to go at
all respective stations 4 times within 7 days, a very time-limited procedure with an unexpected large number of transits. Consequently, the observatories could only be used at 4 instead of 5 stations and there only with 2 instead of 3 missions, an inevitability which could have been taken into account when planning the expedition with a better exchange of information between the working groups. All these constraints allowed only 8 of the 15 initially planned deployments could be conducted within the 28 days of the cruise. On the other hand, it were precisely the relatively short transits between stations, that brought some necessary recovery for the whole crew in the densely and ambitiously packed work program. Nevertheless, on the second EVAR expedition, a significant optimization of these critical points should be implemented. One aim here is to ensure that work with the BIGO systems can also take place during night times. In the same context, the frequent repositioning of the wires, particularly with regard to telemetry (necessary for the launcher, but to be disconnected for the GCs), meant that deployments of the gravity corer had be carried out in very small time frames, which, with a limited number of scientists, were actually too short for careful processing.
Fig. 3.1 Track chart of R/V METEOR Cruise M157 with locations of sampling along the three transects.
Furthermore, minor defects occurred, e.g. on the hose of the Pump CTD, or the sensors of the ScanFish. However, these could all be repaired with own resources in relatively short times, so that the number of uses of the affected devices was not significantly endangered. In the end there was only one total failure. Two drifters could not be used due to a non-functioning satellite connection.
In summary, some of our plans were too ambitious to be implemented 100% in the given time.
However, thanks to the great mutual support of all groups involved and the excellent interaction with the ship's crew, so much new data were measured and valuable samples were obtained that this expedition can be described as very successful in terms of its objectives.
4 Narrative of the Cruise
The expedition M157 was divided into two parts. The official start was on August 8th with the departure from the port of Mindelo on the Cape Verde Islands. The scientific crew on the transit to the working area off Namibia consisted of 6 scientists from the Leibniz Institute for Baltic Sea Research Warnemünde (IOW) and two secondary users, one from the Federal Maritime and Hydrographic Agency (BSH) and one from the Max-Planck-Institute for Chemistry (MPI-C). The transit was interrupted only by a few short stops to test different instruments. The first 14 days were be used very effectively for unloading the scientific equipment, setting up the different laboratories and first test measurements, like on-the-go measurements of the flow field, surface water properties and trace substances as well as air pollutants. For the latter, concentration of persistent organic pollutants (POPs) was of particular interest. Despite their negative effects on the environment and human health, the proliferation of many of these pollutants is still insufficient or in areas far from primary sources almost not described at all in the literature. While valuable samples for the analysis of POPs were taken from the air and from the surface waters, the second, accompanying mission was unfortunately not successful. As the ordered Argo floats were not delivered in time to the Vessel in Mindelo, the floats could not be deployed as planned. On the morning of 18 August, the first transit leg of expedition M157 ended with the arrival of R/V METEOR at the port of Walvis Bay.
The two secondary users disembark and 22 scientific participants, mostly members of the EVAR cluster project, boarded. Unfortunately, none of the Namibian partners was able to participate in the cruise. At least one place was reserved until the last moment, but our hope was dashed just before the departure in the evening of August 18th. We are not aware of any reasons for the cancellations.
According to our working plan in the proposal, investigations in the following four weeks concentrated on the coastal region off Namibia and here on three transects at 17.3°S, 23°S and 25°S respectively. Already 2 hours after leaving the port of Walvis Bay, the first profiling oceanographic measurements could be started along the 23°S transect. The excellent preparatory work during the transits from Mindelo to Walvis Bay for the laboratory setup and the instrumentation proved to be extremely important. In order to get a first impression of the current chemical and physical conditions in the water column, especially the distribution and concentration of oxygen, a towed measuring device (the so-called ScanFish) was used together with the vessel mounted ADCP 38kHz and 75kHz ocean surveyors along a profile lines from the coast line up to about 75 nautical miles offshore. At the same time, the ship's sediment acoustic systems were used to explore the bathymetry and the internal structure of the sediments on the seabed. The profiling observations with the ScanFish were supplemented by the multiple use of a profiler for turbulence and mixing study (MSS), which provided high-resolution measurements of the characteristics of the water mass structure. For the selection of the individual sampling locations, we followed the monitoring scheme of the National
Marine Information and Research Centre (NatMIRC) in Swakopmund. On the base of the new sensor data from the water column, locations were determined where we expect to gain the most promising results to answer our questions by using the other devices. The first successful sampling of the seabed surface by means of a large box grab was carried out in 2071 m water depth in the late evening of August 19. In rapid succession, we frequently used all our sampling devices. In addition, long-term measuring systems (moorings) placed on previous expeditions were recovered at two stations and one could be newly deployed. The different needs of the individual investigation devices and methods (e.g. clean ship during CTD operations), as well as the short distances between neighboring investigation stations (max. 20 nautical miles) required the repeated visiting of the individual stations.
In the night of August 28-29, the investigations on the 23°S transect were completed for the time being and the RV METEOR steamed to the northern section of the working area. In addition to standard measurements in the water column by CTD, MSS and an in situ absorption spectrophotometer (AC- S), as well as the exchange of an anchored oceanographic mooring, from August 30th onwards mainly sampling of the surface sediments with Dredge, Van-Veen-Grab, boxcorer and multicorer took place.
The latter serve investigations on the species distribution of macro-benthos, which can be used among others as an indicator for the oxygen concentration in the bottom water. In the evening of September 1st we left the northern working area between 17.3°S and 18°S. On the transit to the transect at 25°S the vessel stopped for two more CTD missions about 10 and 20 nautical miles off Walvis Bay.
On the evening of 3 September, work began on the southern Transect at 25°S. We applied the same observation and sampling strategy, which was successful already along the 23°S transect, starting the measurements using CTD, AC-S and MSS and acoustic sediment observations from deeper waters to near the coast. Due to technical problems that could be solved later, a profile with the ScanFish could only be created 5 days later. The different requirements of the individual instrument operations, measurements and laboratory work required a high degree of flexibility for all participants also on this transect. After about 8.5 days, on the morning of September 12, the investigations in the southernmost working area were completed. One last time the 23°S transect was approached in order to obtain further sample material for incubation experiments at one station and to use the meanwhile repaired Pump-CTD at two other stations.
Despite the difficult conditions due to the very soft sediment surface in the area of the coastal mud belt (cf. 3.3), almost all planned samples could be obtained. In total, R/V METEOR expedition M157 covered 6,300 nautical miles, half of which was the transit from Mindelo to Walvis Bay. We were able to collect extremely valuable samples and measurement data at 49 individual stations and along different transit routes. 330 instrument operations were carried out in water depth between 32 and 2078 m.
On the morning of September 16 the cruise ended in Walvis Bay. As promised when applying for the work permit, a workshop was held at the NatMIRC on the following two days, where the first, preliminary results could be presented to Namibian colleagues and discussed with them.
5 Preliminary Results 5.1 Environmental Chemistry
(M. Wiezoreck)
During the transit from Mindelo to Walvis Bay air and surface water sample were taken in order to determine the concentration of persistent organic pollutants (POPs) on the Atlantic off the coast of West and Central Africa. This work was carried out as part of the ITTWIA project "Intercontinental transport of persistent organic pollutants from Western and Central Africa".
Despite their negative effects on the environment and human health, the proliferation of many of these pollutants is still insufficient or in areas far from primary sources almost not described at all in the literature. This campaign aims to determine the concentrations of these pollutants in the tropical Atlantic off the West and Central African coasts during the West African rainy season and the slash- and-burn season on agricultural land in Central Africa. In addition, the transatlantic transport of the substances was investigated by simultaneous sampling on the coast of French Guyana. Due to the trade winds in the tropics, air masses with the pollutants were transported from West and Central Africa to South America.
For this purpose, air samples were collected 24 hours a day using a high volume air sampler. In this collector, particles up to a size of 10 µm (PM10) were collected separately on quartz fiber filters and the pollutants in the gas phase on two sequential polyurethane foams. In order to prevent contamination with exhaust gases from the own ship, the sample collector was set up in the front part of the ship on the 2nd deck, the so-called "heli deck", at the railing (see Fig. 5.1). The loaded samples were then wrapped in aluminium foil in the laboratory, minimizing any contamination, and stored in the refrigeration room at -20 °C. The offline analysis including extraction with organic solvent, purification and subsequent analysis with gas chromatography coupled to a mass spectrometer is currently done at the Research Centre for Toxic Compounds in the Environment in Brno (Czech Republic).
Pollutants in surface water were collected using a passive sampling device. Thin silicone rubber plates were continuously exposed to the surface water of the Atlantic Ocean. This passive sampling of POPs in surface water was running several days before the samples were collected and stored in the cold store at -20°C, minimizing any further contamination during packing.
Also these samples were sent by air freight to the laboratory in Brno for further analysis.
Fig. 5.1.1 Marco Wietzoreck from MPI for Chemistry in Mainz exchanging the filter at the air sampler.
5.2 Hydrography
(V. Mohrholz, S. Beier, T. Heene, M. Kolbe)
The focus of hydrographic investigations during the cruise was on the impact of short term upwelling variability on oxygen and nutrient supply to the shelf, and on the response of primary production to short term upwelling peaks.
Standard hydrographic parameters were gathered with a Seabird CTD along three transects. The transects at 23°S and 25°S were be covered with 12-13 hydrographic stations each. The northernmost transect included 4 hydrographic stations. At stations deeper than 200 m a LADCP was be used at the CTD to obtain full depth current profiles. The along transect station distances range from 5 to 10 nm to resolve mesoscale structures. A microstructure profiler (MSS) was deployed after the CTD cast at all stations. The MSS provides data about diapycnal mixing and turbulent eddy diffusivity. In combination with high resolution profiles of oxygen and nutrients the MSS data allow the estimation of vertical fluxes. Since the CTD stations cannot resolve the expected spatial variability of phytoplankton distribution a towed undulating CTD (ScanFish) was deployed along the transects.
On the main stations the Pump-CTD was used to obtain nutrient profiles and biological sampling with high vertical resolution (see below). To relate the spatial distribution data gathered along the transects to the temporal change and evolution on a seasonal scale two long term moorings were deployed at 23°S and 25°S at about 20 nm off the coast. All hydrographic data are also used as background data in other EVAR subprojects, and as complementary data set in the Namibian environmental monitoring program, that samples the same cross shelf transects up to five times a year.
5.2.1 Equipment CTD
The CTD-system "SBE 911plus" (SEABIRD-ELECTRONICS, USA) was used to measure the variables: pressure, temperature (2x SBE 3), conductivity (2x SBE 4), oxygen concentration (2x SBE 43), chlorophyll-a fluorescence (683nm), turbidity, PAR and SPAR. To minimize salinity spiking, temperature- (SBE 3), conductivity (SBE 4) and oxygen sensors (SBE 43) are arranged within a tube system, where seawater is pumped through with constant velocity. The CTD was equipped with a redundant sensor system sensor system for temperature, conductivity and oxygen.
The temperature is given in ITS-90 temperature scale. Salinity is calculated from the Practical Salinity Scale (1978) equations. Fluorescence and turbidity are measured with a downward looking WET Labs fluorimeter. Pressure is determined with a Paroscientific Digiquartz pressure sensor.
Data were monitored during the casts and stored on hard disk with Seasave Version 7. For each station a configuration file (stationname.xmlcon) was written which contains the complete parameter set, especially sensor coefficients used for the conversion of raw data (frequencies) to standard output format.
Additionally, the CTD-probe was equipped with a Rosette water sampler with 21 Free Flow bottles of 10 l volume each. This design allows for closing of bottles automatically at predefined depths during down-casts. Closing depth and sensor values are aligned by appropriate choice of parameters of the CTD software generating the “bottle files”. The CTD was attached to winch 2 of the R/V METEOR.
Table 5.2.1 Type and serial numbers of mounted CTD sensors
Sensor Type SN Last calibration
Pressure Digiquartz 1072 10.10.2011
Temperature 0 SBE 3 4451 06.05.2019
Temperature 1 SBE 3 5261 06.05.2019
Conductivity 0 SBE 4 3722 06.05.2019
Conductivity 1 SBE 4 2936 06.05.2019
Oxygen 0 SBE 43 0644 15.06.2018
Oxygen 1 SBE 43 1732 15.11.2018
Chl-a fluorescence / Turbidity WET Labs - FLNTURTD 3274 27.09.2013
PAR sensor Biospherical Licor Chelsea 4381 06.09.1994
SPAR SPAR/Surface Irradiance 6321 unknown
Pump-CTD
At the key stations a Pump-CTD system, equipped with a high pressure pump and connected to a special pump cable was used. The system based on a CTD "SBE 911 plus" (SEABIRD- ELECTRONICS, USA), measuring the parameters pressure, temperature, conductivity, and oxygen.
The CTD-probe was mounted to a SeaBird Rosette water sampler with 7 Free Flow bottles (IOW/HydroBIOS) of 5 l volume, and 6 AFIS bottles. Data are monitored and stored to hard disk with Seasave software Version 7.
Water sampling is carried out with the 13 bottles and a continuous water stream of approximately 3,2 l per minute from the CTD through cable and winch into the analytics labs. The system consists of the submersible CTD-, Rosette-, pump probe unit, a special pump cable and a computer controlled winch. It allows the measurement of vertical profiles of the CTD parameters given above in combination with sophisticated online water sampling down to a depth of 400 m.
On 25.08. after the fourth deployment of the Pump-CTD the pump cable was damaged during the recovery of the device. The cable could be terminated again. The device was then used on the 25°S transect as planned.
ScanFish Towed CTD
High resolution hydrographic transects with the ScanFish towed CTD (SF) were performed along the cross shelf transects at 23°S, 17.3°S and 25°S.
The ScanFish consists of a Seabird 911+ CTD mounted on a wing shaped body undulating between sea surface and about 130 m depth when towed behind the ship. Additionally to the usual CTD sensors, the probe is equipped with sensors for dissolved oxygen concentration, turbidity and Chlorophyll-a fluorescence. The details of the used sensors are given in Table 5.2.2. Hydrographic data are transmitted via a multi-conductor cable and stored in the lab on a computer disc. The instrument was deployed over the stern of the ship. The cable was operated from a separate winch mounted at the aft deck. The cable is guided by a pulley block mounted below the A-crane. The A- crane will be used for deployment and recovery. The device is towed with 5-7 knots, the undulation depth is steered from the lab. Control commands are transmitted via the cable.
Due to failure of electrical wires in the ScanFish tow cable termination the SF transect at 23°S had to be untimely stopped before the end of the transect was reached. The same error occurred again during the following operation on the 18°S transect. This Transect was therefore also aborted
untimely. The cable was terminated again. The next operation on the 25°S transect could be carried out as planned.
Table 5.2.2 Type and serial numbers of CTD sensors mounted on ScanFish
Sensor Type SN Last calibration
Pressure Digiquartz 76058 11.10.2006
Temperature 0 SBE 3 5213 04.07.2018
Conductivity 0 SBE 4 4497 04.07.2018
Oxygen 0 SBE 43 0016 17.10.2018
Chl-a fluorescence / Turbidity WET Labs - FLNTURTD 1223 10.12.2008 VMADCP’s 38kHz and 76kHz
Two vessel mounted Acoustic Doppler Current Profilers (ADCP) Ocean Surveyor (frequencies 38 and 76 kHz, beam angle 30 deg), manufactured by RD-Instruments, were mounted downward looking at the ship hull. The data output of the ADCPs were merged online with the corresponding navigation data and stored on the hard disc using the program VMDAS. Current data are collected in beam coordinates to apply all corrections during post processing. The ADCPs were operated continuously during the entire cruise. Post-processing of the ADCP data was carried out using the Matlab® ADCP toolbox of IOW. The final profiles are 120 s and 300 s averages of the single ping profiles. At sections where bottom tracking was available the heading bias of the instrument was calculated. Heading bias and the local magnetic deviation were applied during post processing.
Moorings
During the cruise M157 the moorings of the Northern Benguela Mooring array were maintained. The array consists of three long term moorings at about 130 m depth along the northern Namibian shelf, and is operated in frame of the EVAR and BANINO projects in close collaboration with the NatMIRC institute, Swakopmund. The particular recovery and deployment times and positions of all moorings of the Northern Benguela Mooring array are summarized in Table 5.2.9.
Microstructure Profiler (MSS)
The MSS 90-S (Serial number 055) is an instrument for simultaneous microstructure and precision measurements of physical parameters in marine waters. The MSS profiler was equipped with 2 velocity microstructure shear sensors (for turbulence measurements), a microstructure temperature sensor, standard CTD sensors for precision measurements, a turbidity sensor, a micro oxygen optode and a vibration control sensor.
All sensors are mounted at the measuring head of the profiler, the microstructure ones being placed about 150 mm in front of the CTD sensors. The sampling rate for all sensors was 1024 samples per second. The profiler was balanced with negative buoyancy, which gave it a sinking velocity of about 0,6 m/s. It was deployed with a power block winch. The profiler was operated from the stern of R/V METEOR. Disturbing effects caused by cable tension (vibrations) and the ship’s movement were excluded by a slack in the cable. After the deployment the sensors were flushed with pure water to prevent fouling.
The dissipation rate of turbulent kinetic energy was calculated by fitting the shear spectrum to the theoretical Nasmyth spectrum in a variable wave number range from 2 to maximum 30 cycles per
meter (cpm). The low wave number cut off at 2 cpm is to eliminate contributions from low frequent tumbling motions of the profiler. The MSS sensors were calibrated before the cruise in the IOW calibration lab.
During the cruise an in situ calibration of the MSS was performed on CTD profile 34H01. The calculated slope and offset of particular MSS sensors are given in Table 5.2.3.
Table 5.2.3 Calibration coefficients for particular MSS sensors.
MSS sensor Slope Offset
Temperature PT100 1.0024 -0.032814 K
Temperature NTC 1.0025 -0.022688 K
Conductivity 1.0032 -0.18243 mS/cm
Fast Oxygen optode 1.031 -9.4401 µmol/kg TRIOS Radiation Measurement System
During the entire cruise a TRIOS radiation measurement system was used to gather reflectance data.
The system was mounted at the bow of the ship. It consists of three spectrometers measuring the incoming global radiation, the forward incoming radiation and the reflectance of the sea surface. The data are stored in an ACCESS data base. No additional validation or preprocessing was performed during the cruise.
Underway Measurements
The R/V METEOR is equipped with numerous sensors, which continuously provide important environmental and navigation parameters. The available data set consists of weather parameters, surface water properties, navigation information, rope length, winch speed and more. The data are collected by a data acquisition system DSHIP3 manufactured by WERUM. All data are stored in a data base and can be extracted by a web interface. A description of all collected parameters is given in the ship specific DSHIP3 manual. All data are snapshots taken and stored every second. After the cruise the full data set was extracted. During the cruise a subset of the parameters was processed.
5.2.2 Preliminary Results
The results presented in the following section are preliminary and not comprehensive, since they are based in most cases on unevaluated raw data! The aim of this section is to give a first impression on the collected data set, using the examples of the equatorial transect and the Walvis Bay transect. An advanced data analysis will follow after all validated data sets are available.
Sea Surface Temperature and Salinity
Sea surface temperature and surface salinity distributions in the investigation area were compiled from data gathered with the ships thermosalinograph. The distributions shown in Fig are based on unvalidated data. The SST was between 12 and 16°C, according to the season. The cold temperatures on the coast at Walvis Bay and at 25°S are an indicator for upwelling water. The SSS shows an analogous distribution to the SST with low salinity in the upwelling water and higher salinity in the north of the study area.
Fig. 5.2.1 Surface temperature (left) and surface salinity distribution (right) along the cruise track of M157 (30 min averaged values).
Equatorial Transect
On the transit from Mindelo to Walvis Bay only a station for device tests was performed. The observations along the transect were made with both VMADCP’s and the ship thermosalinograph.
The transect crossed the equatorial current system and the Angola Basin and supplied information about the current field for the upper 800 m.
The area north of 7°S is controlled by the equatorial current system. The most intensive eastward directed current is the equatorial under current (EUC) at the equator (Fig). The EUC is accompanied by several zonal current bands, namely the south equatorial under current (SEUC) at 2°S and the south equatorial counter current (SECC) near 5°S. Between the EUC and the SECC the westward flowing south equatorial current (SEC) is embedded. The meridional currents in the equatorial area were mainly northward directed and depicted a lower intensity (Fig. 5.2.3).
Fig. 5.2.2 East component of current velocity along the equatorial transect of the cruise M157. The data were gathered
with the 38kHz Vessel mounted ADCP (8.08. – 17.08.2019). The abbreviations indicate zonal components of the equatorial current system.
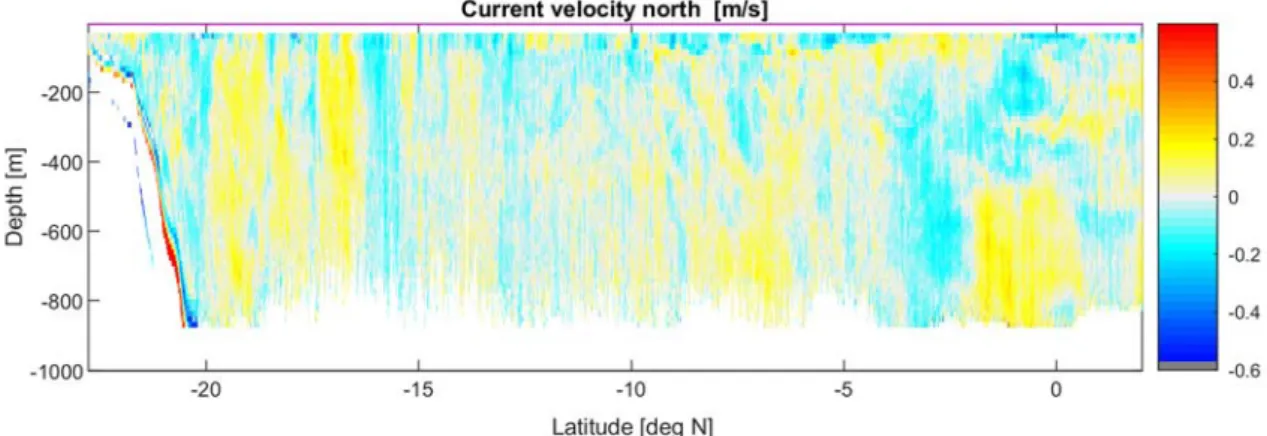
Fig. 5.2.3 North component of current velocity along the equatorial transect of the cruise M157. The data were gathered with the 38kHz Vessel mounted ADCP (8.08. – 17.08.2019).
In the Angola Gyre between 7°S to about 16°S the currents in the upper ocean are generally weak.
This causes a long residence time of central water in the area and weak lateral ventilation. At the continental slope off southwest Africa weak southward directed currents were observed.
Fig. 5.2.4 Patterns of acoustic backscatter cross section along the equatorial transect of the cruise M157. The data were gathered with the 38kHz Vessel mounted ADCP (8.08. – 17.08.2019).
Additionally to the current velocity, the backscattering signal of the vessel mounted ADCPs provided an indirect measure of the vertical zooplankton distribution. Along the tropical part transect, north of 17°S, a pronounced signal diurnal vertical migration of zooplankton was observed. The timing of upward and downward movement coincides with dusk and down. During the night a larger part of the zooplankton seems to feed near the surface, whereas they rest during the daytime mainly in depth of 300 to 400 m, which confines to the depth layer of minimum oxygen concentration. Second scattering layers were observed throughout the time at 200 and 400 m. The depth of the lower scattering layer was increasing towards the equator to about 500 m. The vertical migration is also visible in the subtropical part of the transect south of 17°S, but less pronounced. Since no sampling was performed along the transect, no information about the zooplankton is available.
Walvis Bay Transect at 23°S
The majority of the stations worked during the cruise M157 was carried out along cross shelf transects. The main transect was off Walvis Bay at 23°. The ScanFish was used first to get synoptic information about the upper layer properties. Unfortunately, the ScanFish measurements had to be stopped untimely after a failure of the tow cable. However, the ScanFish transect could be repeated during the second half of the cruise. Afterwards MSS and CTD stations were performed.
The temperature distribution along the section shows a typical upwelling pattern with cold and low saline surface water on the coast. With increasing coastal distance the surface temperature rises.
The mixed layer depth is offshore at about 50 to 70 m. Above the outer shelf edge the vertical displacement of the isotherms points to internal waves. The salinity structure is more complex and shows the influence of lateral transport processes along the shelf.
Fig. 5.2.5 Distribution of temperature (left) and salinity (right) along the cross shelf transect at 23°S. The figure is based on the preliminary MSS data gathered from 19.08. - 21.08.2019.
Due to the exchange with the atmosphere the surface layer was well ventilated. Below the mixed surface layer the oxygen content decreases strongly. Off the shelf the core of the OMZ was observed at about 300 m. On the shelf, the oxygen demand of the sediments caused a further reduction of oxygen content in the bottom water. However, no anoxic areas were observed.
The high turbidity was found in the surface water due to high phytoplankton abundance and in the bottom layer on the inner shelf where the camera of the Pump-CTD depicted thick layers of marine snow.
Fig. 5.2.6 Distribution of dissolved oxygen concentration (left) and turbidity (right) along the cross shelf transect at 23°S. The figure is based on the preliminary MSS data gathered from 19.08. - 21.08.2019.
The water mass distribution on the 23°S transect depicted a maximum SACW fraction (>40%) at the shelf edge in depths below 150 m. The inner shelf was covered nearly completely by ESACW. Its high oxygen content prevented the establishment of anoxic conditions in the bottom layer. Using the water mass definitions of SACW and ESACW the Apparent Oxygen Utilisation was calculeted. The higest oxygen demand was observed in the deep layers of the inner shelf where the surface sediments contain a high concentration of organic carbon.
Fig. 5.2.7 Distribution of SACW fraction (left) and Apparent Oxygen Utilisation (right) along the cross shelf transect at 23°S. The figure is based on the preliminary MSS data gathered from 19.08. - 21.08.2019.
The dissipation rate of turbulent kinetic energy (TKE) is depicted in Fig 5.2.8. Hot spots of mixing are surface layer due to wind forcing, and the primary and secondary shelf breaks. Here internal waves interact with the topography and lead to break events of internal waves. This process resuspends settled material, which is then redistributed by the bottom currents.
Fig. 5.2.8 Distribution
of TKE dissipation (left) and eddy diffusivity (right) along the cross shelf transect at 23°S. The figure is based on the preliminary MSS data gathered from 19.08. - 21.08.2019.
Table 5.2.4: List of CTD stations, LADCP and AC-S casts Station No. Station
name DateTime Latitude Longitude Water
Depth CTD LADCP AC-S
Meteor NatMIRC [UTC] [m] cast cast cast
M157_1-1 12.08.2019 12:25 09° 26.71'S 000° 25.53'E 5446.0 V0001F01 - - M157_6-1 N23110 19.08.2019 18:57 23° 00.00'S 012° 20.00'E 2070.0 V0002F01 001 000 M157_12-2 N23030 21.08.2019 06:25 23° 00.00'S 013° 51.99'E 151.0 V0003H01 002 001 M157_14-2 N23020 21.08.2019 20:15 23° 00.01'S 014° 02.80'E 138.0 V0004H01 003 002 M157_16-3 N23010 22.08.2019 18:12 23° 00.00'S 014° 12.94'E 119.0 V0005H01 004 003 M157_15-14 N23015 23.08.2019 21:41 23° 00.00'S 014° 08.08'E 133.0 V0006H01 005 004 M157_17-2 N23005 23.08.2019 23:48 23° 00.01'S 014° 19.00'E 76.0 V0007H01 - (005) M157_2-8 N23002 24.08.2019 05:07 23° 00.01'S 014° 22.00'E 46.0 V0008H01 - (006) M157_16-14 N23010 24.08.2019 13:03 23° 00.04'S 014° 12.94'E 118.0 V0009H01 - - M157_14-14 N23020 24.08.2019 14:44 22° 60.00'S 014° 03.20'E 138.0 V0010H01 - - M157_12-21 N23030 25.08.2019 03:42 22° 60.00'S 013° 52.00'E 150.0 V0011H01 006 - M157_10-7 N23050 25.08.2019 09:46 22° 60.00'S 013° 30.01'E 241.0 V0012H01 007 (007) M157_9-2 N23060 25.08.2019 21:04 23° 00.00'S 013° 19.01'E 362.0 V0013H01 008 008 M157_11-4 N23040 26.08.2019 03:59 22° 59.99'S 013° 40.99'E 154.0 V0014_01 009 009 M157_16-24 N23010 28.08.2019 13:36 22° 59.99'S 014° 12.97'E 113.0 V0015H01 (010) - M157_8-2 N23070 28.08.2019 22:32 22° 59.96'S 013° 08.97'E 321.0 V0016H01 011 010 M157_24-1 31.08.2019 02:26 17° 16.02'S 011° 43.45'E 33.0 V0017H01 - (011) M157_25-1 31.08.2019 14:55 17° 16.02'S 011° 04.00'E 1515.0 V0018_01 012 (012) M157_25-3 31.08.2019 17:00 17° 16.02'S 011° 04.01'E 1516.0 V0019H01 013 - M157_26-2 31.08.2019 22:42 17° 16.02'S 011° 09.00'E 1101.0 V0020H01 014 (013)
Station No. Station
name DateTime Latitude Longitude Water
Depth CTD LADCP AC-S
Meteor NatMIRC [UTC] [m] cast cast cast
M157_27-1 01.09.2019 01:31 17° 16.01'S 011° 16.49'E 508.0 V0021H01 015 (014) M157_28-1 01.09.2019 06:12 17° 16.02'S 011° 30.06'E 151.0 V0022H01 016 (015) M157_29-1 01.09.2019 11:27 17° 15.72'S 011° 43.03'E 42.0 V0023H01 - (016) M157_30-1 01.09.2019 15:38 17° 20.39'S 011° 36.12'E 117.0 V0024H01 - (017) M157_16-25 N23010 03.09.2019 04:33 22° 60.00'S 014° 13.01'E 114.0 V0025H01 - - M157_14-18 N23020 03.09.2019 06:22 23° 00.02'S 014° 03.01'E 140.0 V0026H01 - - M157_31-1 N25100 03.09.2019 20:03 25° 00.00'S 012° 59.84'E 1802.0 V0027H01 017 (018) M157_43-2 N25015 05.09.2019 19:48 25° 00.00'S 014° 33.66'E 107.0 V0028H01 - 022 M157_44-2 N25010 06.09.2019 13:03 24° 60.00'S 014° 39.17'E 89.0 V0029_01 - 023 M157_34-4 N25070 06.09.2019 23:17 24° 59.99'S 013° 32.93'E 625.0 V0030H01 018 024 M157_36-2 N25060 07.09.2019 03:52 25° 00.00'S 013° 43.97'E 317.0 V0031H01 019 025 M157_38-2 N25050 07.09.2019 19:34 24° 60.00'S 013° 55.01'E 186.0 V0032H01 020 026 M157_39-2 N25040 07.09.2019 23:04 25° 00.01'S 014° 06.16'E 172.0 V0033H01 021 027 M157_41-14 N25025 09.09.2019 12:20 24° 60.00'S 014° 22.65'E 139.0 V0034H01 022 028 M157_40-2 N25030 10.09.2019 03:54 24° 59.99'S 014° 17.13'E 163.0 V0035_01 023 029 M157_42-2 N25020 10.09.2019 14:07 24° 59.98'S 014° 28.16'E 123.0 V0036_01 024 030 M157_43-19 N25015 10.09.2019 16:28 25° 00.00'S 014° 33.67'E 103.0 V0037H01 - - M157_45-2 N25005 10.09.2019 18:15 25° 00.01'S 014° 44.68'E 54.0 V0038H01 - 031 M157_46-3 N25002 10.09.2019 20:56 25° 00.00'S 014° 48.01'E 32.0 V0039H01 - 032 M157_49-3 LTCN 11.09.2019 11:20 25° 05.02'S 014° 32.09'E 113.0 V0040H01 - 033 M157_17-16 N23005 12.09.2019 19:47 23° 00.01'S 014° 19.01'E 75.0 V0041H01 - 034 M157_16-26 N23010 13.09.2019 03:55 22° 60.00'S 014° 13.00'E 114.0 V0042_01 - 035 M157_2-9 N23002 13.09.2019 11:15 22° 59.99'S 014° 22.01'E 46.0 V0043_01 - (036) Table 5.2.5: List of Pump-CTD casts
Station No. Station
name DateTime Latitude Longitude Water
Depth PCTD Remarks
Meteor NatMIRC [UTC] [m] cast
M157_1-3 12.08.2019 13:59 09° 26.72'S 000° 25.53'E 5443.0 Test deployment M157_14-4 N23020 22.08.2019 00:30 23° 00.00'S 014° 02.84'E 140.0 P0001_01 Nutrients M157_14-4 N23020 22.08.2019 03:45 23° 00.00'S 014° 02.84'E 137.0 P0001_02 Trace gas M157_14-4 N23020 22.08.2019 05:55 23° 00.00'S 014° 02.84'E 139.0 P0001F03 AFIS M157_16-6 N23010 22.08.2019 22:46 23° 00.00'S 014° 12.94'E 114.0 P0002F01 Nutrients M157_16-6 N23010 23.08.2019 03:19 22° 60.00'S 014° 12.94'E 115.0 P0002F02 Trace gas M157_16-6 N23010 23.08.2019 04:31 22° 60.00'S 014° 12.94'E 113.0 P0002F03 AFIS M157_14-15 N23020 24.08.2019 16:32 22° 60.00'S 014° 03.19'E 139.0 P0003F01 Nutrients M157_12-20 N23030 25.08.2019 03:00 22° 60.00'S 013° 52.00'E 149.0 P0004F01
P0004F02 Nutrients Trace gas M157_43-4 N25015 06.09.2019 00:00 25° 00.00'S 014° 33.66'E 105.0 P0005_02 Nutrients M157_43-5 N25015 06.09.2019 04:13 25° 00.00'S 014° 33.66'E 104.0 P0005_03 Trace gas M157_43-6 N25015 06.09.2019 05:34 25° 00.00'S 014° 33.66'E 106.0 P0005_04 AFIS M157_41-19 N25025 10.09.2019 02:11 24° 60.00'S 014° 22.71'E 139.0 P0006F02
P0006F03 Nutrients Trace gas M157_44-9 N25010 11.09.2019 20:36 25° 00.01'S 014° 39.16'E 83.0 P0007_01
P0007_02
Nutrients Trace gas M157_17-18 N23005 13.09.2019 02:14 23° 00.01'S 014° 19.01'E 77.0 P0008F01
P0008F02
Nutrients Trace gas M157_2-11 N23002 13.09.2019 14:03 22° 59.99'S 014° 22.01'E 47.0 P0009_01
P0009_02
Trace gas Nutrients Table 5.2.6: List of MSS stations and casts
Station No. Station
name DateTime Latitude Longitude Water
Depth Cast Remarks
Meteor NatMIRC [UTC] [m] [count]
M157_1-4 12.08.2019 14:28 09° 27.05'S 000° 25.73'E 5589.0 001-005 Test station M157_3-1 N23080 19.08.2019 11:30 23° 00.77'S 012° 56.93'E 610.0 006-008
M157_4-1 N23090 19.08.2019 13:19 23° 00.70'S 012° 47.31'E 943.0 009-010 M157_5-1 N23100 19.08.2019 15:35 23° 00.72'S 012° 35.18'E 1429.0 011-012