https://doi.org/10.1007/s00382-020-05238-x
Impact of ocean-atmosphere coupling on regional climate: the Iberian Peninsula case
William Cabos1 · Alba de la Vara2,3 · Francisco J. Álvarez‑García1 · Enrique Sánchez4 · Kevin Sieck5 · Juan‑Ignacio Pérez‑Sanz6 · Natalia Limareva7 · Dmitry V. Sein8,9
Received: 27 October 2019 / Accepted: 7 April 2020 / Published online: 16 April 2020
© The Author(s) 2020
Abstract
Regional models used for downscaling the European climate usually include a relatively small area of the Atlantic Ocean and are uncoupled, with the SST used as lower boundary conditions much coarser than the mesh of the regional atmospheric model. Concerns thus arise about the proper representation of the oceanic influence and the role of air-sea coupling in such experiments. A complex orography and the exposure to different air and ocean masses make the Iberian Peninsula (IP) an ideal test case for exploring the impact of including explicitly the North Atlantic in the regional domain and the added value that coupling brings to regional climate modeling. To this end, the regionally-coupled model ROM and its atmospheric component, the regional atmospheric model REMO are used in a set of coupled and uncoupled experiments forced by the ERA-Interim reanalysis and by the global climate model MPI-ESM. The atmospheric domain is the same in all simulations and includes the North Atlantic and the ocean component is global and eddy permitting. Results show that the impact of air-sea coupling on the IP winter biases can be traced back to the features of the simulated North Atlantic Ocean circulation.
In summer, it is the air-sea interactions in the Mediterranean that exert the largest influence on the regional biases. Despite improvements introduced by the eddy-permitting ocean, it is suggested that a higher resolution could be needed for a correct simulation of the features of the large-scale atmospheric circulation that impact the climate of the IP.
Keywords Regional climate model · Ocean-atmosphere coupling · Eddy-permitting ocean · Climate of the Iberian Peninsula · North Atlantic
1 Introduction
Earth system models (ESMs) are, at the moment, the most sophisticated tool available to the scientific community to investigate global climate and its driving mechanisms. ESMs comprise an interactive representation of the global atmos- phere, ocean, land and sea-ice, coupled to biogeochemical
Electronic supplementary material The online version of this article (https ://doi.org/10.1007/s0038 2-020-05238 -x) contains supplementary material, which is available to authorized users.
* William Cabos william.cabos@uah.es
1 Department of Physics, University of Alcalá, Alcalá de Henares, Madrid, Spain
2 Environmental Sciences Institute, University of Castilla-La Mancha, Avenida Carlos III s/n, 45071 Toledo, Spain
3 Departamento de Matemática Aplicada a la Ingeniería Industrial, E.T.S.I. Industriales, Universidad Politécnica de Madrid, c/ José Gutiérrez Abascal, 2, 28006 Madrid, Spain
4 Facultad de Ciencias Ambientales y Bioquímica, Universidad de Castilla-La Mancha, Toledo, Spain
5 Climate Service Center, Helmholtz Zentrum, Geesthacht, Hamburg, Germany
6 Department of Computer Engineering, University of Alcalá, Alcalá de Henares, Madrid, Spain
7 North Caucasus Federal University, Stavropol, Russia
8 Alfred Wegener Institute for Polar and Marine Research, Bremerhaven, Germany
9 Shirshov Institute of Oceanology, Russian Academy of Science, Moscow, Russia
4442 W. Cabos et al.
and hydrological components, allowing a thorough descrip- tion of the Earth’s climate system (Taylor et al. 2012). ESMs are used to gain insight into long-term and decadal climatic patterns, as well as for medium- and short-term climate and weather prediction. However, for long-term climate simula- tions, state-of-the-art ESMs are run with horizontal resolu- tions (roughly 70–200 km in the atmosphere and 50–100 km in the ocean) that are still insufficient for local and/or regional climate studies (Collins et al. 2018). In this con- text, regional climate models (RCMs) constitute an excellent tool to overcome this drawback of current ESMs (e.g. Rum- mukainen 2016). RCMs provide dynamically-downscaled climate information with higher resolution than the global models within the region of interest. The higher spatial reso- lution grants a better representation of topography, land-sea gradients, land uses, and mesoscale processes. Furthermore, enhanced horizontal resolution RCMs represent atmospheric convection explicitly, which improves the simulation of spa- tial and temporal variability of precipitation (e.g. Di Luca et al. 2012).
Atmospheric RCMs are composed of an atmospheric model which allows for the interaction of the atmosphere with land processes, while the initial conditions and the time-dependent lateral and surface boundary conditions over the ocean and sea-ice are taken from reanalysis and global models (e.g. Giorgi and Gutowski 2015). The high-resolu- tion atmosphere is commonly forced by a much lower-res- olution ocean state. Whereas atmospheric RCMs constitute an adequate tool for many regional studies, their applica- tion is tentative when air-sea interactions are relevant for the regional and local climate or over regions of strong sea- surface temperature (SST) gradients (Li et al. 2012; Giorgi and Gao 2018). In those cases, Regional Atmosphere-Ocean Coupled Models (RAOCMs) are a more suitable instrument because they are able to resolve explicitly air-sea interac- tions at spatial scales that, at best, are parameterized in global models (i.e.Haarsma et al. 2016; Hewitt et al. 2017).
RAOCMs have recently been successfully applied to study areas where air-sea feedbacks play a relevant role, usually providing a better representation of the spatial distribution of ocean and atmospheric variables. This is the case of mon- soon-dominated regions (Aldrian et al. 2005; Ratnam et al.
2008; Di Sante et al. 2019) the Mediterranean Sea (Somot et al. 2008, 2018; Akhtar et al. 2018; Darmaki et al. 2019), the Arctic region (e.g.Mikolajewicz et al. 2005; Sein et al.
2014), the North Atlantic (Sein et al. 2015) and the tropical Atlantic (Cabos et al. 2017; Sun et al. 2018).
One of these regions where high-resolution RAOCMs are potentially necessary to achieve a correct represen- tation of regional climate is the Iberian Peninsula (IP).
The interaction of a set of air masses with a particularly complex topography, in combination with the existing land-sea contrasts, produces a range of differentiated
regional climates with a marked inter-annual variability within the IP. This makes the IP an excellent place to test the ability of state-of-the-art climate models. Regarding the large scale atmospheric circulation, the IP climate is largely controlled by the Azores High and the Icelandic Low (e.g. Martin-Vide and Olcina 2001). In winter, the subtropical high-pressure cell tends to be weaker and cen- tred at lower latitudes, so that the IP is affected by westerly circulation combined with the perturbations originated by the polar front. In summer, the Iceland Low pressure sys- tem is weakened and the Azores High moves toward the central Atlantic, is reinforced and expands towards higher latitudes, blocking the western circulation over the pen- insula except for the northern region. The Iberian climate is also influenced by the oceanic circulation in the North Atlantic and the Mediterranean Sea. In particular, the cli- mate of the Iberian Peninsula is affected by changes in the large-scale oceanic circulation in the North Atlantic sub- tropical Gyre. The Gulf Stream, after the separation from the North American continental slope, becomes the North Atlantic Current, a freely meandering jet to the northeast (Keeley et al. 2012). Some of the North Atlantic Current waters go into the Nordic Seas, but a major part turns westward and southward, feeding the circulation of the Bay of Biscay and the North Atlantic gyre. The Canary Eastern Boundary Current (Fiúza 1983), the southbound branch of the gyre, advects cold water along the west- ern Iberian margin, directly affecting the climate of the western Iberia Peninsula. Therefore, changes in the Gulf Stream can have an indirect effect (i.e., through the other ocean currents that conform the North Atlantic Gyre) on the climate of the IP. The oceanic circulation along the Atlantic Iberian coast is strongly dependent on the large- scale atmospheric circulation. In summer, the southward winds associated with the Azores High induce upwelling of cold, nutrient-rich intermediate waters and southward surface circulation along the western Iberian coast (Bakun and Nelson 1991; Soares et al. 2014; Rijo et al. 2017). In turn, the reduced sea-surface temperature associated with upwelling increases the thermal gradient at the coast and triggers higher wind speeds (Rijo et al. 2017). In winter, the Iceland Low intensifies, causing northeastward winds off Iberia and displacing the center of the Azores High off the northwestern African coast, promoting large seasonal changes in the ocean circulation. The climate of the IP, especially at its eastern fringe, is also influenced by the Mediterranean Sea circulation (Martin-Vide and Lopez- Bustins 2006). Besides coastal processes, conditions in the Mediterranean affect the Iberian climate through the air masses that can penetrate the IP from the east or the southeast (Font-Tullot 2000). In turn, the Mediterranean Sea encompasses a complete thermohaline circulation system, which is influenced by air-sea interaction, the
Mediterranean-Atlantic water exchange (Flecker et al.
2015) and the North Atlantic large-scale climatic patterns (Liguori et al. 2017).
In this context, a correct simulation of the climate of the IP requires an appropriate simulation of the coupled North Atlantic-Mediterranean climate system. Currently, oceanic and atmospheric components of state-of-the-art global models used in the coordinated Coupled Model Intercomparison Project (i.e., CMIP; see Meehl et al. 2000 for details) have an insufficient horizontal resolution to resolve the dynamics of key regions for global climate such as the North Atlantic and model resolution plays a very important role in the simulated climate (Sein et al.
2018). To adequately reproduce the most relevant features of the North Atlantic circulation, such as the Subpolar Gyre or the path or the Gulf Stream and the North Atlantic Current, oceanic eddy-permitting resolutions are needed (Marzocchi et al. 2015). In turn, higher atmospheric reso- lution amplifies storm-track response to global warming (Willison et al. 2015) and leads to enhanced extratropi- cal cyclone activity that is most evident in the northeast North Atlantic (Michelis et al. 2017). The IP is included in the domain used in the European and Mediterranean branches of the international COordinate Regional climate coordinated Downscaling EXperiment (Euro-CORDEX and Med-CORDEX) initiative project (https ://www.corde x.org/). Although many simulations have been carried out in the framework of the CORDEX initiative and in previous similar projects as ENSEMBLES (Jacob et al.
2007) and PRUDENCE (Van der Linden and Mitchell 2009), our downscaling experiments differ from them in two important ways. First, in the CORDEX simulations the atmospheric models are run in uncoupled mode. Sec- ond, in the CORDEX domains the IP is very close to the western boundaries. Therefore, our experiments allow us to explore two important features of the regional climate not considered in these previous studies: (i) the Atlantic mesoscale circulation (both atmospheric and oceanic) and (ii) the ocean-atmospheric coupling in the Atlantic Ocean and the Mediterranean Sea. The main aim of this study is to examine the sensitivity of the present-day climate of the Iberian Peninsula to air-sea coupling processes. To that end, we perform a series of ocean-atmosphere coupled and atmosphere-only simulations with the regionally-coupled model ROM and the atmospheric model REMO. The pos- sible mechanisms which drive the observed changes are also examined. The atmospheric domain, with a horizontal resolution of ~ 25 km, is common for ROM and REMO and covers the North Atlantic and the Mediterranean. Out- side of the coupled domain, simulations are forced either by ERA-Interim Reanalysis or the global coupled model MPI-ESM.
2 Model setup and simulations
In this work we use the regionally-coupled model ROM (Sein et al. 2015) and its stand-alone atmospheric com- ponent REMO (Jacob 2001). Both REMO (Deque et al.
2012; Jimenez-Guerrero et al. 2013; Kotlarski et al. 2014) and ROM (Sein et al. 2014; Cabos et al. 2018; Darmaki et al. 2019) models have been widely used to investigate regional climate and climate change signal within differ- ent areas of the world. In ROM, the ocean component is the Max Planck Institute Ocean Model (MPIOM;Marsland et al. 2003; Jungclaus et al. 2013). MPIOM is a free-sur- face model based on the primitive equations that uses the Boussinesq and incompressibility approximations. The model is formulated on an orthogonal curvilinear grid that can be stretched. This allows us to achieve high resolu- tion in the region of interest while maintaining a global domain at an acceptable computational cost. In turn, the use of a global ocean model avoids problems associated with either open or closed boundaries typical of limited- area regional ocean models. The horizontal resolution in MPIOM reaches up to 10 km (eddy permitting) in the sur- roundings of the IP and decreases gradually, reaching a minimum of 100 km in the southern seas. MPIOM has 40 unevenly spaced vertical z-levels the thickness of which increases gradually. The shallowest and deepest levels are 12 and 650 m thick, respectively. In MPIOM, different to many other models, water exchange at Gibraltar is not parameterized. Furthermore, we do not restore Atlantic water properties towards climatologically values near the strait. Therefore, the global ocean allows us to simulate explicitly, in a physically consistent way, the Gibraltar and Dardanelles straits, allowing us to capture the influence of North Atlantic and Black Sea waters on the Mediter- ranean Sea.
For the atmosphere, ROM uses the limited-area Regional Model (REMO). Its dynamical core is based on the Europa- Model of the German Weather service (Majewski 1991) whilst physical parameterizations are taken from versions 4 and 5 of the global climate model ECHAM (Roeckner et al.
1996, 2003). REMO uses a rotated grid with the equator positioned in the center of the model domain. This allows us to avoid the largely different extensions of the grid cells close to the poles. REMO is a limited-area model in which most of the prognostic variables are relaxed towards forc- ing data in the outer eight rows of the model area follow- ing Davies 1976) A radiative upper boundary condition is applied following Klemp and Durran 1983) and Bougeault 1983) The global hydrological discharge model (HD, Hage- mann and Dümenil Gates 2001) calculates river runoff and is coupled to both the atmosphere and ocean. In these experi- ments, REMO is run with a uniform horizontal resolution
4444 W. Cabos et al.
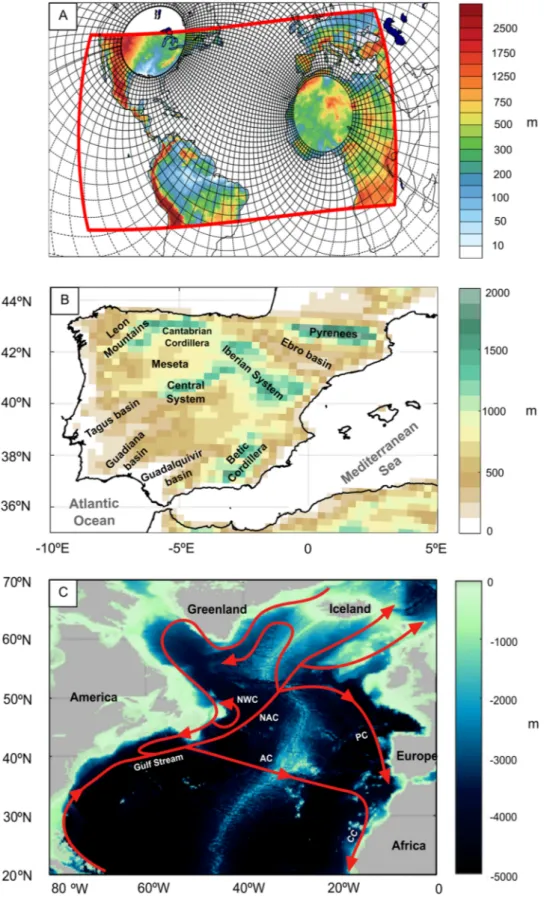
of 0.25° in the rotated grid and has 27 hybrid vertical lev- els. The atmospheric domain used in this study allows us to take into account explicitly the North Atlantic (see Fig. 1a),
which is excluded in many regional climate models address- ing the European or IP climate (Jacob et al. 2014; Cardoso et al. 2019), as well as the entire Mediterranean Sea.
Fig. 1 a ROM atmospheric and oceanic grids. The red line shows the limits of the atmospheric domain, while the black lines represent the oceanic mesh (each 12th line is shown).
b Topography of the Iberian Peninsula adopted in this study.
c Illustration of the main ocean currents in the North Atlantic.
WBC Western Boundary Cur- rent, NAC North Atlantic Cur- rent, AC Azores Current, CC Canary Current, PC Portugal Current, NWC Northwestern Corner
REMO and MPIOM are coupled via the OASIS coupler (Valcke et al. 2003), which provides exchange between the ocean and atmosphere models with a 3-h coupling time step.
More details about the coupling procedure can be found in Sein et al. 2015) Lateral atmospheric boundary conditions and upper oceanic forcing outside the coupled domain were prescribed using ERA-Interim reanalysis (Dee et al. 2011).
Additionally, we carry out simulations forced by present time MPI-ESM CMIP5 runs (Stevens et al. 2013), instead of ERA-Interim. This allows us to analyse how the impact of the coupling on the climate of the IP is modulated by the driving fields. To validate the modeled results we use the following reanalyses and observed gridded datasets:
1 ECA&D (European Climate Assessment & Dataset) observational E-OBS database (Haylock et al. 2008), a land-only, daily, high-resolution (0.25° × 0.25°) grid- ded data set. E-OBS is a reconstruction of the evolution of the near-surface air temperature and precipitation for the recent past (spanning from 1950 to 2015) that is supported by the Network of European Meteorological Services (EUMETNET). The downloaded variables are mean, maximum and minimum temperature, as well as precipitation.
2 The atmospheric ERA-Interim reanalysis (Dee et al.
2011) is used for validation of mean sea level pressure (MSLP), 10-m winds (W10) and 2-m air temperature (T2M). The ERA-Interim fields used here have a 0.75°
× 0.75° resolution and a monthly frequency.
3 The sea surface temperature simulated in the coupled runs is evaluated by comparison to the optimum inter- polation SST (OISST) analysis, which is available on a 0.25° grid (Reynolds et al. 2007).
4 We use the AVISO Altimetry for the period 1992–2010, also available at 0.25° resolution, which can be retrieved from https ://podaa c.jpl.nasa.gov/datas et/AVISO _L4_
DYN_TOPO_1DEG_1MO) for validation of the SSH.
The biases in T2M, precipitation, SST and MSLP in the simulated period have been compared in both the coupled and the uncoupled runs to the mean changes in these vari- ables from the first to the second half of the interval. As these changes are in general substantially smaller than the biases, we can hence consider that the biases in the simula- tions discussed below are systematic.
3 Results
3.1 Impact of air‑sea coupling on the climate of the IP
In Sect. 3.1.1 the regional distribution of E-OBS mean (T2M), daily minimum (TMIN) and daily maximum (TMAX) 2-m temperature over the IP for winter (DJF) and summer (JJA) is studied. Different to other works, we also include TMIN and TMAX to gain insight into their relative contributions on T2M. Then, the focus is on the regional distribution of REMO temperature biases relative to E-OBS observational gridded dataset. Finally, tempera- ture differences between ROM and REMO are analysed.
This provides understanding into temperature changes that occur in response to air-sea coupling. In Sect. 3.1.2, the same procedure is followed but taking into consideration precipitation instead.
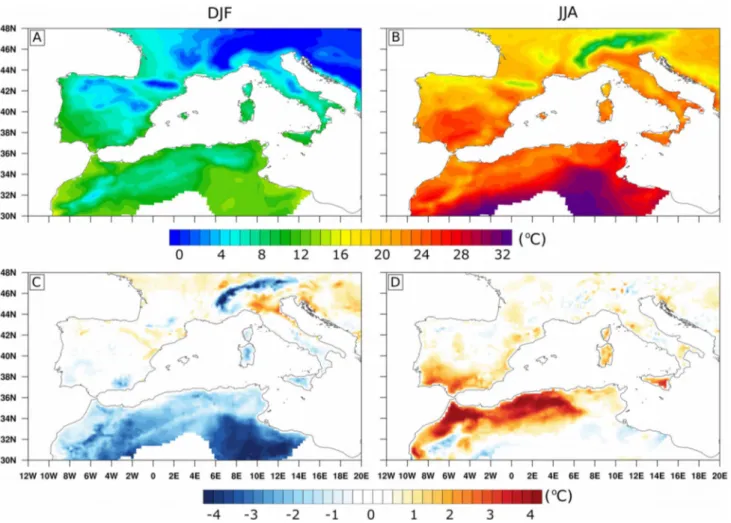
3.1.1 Mean, minimum and maximum 2-m temperature In both seasons mean, daily minimum and daily maximum E-OBS observational temperatures are clearly influenced by topography (Figs. 2a, b, 3a, b, 4a, b). This leads to lower values on highly-elevated mountain ranges - espe- cially in winter. In all cases, temperatures attain a smaller magnitude in areas such as the Pyrenees, the Iberian Sys- tem, the Central System, the Cantabrian Cordillera, the Leon Mountains and the Betic Cordillera (see a location map in Fig. 1b). Summer temperatures from E-OBS are highest along the major river depressions, namely the Guadalquivir, Guadiana and Ebro basins. REMO model simulates winter daily mean temperatures quite well and biases are relatively small (Fig. 2c). Note that whilst the model domain covers the entire Mediterranean Sea, only the Western Mediterranean is represented in these figures in order to allow for a proper visualization of small-scale features near the IP which are relevant for this study.
Focusing on the regional distribution of errors, REMO overestimates T2M by about 1 °C in the Ebro basin, while simulated mean T2M are more than 1 °C colder than E-OBS in the Betic Cordillera, the Guadiana basin and in the lowlands located north of the Pyrenees. Elsewhere in the IP, errors are negligible. The fact that the largest errors are found in depressed and/or highly-elevated regions should be taken carefully since this may be influenced by factors such as the limited amount of meteorological sta- tions in topographic highs and lows or the specific vertical interpolation schemes adopted (see Herrera et al. 2016 and references therein). On average, winter biases over the IP for the considered time period take a value of – 0.05 °C
4446 W. Cabos et al.
(see Table 1, where a compilation of REMO and ROM biases is provided). In summer, T2M biases are generally positive and concentrate mostly over the southern por- tion of the IP and along the Mediterranean coast (Fig. 2d).
Maximum errors occur within the Guadalquivir and Gua- diana river basins, where mean temperatures are up to 2 °C above observations. The concentration of biases along the coastal band highlights that the lack of air-sea interactions could play an important role in the generation of errors in this season. Summer mean temperature biases are higher than in any other season and attain an average value of 0.57 °C within the IP (see Table 1). In general, the larg- est T2M biases are located in regions where larger tem- peratures are obtained, pointing to a role of the simulated nocturnal boundary layer and/or radiative fluxes. In order to identify the physical mechanisms responsible for these biases we proceed to analyze the TMAX and TMIN biases.
Focusing on TMIN biases we note that, regardless of the season, REMO simulates the IP daily minimum tempera- tures warmer than observed (Table 1). This is in line with
results from the ESCENA project, in which the ensemble mean TMIN is overestimated in all seasons (Jiménez-Guer- rero et al. 2013). However, the spatial distribution of biases differs: in REMO they are slightly higher than observa- tions over most of the IP (Fig. 3c, d), while in the ESCENA ensemble mean daily minimum temperatures appear overes- timated (up to 3–4 °C) in high and low regions and are below observations elsewhere. As for the T2M, TMIN biases in REMO are largest in the Ebro river basin, including coastal regions of Aragon and Gerona (Fig. 3c). Negative errors are found north of the Pyrenees and in the Sierra Nevada and these biases are also found in T2M. On average, winter TMIN within the IP features an error of 1.05 °C. In sum- mer, also in agreement with what is found for T2M, TMIN is too high (up to 2 °C above E-OBS) over most of Anda- lusia, especially in the Guadalquivir and Guadiana basins (Fig. 3d). These biases are quite similar to T2M bias summer patterns and could be related to distortions in the noctur- nal boundary layer. Additionally, positive errors now also found in the northern half of the IP (i.e. Meseta). In this
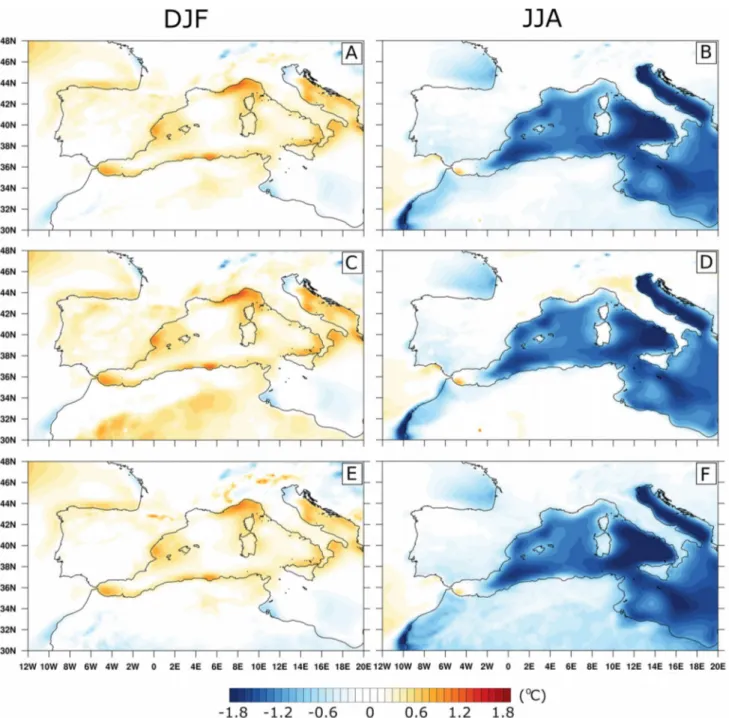
Fig. 2 Winter (DJF; left column) and summer (JJA; right column) averages of daily 2-m air temperature (T2M), in °C, computed for the 1980–2012 time period. a, b E-OBS T2M. c, d T2M biases of REMO
relative to E-OBS (positive values correspond to warm biases and negative values the opposite)
season, TMIN exhibits a mean bias of 0.99 °C. Interestingly enough, positive errors on topographic highs in our REMO simulation are smaller than those found in REMO and in the ensemble mean in the ESCENA project.
Focusing now on REMO daily TMAX biases, we observe that these are positive in both seasons (Table 1) and gen- erally of a smaller magnitude and opposite sign than the biases of the ESCENA ensemble mean (Jiménez-Guerrero et al. 2013). TMAX is below observations in the Iberian System and is higher than observed elsewhere (Fig. 4c, d).
REMO winter biases over the IP attains a mean value of 0.35
°C over the IP and simulates the most remarkable positive errors (greater than 2 °C) in regions such as the Ebro, Gua- dalquivir or Guadiana basins (Fig. 4c). In summer, TMAX is overestimated in the near-shore region, especially over the eastern and southern coasts of the IP, where errors reach up to 4 °C (Fig. 4d). These summer near-shore biases are alleviated in ROM, where the ocean-atmosphere interac- tions are explicitly represented (see Fig. 4d), and we can say that the lack of air-sea feedbacks is one of the important drivers of the temperature errors in summertime. Elsewhere
in the IP, biases have a smaller magnitude and are mostly negative. The reported regional distribution of maximum summer temperatures is similar to that obtained from the atmospheric circulation model PROMES, also participating in the ESCENA project (Jiménez-Guerrero et al. 2013). In summer, daily maximum temperature biases are larger than in winter and reach 0.94 °C in the IP. In view of the results presented so far, we can conclude that REMO is able to capture well the regional distribution of the 2-m temperature relative to state-of-the-art climate models.
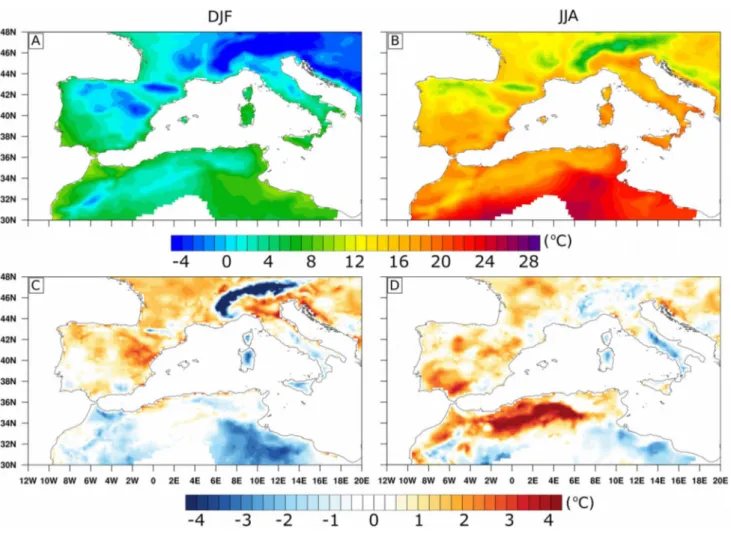
To finish this section, we now examine Fig. 5, which shows the climatological differences of T2M (a, b), TMAX (c, d) and TMIN (e, f) between ROM and REMO. In this figure, negative values indicate that a temperature drop occurs in ROM (i.e., temperature falls in response to air-sea coupling). These temperature differences can be attributed to the impact of the ocean-atmospheric coupling processes in the adjacent Atlantic Ocean and Mediterra- nean Sea on the IP climate. They are more relevant in near coastal regions, pointing to an increasing relevance of local land-atmosphere phenomena over the impact of
Fig. 3 As in Fig. 2, but means are calculated for the minimum temperature (TMIN)
4448 W. Cabos et al.
air-sea coupling further from the coast. In our experi- ments, air-sea coupling has an opposite imprint on 2-m air temperature depending on the season. In winter, tempera- ture experiences a subtle rise due to coupling (see Fig. 5a, c, e; Table 1). This temperature rise triggered by coupling can only be regarded as an improvement of the regional distribution of temperature in topographically elevated areas such as the Pyrenees or the Betic System. Although some caution should be taken when interpreting this result, as the observational uncertainty can be of similar magni- tude than the difference (see e.g. Kotlarski et al. 2017).
On the contrary, in summer, air-sea feedbacks inherent to coupling induce a temperature drop (see Fig. 5b, d, f;
Table 1). This contributes to a reduction of warm biases, especially in near-shore areas located in the southern half of the IP. We can conclude that the introduction of air-sea interactions with ROM does not improve the representa- tion of winter temperatures, but has a positive impact on the representation of T2M, TMIN and TMAX over the IP in summertime. In summer, warm biases are alleviated
Fig. 4 As in Fig. 2, but averages are computed for the maximum temperature (TMAX)
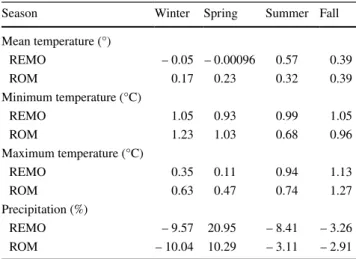
Table 1 Mean, minimum and maximum 2 m-temperature, as well as precipitation biases for the simulations performed with REMO and ROM forced by ERA-Interim relative to E-OBS
Temperature and precipitation biases are given in °C and %, respec- tively
Season Winter Spring Summer Fall
Mean temperature (°)
REMO – 0.05 – 0.00096 0.57 0.39
ROM 0.17 0.23 0.32 0.39
Minimum temperature (°C)
REMO 1.05 0.93 0.99 1.05
ROM 1.23 1.03 0.68 0.96
Maximum temperature (°C)
REMO 0.35 0.11 0.94 1.13
ROM 0.63 0.47 0.74 1.27
Precipitation (%)
REMO – 9.57 20.95 – 8.41 – 3.26
ROM – 10.04 10.29 – 3.11 – 2.91
even more than 30% (Table 1).This is a relevant result given that REMO reproduces the largest biases in T2M in the summer (see Figs. 2d, 3d, 4d; Table 1). The reduction of the summer bias occurs also for TMIN and TMAX, in an approximately similar proportion. For other seasons, though, ROM generally raises the warm bias, particularly for TMAX. The coupled processes incorporated by ROM
can hence modify the biases in REMO in complex, sea- sonally-dependent fashions.
3.1.2 Precipitation
Here the same analysis performed above is carried out but, in this case, we focus on precipitation. In both sea- sons, E-OBS precipitation shows the marked regional and
Fig. 5 Winter (DJF; left column) and summer (JJA; right column) means of 2-m temperature (T2M) differences between ROM and REMO, in °C, calculated for the 1980–2012 period. a, b Mean tem-
perature. c, d Maximum temperature (TMAX). e, f Minimum tem- perature (TMIN). Positive values indicate that 2-m air temperature is higher in ROM than in REMO
4450 W. Cabos et al.
seasonal variability of precipitation over the IP which results from the interplay of its complex orography and atmospheric regimes (Fig. 6a, b; see also Herrera et al. 2012). Winter pre- cipitation features a marked NW-SE gradient with minimum
values to the SE and maximum values to the NW of the IP, where Atlantic frontal systems arrive continuously (Zorita et al. 1992; Rodríguez-Puebla et al. 1998, 2001). The effect of topography on rainfall can be clearly observed. On the
Fig. 6 Winter (DJF; left column) and summer (JJA; right column) averages of precipitation, in mm/day, computed taking into account the 1980–2012 interval. Upper row (a, b): E-OBS precipitation;
Central row (c, d): precipitation biases of REMO relative to E-OBS;
Lower row (e, f): differences in precipitation between ROM and REMO. Positive values in c and d indicate that REMO features a wet bias. Positive values in e and f highlight that ROM precipitation is greater than in REMO
one hand, precipitation is enhanced over the Guadalquivir and Tagus basins, along which moisture from the Atlantic is transported towards the interior of the IP. On the other hand, rainfall is enhanced over the Cantabrian Mountains and the Pyrenees, as well as in the Betic Cordillera (Sierra Nevada). Precipitation exceeds 6 mm/day over Galicia and the north of Portugal. Winter rainfall is lower than 1 mm/day along the eastern Mediterranean coast, where precipitation is scarce and often related to autumn convective processes due to the combination of a warm SST and topographic con- trol (Martín et al. 2007). In summer, precipitation decreases substantially and exhibits a typical N–S gradient, with the highest values along the northern flank of the IP. It reaches more than 1 mm/d to the north, where Atlantic fronts still arrive, and values close to 0 mm/day to the south of Iberia (Durán et al. 2013).
Putting the focus on ROM-REMO differences we note that, in winter, the spatial distribution of REMO precipi- tation biases shows great spatial variability (Fig. 6c). In agreement with former model studies (Cardoso et al. 2013), REMO tends to overestimate precipitation in highly-elevated regions, and to underestimate it in low areas. The model has a wet bias in the western Pyrenees, the Cantabrian Moun- tains, the Central System and the Betic Cordillera. As stated above, care should be taken in the interpretation of these results, given that these could be influenced by the scarcity of observational data in mountain belts (Jiménez-Guerrero et al. 2013). REMO has a dry bias in the Guadiana and Gua- dalquivir river basins, as well as in the southern portion of Portugal, the latter characterised by a flat topography. The underestimation of precipitation in those river basins may be related to the fact that insufficient horizontal resolution does not allow the model to properly simulate the orographic funnelling of vapour-enriched air towards the interior of the IP from the Atlantic. There is also a dry bias in the cen- tral and eastern Pyrenees, maybe as a consequence of water vapour depletion in the excessive rainfall to the west. In summer, precipitation is small and so are the associated biases (Fig. 6d). REMO depicts a subtle wet bias over the Pyrenees and a small dry bias over the northeastern coast of the IP. In all seasons, except for spring, REMO features a negative (dry) bias relative to E-OBS over the IP (Table 1).
REMO winter and summer mean precipitation biases over the IP are − 9.57% and − 8.41%, respectively.
In ROM, when the air-sea coupling is activated, precipita- tion changes in response to ocean-atmosphere interactions also exhibit a marked seasonal variability (Fig. 6e, f). Winter rainfall increases over the northern flank of the IP and the Mediterranean coast, while it decreases all over the western coast of the IP towards the interior. The observed changes induce an overall enhancement of precipitation biases, but a remarkably improved representation of rainfall along the northern coast of Portugal. In summer, precipitation slightly
increases to the NW of the IP and it gets smaller towards the NE, the latter improving the representation of precipitation in the Pyrenees. Winter and summer precipitation biases found with ROM are − 10.04% and − 3.11%, respectively (Table 1). As for temperature, coupling reduces substantially precipitation biases in summer. It is relevant to note that biases in ROM are of smaller magnitude than in REMO in all seasons, except for winter.
3.2 Influence of air‑sea interactions on North Atlantic MSLP and SST
Now we examine the ability of the different model setups to reproduce the regional distribution of the SST from OIS- STV2, as well as the MSLP from ERA-Interim in the North Atlantic. Results are presented in the same order as in the two previous sections. An adequate representation of these variables is important to guarantee a correct simulation of the mean climate in the North Atlantic—and therefore the Iberian climate (Trigo et al. 2004). The adequate simulation of the SST is particularly important for a proper representa- tion of Atlantic storm tracks and blocking (Nakamura et al.
2008; O’Reilly et al. 2016). In turn the simulated oceanic circulation is strongly influenced by the ocean-atmosphere interaction (Ma et al. 2016) and the large-scale atmospheric circulation, which can be evaluated via the MSLP (e.g. Hue- ging et al. 2013). Starting the analysis from the SST we observe that, regardless of the season, SST from OISSTV2 exhibits a clear latitudinal pattern, with the highest tempera- tures near the equator and the lowest values near the Lab- rador Sea, where the AMOC is fueled by deep convection triggered by cooling (Fig. 7a, b). In both seasons, the path of the warm Gulf Stream and the North Atlantic Current are clearly visible due to the development of characteristic, strong SST gradients (see the schematic representation of these currents in Fig. 1c). These currents advect heat from the Gulf of Mexico towards the western coast of Europe, leading to a zonal contrast in SST which is crucial to achieve an adequate representation of the climate over the IP (Buck- ley and Marshall 2016; Collins et al. 2018). We now explore the SST differences between ERA-Interim reanalysis (used to force REMO) and the higher-resolution OISSTV2 dataset (Fig. 7c, d). Differences can mainly be seen in the region occupied by the Gulf Stream and the North Atlantic Current and attain a maximum magnitude of 2−3 °C in winter and in summer. These differences may be related to the lower resolution of ERA-Interim, which is insufficient to resolve the strong SST gradients that arise along the path of the Gulf Stream and the North Atlantic. Elsewhere in the North Atlantic, SST differences between both datasets are close to zero. Differences between the SST simulated by ROM and the SST from OISSTV2 are more pronounced (Fig. 7e, f). In winter, warm biases can be traced from the Gulf of Mexico
4452 W. Cabos et al.
(30° N), offshore, towards the northeast of the North Atlan- tic. Maximum errors greater than 3 °C arise near 30° W and 40° N−50° N. West of this warm band, negative biases develop with peak values close to − 4 to − 5 °C south of Greenland. The spatial distribution and magnitude of ROM SST biases is in line with former model studies (e.g. Ran- dall et al. 2007). The origin of these biases is related to a deficient representation of the Gulf Stream, which separates earlier than observed from the USA coast, and to the incor- rect path of the simulated North Atlantic Current, which is too zonal (Eden and Greatbatch 2003; Bryan et al. 2007). In
summer, however, warm biases are more modest and gener- ally do not exceed 1 −2 °C. In this season, cold biases attain again up to − 5 °C in the same region as in winter, and seem to be somewhat enhanced off the US coast, as compared to winter. This hints at a better representation of the path of the Gulf Stream and of the North Atlantic Current in summer than in winter. The latter appears to be too narrow, though (as discussed further below, see Fig. 9), and to flow somewhat southwards relative to observations, yielding the cold biases along its northern fringe. Both in winter and summer, comparatively weaker cold biases cover the western
Fig. 7 Winter (DJF; left column) and summer (JJA; right column) means of SST, in °C, computed for the 1980–2012 time period.
Upper row (a, b): OISSTV2 SST; Central row (c, d): SST biases of ERA-Interim relative to OISSTV2; Lower row (e, f): SST differences
between ROM and ERA-Interim. Positive values in c and d indicate that ERA-Interim has a warm bias. Positive values in e and f mean that ROM SSTs are greater than in ERA-Interim reanalysis
subtropical North Atlantic. The seasonal configuration of ocean currents and its impact on the SST will be addressed in more detail in the Sect. 4.
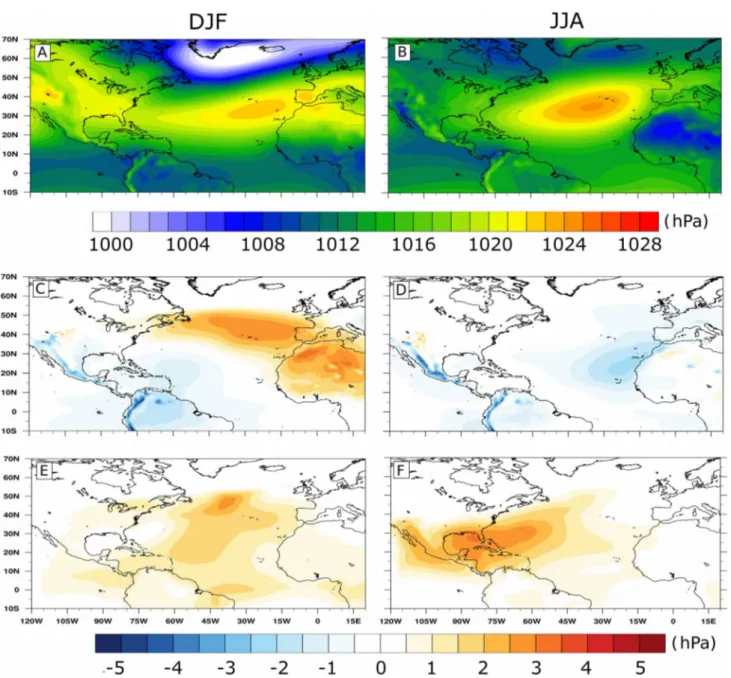
As pointed out above, another variable that exerts a first- order influence on the mean climate of the IP is the MSLP (Barcikowska et al. 2017). Seasonal changes in the strength of the Azores High and the Icelandic Low induce impor- tant variations of large-scale winds and therefore on heat advection towards the IP. ERA-Interim data captures well the Azores High and the Icelandic Low and their season- ality (Fig. 8a, b). In winter, the Icelandic Low is intense
and minimum MSLP falls below 1000 hPa at its center. The Azores High sits off the northwestern African coast, between the Azores and the Canary Islands, and attains values close to 1020–1024 hPa. In summer, the Icelandic Low becomes less intense and minimum MSLP rises to about 1008 hPa.
The smaller extent of the low-pressure cell favours an inten- sification of the Azores High, which shifts its center to the central North Atlantic. Regarding REMO MSLP biases over the North Atlantic, in winter, the model differs from the observed pattern by a high-pressure cell of 3 hPa centered north of the Azores Islands (Fig. 8c). Positive biases can be
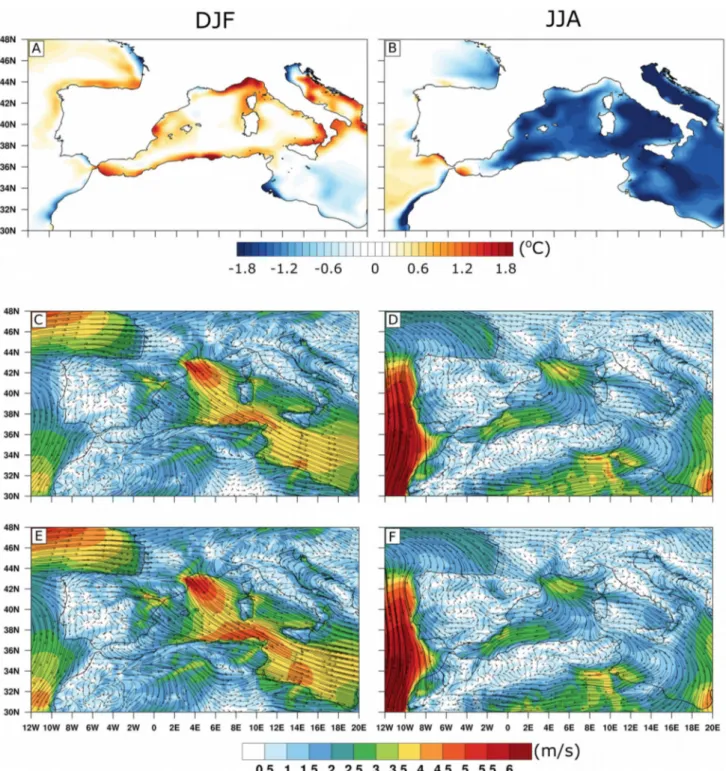
Fig. 8 a–d Winter (DJF; left column) and summer (JJA; right col- umn) averages of SST, in °C, and geostrophic velocities. In a and b SST derives from OISSTV2 and geostrophic velocities from AVISO.
In c and d both fields are obtained from ROM. e, f Winter and sum-
mer means of 2-m air temperature, T2M, in °C, and 10-m wind speed from REMO (e, f) and ROM (g, h). Means are computed for the 1980–2012 time period
4454 W. Cabos et al.
traced from the western coast of North America towards Europe and the North of Africa. Negative biases with a magnitude not greater than 2 hPa are found over Central America, as well as over the Caribbean Sea and the western subtropical North Atlantic. Stronger negative biases spread over the mountain ranges along the Pacific coasts of the Americas. In summer, positive biases vanish and negative errors shift from the western towards the eastern subtropi- cal North Atlantic. The low-pressure cell is centered in the Canary Islands, where it attains − 3 hPa. Highly negative biases persist along the Pacific coast. MSLP biases become substantially different with ROM (Fig. 8e, f). The winter high-pressure cell becomes more intense and its center is displaced to the northwest of the Azores Islands, over the area where SST gradients are modified by the biases dis- played in Fig. 7e. To the south, ROM mitigates the negative biases of REMO over the western subtropical North Atlantic with a pattern that is seen to follow quite closely the cold SST biases (Fig. 8e vs. Fig. 7e). This mitigation also affects Central America, where the negative MSLP biases vanish.
In summer, ROM again corrects the REMO negative biases over Central and South America, and establishes positive MSLP biases over much of the western North Atlantic, with a nucleus center at the Gulf of Mexico and expanding once more over the colder-than-observed waters of the western subtropical North Atlantic (Fig. 8f vs. Fig. 7f). The negative biases over the eastern North Atlantic, off the NW coast of Africa, persist in ROM.
4 Discussion
4.1 What drives changes in the climate of the IP in the coupled run?
In this section, the mechanisms that may cause the tem- perature and precipitation response to air-sea coupling are examined. To that end, we analyse the impact of the inter- active SST on the atmospheric large-scale dynamics over the North Atlantic and on the Western Mediterranean Sea.
In winter, we primarily focus on the North Atlantic, which controls the climate of the IP to a large extent during this season (e.g. Gámiz-Fortis et al. 2011). In summer, the role of local-scale processes and the Western Mediterranean Sea in the IP climate become relevant as the influence of the North
Atlantic is significantly weakened (e.g. Ortiz Bevia et al.
2016). In ROM, the surface heat and momentum fluxes are also influenced by factors related to the oceanic component such as the general surface circulation or variations in the mixed-layer depth. As an illustration of the important role played by variations of the mixed-layer depth, we include in the Supplementary material (Sect. S.1) a discussion of the deep water formation in the Gulf of Lions for years 2005, 2006 and 2007. Note that, water transport at Gibraltar and the Dardanelles also exert an important control on the mass and heat balance of the Mediterranean Sea. The role of the water mass balance in the Mediterranean Sea is tackled in Sect. S.2 of the Supplementary material.
Our analysis is focused on the simulated climatology and the investigation of the variability on longer timescales is beyond the aims of this paper. However, we check to what measure the long-term variation influence the systematic character of the biases discussed here, in an analysis pre- sented in Sect. S.3 of the Supplementary material.
4.1.1 Temperature changes in response to air-sea coupling The climate of the IP is strongly influenced by the large-scale atmospheric North Atlantic oceanic and atmospheric circu- lation, which are in first-order controlled by the warm Gulf Stream and the North Atlantic Current (Minobe et al. 2008;
Keeley et al. 2012). In Fig. 9a, d we compare the geostrophic ocean currents and SST simulated by ROM with geostrophic ocean currents derived from AVISO and SST from OIS- STV2 in winter and summer. Even though in ROM the ocean has a significantly higher resolution than most global cou- pled models, it shows similar difficulties to accurately simu- late the trajectory of these two currents in winter. The Gulf Stream is wider and separates off the North American coast at lower latitudes than in AVISO (between 35° N and 40° N in AVISO and close to 30° N–35° N in ROM). This induces a displacement of the current path to the southeast. In addi- tion, the trajectory of the North Atlantic Current is not opti- mally reproduced from 50° N to the north, approximately, where observed currents display a rather complex structure.
First, the simulated current is stronger than in AVISO. Sec- ond, the so-called North-West Corner, which can be seen in AVISO near 50° N east of Newfoundland, does not appear in the simulated North Atlantic Current, which continues to flow towards the northeast. This is a common problem for ocean models when the model resolution does not allow us to resolve the associated eddies (see for instance Roberts et al. 2016). Third, the westward turn of this current close to 55° N is more pronounced than in AVISO. This feature ena- bles the development of a flow branch directed towards the SE which is not present in AVISO. The reported drawbacks in winter ocean circulation patterns are in line with previous works which have underlined the difficulties of ocean models
Fig. 9 Winter (DJF; left column) and summer (JJA; right column) averages of mean sea-level pressure (MSLP), in hPa, calculated for the 1980–2012 time period. Upper row (a, b): ERA-Interim MSLP;
Central row (c, d): MSLP biases of REMO with respect to ERA- Interim; Lower row (e, f): MSLP differences between ROM and REMO. Positive values in c and d point that REMO overpredicts MSLP. Positive values in e and f indicate that ROM reproduces greater values of MSLP than in REMO
◂
4456 W. Cabos et al.
to adequately simulate the winter path of the Gulf Stream and the North Atlantic Current (i.e. Eden and Greatbatch 2003; Bryan et al. 2007). We have detected similar defi- ciencies to those detailed above even in the ocean currents reproduced by the Climate Forecasting System Reanalysis (CFSR, Saha et al. 2010; not shown). Shortcomings in the simulated paths are consistent with the SST biases reported in Sect. 3.2 (Fig. 7): systematic warm biases arise along the path of the simulated currents, which are displaced to the southeast, whereas cold biases appear along the expected position of these currents. Also, the shifted position of the modeled North Atlantic Current near 45° N induces a cold SST bias that exceeds 5° C in the Northwestern Corner. This being a typical bias in state-of-the-art global climate models (Randall et al. 2007; Hewitt et al. 2017) is weaker and of a smaller spatial extension in ROM than in most GCMs, which usually have coarser oceanic and atmospheric meshes. The air warmed by the simulated North Atlantic Current, mainly through the latent heat flux, is transported towards the NW of the IP by the southward branch of the North Atlantic anti- cyclonic cell (Fig. 9e, g). Westerly winds reaching the NW of the IP then branch towards the south and the southeast (see also Fig. 10c, e). The warm imprint set by these two wind branches can be seen in the T2M, TMIN and TMAX (see Fig. 5a, c, e). In this season the Mediterranean Sea influ- ences air temperatures in a more local scale: ROM depicts a warmer SST in the regions adjacent to the Iberian Peninsula, especially near the Gulf of Valencia (with a maximum in the Balearic front) and the Alboran Sea, which induces localized positive heat anomalies (Fig. 10a). These spuriously warm SSTs have a concomitant impact on the T2M of the adjacent land areas (see Fig. 5a, c, e).
In summer, ROM reproduces more accurately the trajec- tory of the North Atlantic Current than in winter (compare Fig. 9b, d) and this is a feature shared by many coupled models (e.g. Keeley et al. 2012). The improved simulation of this current has a clear effect on the regional distribu- tion of the SST. Specifically, warm biases associated with the southeastward shift of these currents in the model are very small or close to zero (Fig. 7). However, as in win- ter, the relatively low resolution of our ocean model (in this region it is not eddy resolving) prevents the formation of the Northwestern Corner and the simulated SST presents a cold bias east of Newfoundland. The westward turn of the North Atlantic Current near 55° N is also slightly more pronounced that in AVISO, favoring the development of a southeastward flow that brings colder waters from higher latitudes to the North of the IP, leading to a cold bias there.
The reported distribution of SST errors has an impact on T2M, which is influenced both locally and remotely by the modeled SST biases. The colder SST in the North Atlantic leads to colder than observations air masses, which are trans- ported towards the IP by the prevailing large-scale winds
from the N and the NW (Fig. 9f, h; see also Fig. 10d, f).
The associated regional cooling over the SE and SW of the IP, respectively, can be observed in Fig. 5b, d, f. On a local scale, one also notes that Atlantic SSTs near the IP, close to 40° N, are colder than observations (Fig. 10b). This may be due to coastal upwelling triggered by strong northerly winds that blow parallel to the coast (Alvarez et al. 2008;
Bode et al. 2009). The localized drop in SST increases the thermal (pressure) gradient at the coast. This decrease in SST caused by the Iberian upwelling system may also have an impact on the T2M cooling observed to the SW of the IP in this season. Focusing on the Western Mediterranean Sea, SST from ROM features a cold bias that is generally larger than 1 °C (Fig. 10b). This, in combination with prevailing winds from the sea, due to differential land-sea warming, gives place to transport of Mediterranean air slightly colder than observations towards the interior of the IP and the cor- responding T2M drop which is particularly notable over the eastern and southeastern coasts of the IP (Fig. 5b, d, f ).
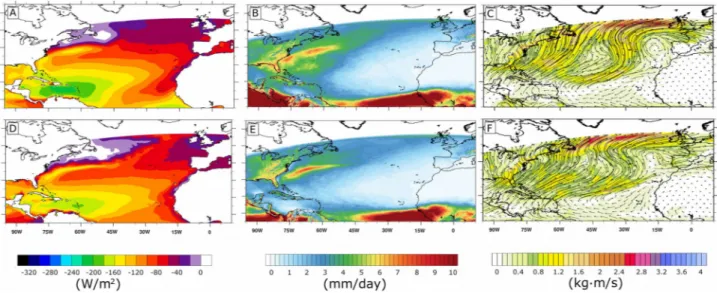
4.1.2 Precipitation changes in response to air-sea coupling Winter precipitation over the IP is largely governed by the Atlantic large-scale circulation (Rodó et al. 1997; Rodri- guez-Fonseca and de Castro 2002). In their systematic study of the impact of the Gulf Stream on the troposphere Min- obe et al. (2008 find that wind convergence on the eastern (warm) flank of the Gulf Stream enhances turbulent fluxes and this favours the development of a high-precipitation band there. In agreement with this, the winter latent heat flux attains a great magnitude along the eastern flank of the Gulf Stream and the North Atlantic Current for both REMO and ROM (Fig. 11a, d). Enhanced water vapour content asso- ciated with evaporation favours an increased precipitation along these currents (Fig. 11b, e). This air enriched in mois- ture is subsequently advected towards western Europe by the westerlies, increasing the horizontal transport of cloud water (Fig. 11c, f). Vapour-bearing air masses enter Iberia from the NW and flow towards the E and SE of the IP, driving precipitations which are enhanced by topographic effects, especially in the northern flank of the peninsula. As detailed above, in ROM, the southeastward shift of the simulated path of the North Atlantic Current gives place to on-route warm biases (see Figs. 7, 9). This causes a displacement of the band of enhanced latent heat losses to the southeast (Fig. 11a vs. Fig. 11d). Additionally, the spurious intensifi- cation of this current drives an enhanced zonal SST gradient which generates additional heat losses (Minobe et al. 2008).
Hence, the excessive evaporation over the North Atlantic in ROM leads to an increased horizontal cloud water transport over the northern and northwestern sectors of Iberia in com- parison to REMO (Fig. 11c vs. Fig. 11f). This may explain the overall increase in winter precipitation over the IP
observed in ROM, mostly due to the higher rainfall over the northernmost fringe of the IP and over its eastern half. To the west, though, drier conditions occur in ROM (Fig. 6e), likely associated with differences between the North Atlantic storm track in ROM and in REMO. The weaker storm track developed in the coupled run leads to a deficit in cyclonic
activity reaching the IP, which would explain the precipita- tion decrease over its western and southern portions (sup- plementary Fig. S1).
Different to winter, summer precipitation over the IP is less influenced by the Atlantic large-scale circulation due to the weakening and northward migration of the Atlantic Jet
Fig. 10 a, b SST differences between ROM and ERA-Interim, in °C, in the areas adjacent to the IP. Positive values indicate that the SST from ROM exceeds that from ERA-Interim. c, d Module (colours) and direction (arrows) of the wind speed. Winter (DJF; left column)
and summer (JJA; right column) means are depicted on the left and right columns, respectively, and computed for the 1980–2012 time period
4458 W. Cabos et al.
Stream, and is mostly driven by local-scale processes, the dominant moisture sources now being the IP itself and the Mediterranean (Gimeno et al. 2010). Only in the northern and western rim of the IP rainfall is associated with large- scale atmospheric circulation of the North Atlantic (see Fig.
S2 in the Supplementary Material, where the % of large- scale, relative to the total precipitation, is shown). This fig- ure illustrates that summer precipitation is associated with large-scale circulation processes in the northern flank of the IP, while it is mainly convective elsewhere in the peninsula.
Therefore, the mechanisms that induce summer precipitation differ regionally. Putting the focus on the North Atlantic, we observe that summer heating reduces SST gradients associ- ated with the Gulf Stream and the North Atlantic Current
(Fig. 7b). Consequently, latent heat losses become less strong than in winter (Fig. 12a, d), thus reducing enhanced rainfall along these currents (Fig. 12b, e). The high-precip- itation band associated with these current systems extends over a smaller surface area and concentrates mostly from the Caribbean Sea towards the offshore, coinciding with areas of enhanced latent heat losses. The overall decrease in sum- mer evaporation along these currents lowers air moisture and thus horizontal cloud water transport towards the IP relative to wintertime in both REMO and ROM (Fig. 12c, f). Whereas cloud water transport in both simulations does not differ significantly in magnitude, it becomes more zonal near the western flank of the IP with ROM and this increases rainfall relative to REMO. Over the Mediterranean coast
Fig. 11 Winter averages (DJF) of latent heat flux, in W/m2 (a, d), precipitation, in mm/day (b, e) and horizontal transport of cloud water (c, f) for REMO (upper row) and ROM (lower row), averaged over the 1980–2012 period
Fig. 12 As in Fig. 11, but means are computed for summer (JJA)
of the IP, precipitation slightly diminishes in the coupled ROM run in response to a lower than observations SST in the Western Mediterranean, which reduces the moisture con- tent (Fig. 10b).
4.2 Role of the driving fields
Up to now we have analyzed the changes that coupling causes in the simulated climate of the IP using “ideal”
boundary conditions from the ERA-Interim reanalysis.
However, one of the important applications of regional climate models is downscaling the climate signal of the global coupled models. As the climate simulated by GCMs has its inherent biases, it is of interest to explore the impact that these biases have on the previous results. Therefore, in this section we assess the role of the boundary conditions on T2M and precipitation when the regional models are forced with data from the global climate model MPI-ESM
(Giorgetta et al. 2013). In winter, the T2M biases over the IP in REMO have a similar structure to that found in the simulation forced by ERA-Interim reanalysis (see Figs. 2c, 13a). Again, T2M is overpredicted in the Ebro River basin and biases are negative or close to neutral elsewhere over the IP. In the southwestern area, cold biases appear to be slightly more pronounced in the MPI-ESM experiment. It is in summer when we find substantial differences (com- pare Fig. 2d to Fig. 13b). While with ERA-Interim positive errors were strongest near coastal areas, especially in the eastern, southern and southwestern flanks of the IP, now these become nearly zero along the Mediterranean coast.
Interestingly enough, positive biases are now smaller in the near-shore region, but negative errors become spatially more extensive and increase their magnitude. Summer T2M is generally up to 2 °C lower than in E-OBS, with maximum differences close to 4 °C in the Meseta.
Fig. 13 Winter (DJF; left column) and summer (JJA; right column) averages of daily 2-meter air temperature (T2M), in °C, computed from the simulations forced by variables from MPI-ESM and for the 1976–2005 time period. a, b T2M biases of REMO relative to E-OBS
(positive values correspond to warm biases and negative values the opposite). c, d T2M differences between ROM and REMO. Positive values indicate that T2M is greater in ROM than in REMO
4460 W. Cabos et al.
Under the MPI-ESM forcing the impact of air-sea cou- pling on the simulated T2M is of opposite sign for the winter and summer seasons (Fig. 13c, d). In this case, coupling reduces T2M in winter and tends to increase it (with the exception of coastal areas) in summer. To understand these differences, we turn to the study of the North Atlantic cir- culation and SST distribution in ROM (Fig. 14). The winter Gulf Stream becomes now more zonal than under the ERA- Interim forcing, and crosses the entire Atlantic Ocean flow- ing close to 40°N. This error can also be found in the driving GCM (Jungclaus et al. 2013) and could reflect the biases in the large-scale circulation of the driving model (compare Fig. 14a, c). As in the simulation forced by ERA-Interim, the Gulf Stream presents two distinct flow branches and is wider than in AVISO. Whilst in the previous case the southern branch was strongest, here the northern is the most intense.
However, both the Gulf Stream and the North Atlantic Cur- rent experience a generalized velocity decrease relative to the simulation forced by ERA-Interim and also compared to MPI-ESM. As a result of this weakening, the heat transport is reduced and cold biases cover a larger surface than in MPI-ESM south of 50° N (Fig. 14e, g). As expected, the model fails to reproduce the Northwestern Corner, as this feature of the circulation is strongly dependent on resolution.
The Subpolar Gyre extends too far eastward and occupies a greater surface area relative to AVISO. The currents that border the Gyre are too intense, contributing to the cold biases in its southern fringe. As seen in Sect. 4.1, SST has a clear impact on the T2M and this ultimately has an impact on the IP climate via heat advection with the atmospheric flow along the northern branch of the Atlantic anticyclonic cell. In this case, the absence of positive biases in the North Atlantic, together with an increased surface area of those regions where negative biases arise induce a deficient heat transport towards the IP that gives place to a T2M decrease in response to air-sea coupling.
The summer large-scale ocean circulation simulated by ROM and MPI-ESM in the North Atlantic, resembles the one found for the winter season (Fig. 14b, d). The associ- ated SST biases are likewise similar, with colder conditions over most of the North Atlantic (Fig. 14f, h). Although the oceanic influence is weaker in summer, in ROM, cold SST biases can also be found close to the IP in the Gulf of Biscay and in the western Mediterranean Sea, where they reach val- ues below − 2 °C. ROM sea surface is also somewhat colder than MPI-ESM in the western coast of the IP, suggesting
that upwelling also plays a role. Despite these colder sur- roundings, the main change introduced by ROM in the T2M summer biases consists of a warming (reducing the REMO negative bias) in the south of the Meseta. Additional fac- tors seem to be offsetting the entrance of colder air. One possibility lies in the lower water vapour availability, as a consequence of the now cooler water bodies around the IP, leading to reduced cloudiness and to increased insolation levels reaching the ground.
Putting the focus on precipitation we observe that, in winter, rainfall from the atmospheric simulation driven by MPI-ESM shows very good qualitative and quantitative agreement with the equivalent run forced with ERA-Interim (Fig. 15a). Precipitation is overestimated over the northern and northwestern coast of the IP, while a dry bias persists in the Pyrenees and the Guadalquivir river basin. Relative to the ERA-Interim run, the wet biases appear to be higher in the western IP and slightly lower along the northern coast.
This pattern seems consistent with a comparatively strong westerly flow entering the IP across the western coast in the MPI-ESM experiment, and then crossing the Cantabrian area with a southerly component absent in the ERA-Interim run (Fig. 16c vs. Fig. 11c). In summer, precipitation is small and so are the differences relative to E-OBS (Fig. 15b).
Focusing on precipitation changes due to coupling we note that, in winter, rainfall experiences a generalised decrease all over Iberia with the exception of the northern portion of the IP (Fig. 15c). The greatest decrease in precipitation occurs in the northwestern coast of Iberia, where rainfall lowers nearly 1 mm/day relative to REMO. The increase in precipitation in the northern flank of the IP reaches about 0.5 mm/day, which is slightly smaller than in the summer simulation forced with ERA-Interim reanalysis. In summer, rainfall experiences a generalised reduction which is particularly remarkable in the northeastern sector of Iberia (Fig. 15d). In this season, air-sea coupling induces a greater decrease in precipitation than in the equivalent run forced with ERA-Interim.
To understand the possible causes of the precipitation changes induced by air-sea coupling, we turn to the study of the North Atlantic Ocean and its circulation. In this respect, in winter, cold biases in ROM reduce latent heat losses along and N the simulated Gulf Streamorth Atlantic Current (Fig. 16a, d). The decreased evaporation in ROM reduces water vapor content and thus precipitation on the North Atlantic (Fig. 16b, e). This culminates in an overall decrease in the horizontal cloud water transport towards the IP, with the exception of the northern flank, where precipi- tation increases in response to air-sea coupling (Fig. 16c, f). The increased rainfall along the northern rim of Iberia is related to a more zonal trajectory of the horizontal water cloud transport in ROM, whereas the winds in the uncoupled simulation flow with a southerly component over the north- ern Spanish shore, as noted above. In summer (Fig. 17),
Fig. 14 a–d Winter (DJF; left column) and summer (JJA; right col- umn) averages of SST, in °C, and geostrophic velocities for the 1976–2005 period. a, b SST derives from OISSTV2 and geostrophic velocities from MPI-ESM. In c, d both fields are obtained from ROM forced by MPI-ESM. e–h Winter (DJF; left column) and summer (JJA; right column) SST biases relative to OISSTV2, in °C. e, f MPI- ESM biases; g, h: ROM forced by MPI-ESM biases
◂
4462 W. Cabos et al.
when the Atlantic large-scale circulation plays a secondary role and nearby moisture sources became more relevant, the lowered precipitation in ROM may be the result of the decreased SSTs, relative to the REMO run, in the surround- ing waters, this diminishing humidity and therefore convec- tive rainfall, especially to the east of the peninsula. As previ- ously noted, this might be consistent with the T2M biases of ROM in summer, with more scarce cloudiness enhancing insolation at the ground.
5 Conclusions
Regional models used for downscaling the European climate usually exclude most of the Atlantic Ocean from the model domain. Besides, they are uncoupled and the SST is taken as lower boundary conditions from global coupled models or reanalysis having much coarser resolution than the mesh of the regional atmospheric model. In these conditions it is
reasonable to question to what extent the oceanic influence of small scale features of the oceanic circulation and of the role of air-sea coupling are taken into account in such exper- iments. The climate of the IP features a marked regional and seasonal variability which is the result of the interaction of different air masses with a complicated topography and is strongly influenced by the surrounding water masses. This makes the IP an ideal test case for understanding the impact of including explicitly the North Atlantic in the regional domain and the added value that coupling brings to regional climate modeling of the European climate. In this work we use the regionally-coupled model ROM and its atmospheric component REMO to investigate the effect of air-sea cou- pling in the North Atlantic and Mediterranean sea on the present-day climate of the IP using as boundary conditions data from the ERA-Interim reanalysis. A special effort is done to link the differences induced by the coupling to their driving mechanisms. Additionally, the impact of the use of different boundary conditions on the representation of the IP
Fig. 15 Winter (DJF; left column) and summer (JJA; right column) means of precipitation, in mm/day, computed for 1976–2005 period.
a, b Precipitation biases of REMO relative to E-OBS. c, d Differ-
ences in precipitation between ROM and REMO. Positive values in a and b indicate that REMO overpredicts precipitation. Positive values in c and d highlight that rainfall in ROM is higher than in REMO
climate is assessed through the prescription of forcing from the global climate model MPI-ESM. The most relevant find- ings from this work can be summarized as follows:
• REMO and ROM reproduce well the seasonal variability of the IP climate relative to state-of-the-art regional cli- mate models. Both models capture well the topographic effect on 2-m air temperature (T2M) and precipitation.
• In the runs forced by ERA-Interim, air-sea coupling has a different imprint on T2M depending on the season.
In winter, T2M rises in response to coupling while, in summer, the coupling causes a generalized T2M lower- ing. This differential response could be attributed to a higher sensitivity of the IP climate to the North Atlan- tic large-scale dynamics in winter relative to summer.
Fig. 16 Winter means (DJF) of latent heat flux, in W/m2 (a, d), precipitation, in mm/day (b, e) and horizontal transport of cloud water (c, f) for the REMO (upper row) and ROM (lower row) runs forced with MPI-ESM, averaged over the 1976–2005 period
Fig. 17 As for Fig. 16, but means are calculated for summer (JJA)