doi:10.1351/pac200779101653
© 2007 IUPAC
Enthalpies of formation and lattice parameters of B2 phases in Al–Ni–X systems*
Rongxiang Hu, Hsin-Ning Su, and Philip Nash
‡Thermal Processing Technology Center, Illinois Institute of Technology (IIT), 10 West 32ndStreet, Chicago, IL 60616, USA
Abstract: Enthalpies of formation of Al–Ni–X (X: Fe, Ru, Pd, Pt, and Cu) alloys were meas- ured by high-temperature calorimeter and compared with the calculated value from Miedema’s model and interpolation models. The interpolation models generally provide bet- ter prediction than Miedama’s model. No one interpolation model generated superior predic- tions. Lattice parameters of B2 phase compounds were determined by X-ray diffraction (XRD). The atomic volumes in the Al–Ni–Fe system were calculated and show that Fe sub- stitutes preferentially on the Al sublattice. The heat content of Al0.5Ni0.2Ru0.3 and Al0.5Ni0.35Cu0.15 at high temperature was obtained, and the results are in good agreement with those heat capacities estimated by the Neumann–Kopp rule.
Keywords: Al–Ni–X alloys; Miedema’s model; Neumann–Kopp rule; enthalpies of forma- tion; B2 phase compounds; Al–Ni–Fe.
INTRODUCTION
The Al–Ni–X systems (where X is a third element) are of importance not only because of the Al- and Ni-base alloys, but also because they contain ternary compounds with interesting properties. One of the more interesting compounds that frequently appears in these systems is the B2, CsCl type. There are a large number of binary and ternary intermetallic compounds with the B2, CsCl structure [1], many of which exist over substantial composition ranges [1,2]. The B2 structure has a primitive cubic Bravais lattice with two atoms per unit cell. In the binary compounds, the unit cell contains one atom of each type and so we can consider the lattice to consist of two interpenetrating simple cubic lattices, αand β, each of which contains atoms of only one type under conditions of perfect order at 0 K. A subset of the B2 compounds, the aluminides, where one of the major components is Al and the other is generally a transition-metal (TM) element, are of interest for use in high-temperature structural applications be- cause of their low densities, high melting points, and oxidation resistance [3–5]. Despite these useful properties, the aluminides still present considerable challenges for such applications, in particular, they exhibit poor room-temperature ductility and creep resistance [6,7]. Alloying can be used to modify these properties, and consequently a knowledge of the phase equilibria and thermodynamics of ternary and higher-order systems containing B2 phases is needed [8,9]. Over the last 25 years, there have been many papers dealing with different aspects of binary and ternary B2 compounds. These include phase equilibria [10], thermodynamics [11–13], defect structures [14–16], and mechanical properties [3,17].
Investigations have been both experimental [18,19] and theoretical with a number of first-principles cal-
*Paper based on a presentation at the 12th International IUPAC Conference on High Temperature Materials Chemistry (HTMC-XII), 18–22 September 2006, Vienna, Austria. Other presentations are published in this issue, pp. 1635–1778.
‡Corresponding author
culations being performed for this structure [20–22]. The present work is part of a systematic investi- gation of the thermodynamics and phase equilibria of Al–Ni–X ternary systems with the third element generally either a TM or rare earth. The work is aimed at populating databases for computational thermodynamics, developing an understanding of alloying, and clarifying phase equilibria. In this paper, we mainly address some issues concerning the B2 phases in these systems.
EXPERIMENTAL Enthalpies of formation
The experimental procedure has been described in detail previously [18]. Briefly, it involves two ex- periments, the first measures the heat of reaction on dropping a sample of unalloyed elemental powders which react in the calorimeter and the second the heat content of the reacted sample. The samples are dropped from room temperature (298 K), the difference between the two gives the heat of formation at 298 K. Thus, the standard enthalpy of formation, ∆Hf298 Kis
∆Hf298 K= ∆Hreaction– ∆Hheat content
A precise knowledge of the temperature of the calorimeter is, in principal, not necessary except in the sense that it must be the same for both experiments. The main experimental issues with this tech- nique are that the sample should react completely in the calorimeter and that on cooling to room tem- perature, no phase separation should occur, that is, it is single phase at room temperature. Note also that the actual state of the sample at the calorimeter temperature is not important only that it is the same for both experiments. The presence of a liquid phase at the calorimeter temperature is not a problem unless it leads to phase separation, or inhomogeneity in the sample. For example, compounds forming by a peritectic reaction with a melting point below the calorimeter temperature cannot be measured.
Lattice parameters
Lattice parameters of Al–Ni–X B2 compounds are an indirect measure of the bond strength and con- stitutional defect structure, and can be used to determine the atomic volume of each constituent element.
X-ray diffraction (XRD) was performed in a ThermoARL diffractometer using Cu Kαradiation.
Scans were taken over a 2θrange of 5 to 120°. The “1976 XRD Flat-Plate Intensity Standard” alumina purchased from NIST (National Institute of Standards and Technology) is used as the standard refer- ence material for calibration to obtain precise peak positions and accurate lattice parameters.
Once the calibration curve is obtained, the peak position obtained from subsequent experiment has to be corrected by the equation of the calibrated curve. Several index planes in an XRD pattern were used to determine the lattice parameter by an extrapolation function [23].
B2 Compounds
One of the interesting aspects of the B2 structure is the existence of constitutional crystal defects when the composition deviates from the stoichiometric composition. In the fully ordered stoichiometric com- pound, one type of atom occupies the α-sublattice and the other type of atom the β-sublattice. This oc- curs only at 0 K, but at finite temperatures thermal defects are present in increasing number as the tem- perature is increased. We will ignore for the most part the presence of such thermal defects since our discussion will focus on room-temperature and sufficiently large deviations from stoichiometry that thermal defects constitute a small fraction of the total. When there are no longer equal numbers of the two atoms the structure must introduce some type of atomic defect to maintain the crystal structure.
While several types of defect are possible, experience has shown that the most common defects are TM antistructure atoms on the Al-sublattice for composition deviations to the TM side and vacancies on the
R. HU et al.
1654
TM sublattice when there is an Al excess. When adding the third element X to NiAl, the site preference of the third element can be predicted from the enthalpies of formation of NiX and AlX [39], as shown in Table 1. At stoichiometry, it is possible to have TM antistructure atoms on the Al sublattice with two vacancies on the TM sublattice to maintain the equality of lattice sites, so-called triple defects [24].
Table 1 The calculated K value and the preference of X in Al–Ni–X B2 systems.
Dilute ∆HCAlf ∆HfNiC K Relative site Absolute site
addition (kJ/mol) (kJ/mol) (kJ/mol) preference preference of
C compared infinitesimal
to Ni addition at 298 K
Sc –41.1 ± 1.5 [27] –44.7 ± 2.3 [35] 73.1 β
Ti –38 [28] –33.1 ± 1.1 [36] 64.6 β
Mn –21.55 ± 1.05 [29] –14.21 [28] 62.16 β
(898 K) (1050 K)
Fe –26.5 ± 1.1 [18] –3.86 [28] 46.86 β
(1200 K)
Co –53.4 ± 1.4 [27] 0 [28] 16.1 β
1400 K
Ni –62 ± 2 [30] 0 7.5
Cu –20.04 [29] 1.8 [28] 47.66 β
973 K
Y –88 [31] –37 [37] 18.5 β
Ru –62.05 ± 1.6 [32] +1 [34] 6.45 β
cal.
Ru –54.5 ± 1.2 [19] +1 [34] 14 β
cal.
Rh –106.3 ± 1.6 [32] +1.1 [38] –37.9 α α
1100 K
Pd –91.25 ± 4.7 [33] –0.5 [28] –21.25 α α
1273 K
Re –30 [34] +3 [34] 36.5 β
cal.
Os –38.6 ± 0.9 [32] +2 [34] 28.9 β
cal.
Ir –92.8 ± 1.8 [32] –2 [34] –21.3 α α
cal.
Pt –97.55 ± 5 [33] –9.3 [28] –18.75 α α
K =∆HfCB–∆HfAB–∆HfAC–∆HNibcc→fcc= ∆HfCAl–∆HfAlNi–∆HfNiC–∆HNibcc→fcc
∆HNibcc→fcc= 7.99 kJ/mol.
Relative site preference: K > 0 →C has a stronger preference for β-sublattice (Al); K < 0 →C has a stronger preference for α-sublattice (Ni).
Absolute site preference: K < 0 →C has a stronger preference for α-sublattice.
The enthalpy of formation of a B2 compound reflects the total bond strength resulting from the formation of unlike atom bonds, and in the case of non-stoichiometric alloys will also include some other bonds such as like atom bonds or vacancy-atom bonds. Thus, if we measure the enthalpy of for- mation as a function of composition we expect it to vary in accordance with the changes in numbers of bonds of each type. The experimental error involved in determination of enthalpies of formation means that sensitivity is limited and therefore significant compositional variations are needed to obtain useful information on the constitutional defect structure. One example of such measurements is for the com- positional variation of the enthalpy of formation of NiAl [12]. The enthalpy of formation is a maximum
at the stoichiometric composition and decreases at different rates on the Al- and Ni-rich sides. This is a consequence of the different constitutional defect structures, with antistructure atoms on the Ni-rich side replacing Al–Ni bonds with weaker Ni–Ni bonds and weaker Al-vacancy bonds on the Al-rich side.
Since the Al atom is significantly larger than Ni, there is a compositional variation of the lattice pa- rameter, which also depends on the types of defect formed [6]. Furthermore, there is a significant effect on hardness due to the strain effects resulting from the different defects [25,26].
At the stoichiometric composition, the effect of adding a third element to AlNi would be to change the enthalpy of formation toward the value for the aluminide of the added element. Deviation from a linear relationship would indicate a second near-neighbor effect between the third element and Ni. This effect will most likely be small if the third element is a TM. There may also be a change in the number of thermal defects if the third element has a site preference, but we are assuming small con- centrations at 298 K for the purpose of this discussion. However, as one moves away from stoichiome- try to Al-deficient compositions the interaction between the third element and Ni becomes important in determining site preference, and this determines the number and types of bonds formed. The effect be- comes more pronounced as the Al content decreases because the probability for forming nearest-neigh- bor Ni–Ni bonds or Ni–X bonds increases as the Ni and/or third element must make up the deficiency on the Al sublattice.
A number of models have been developed for the description of the thermodynamic properties of B2 phases usually using a Bragg–Williams (B–W) or Wagner–Schottky (W–S) formalism [13,18,39].
These models are useful for making predictions of defect concentrations and for providing the thermo- dynamic description of the phase for computational thermodynamics databases. An excellent review on this topic was written by Chang and Neumann [40]. Since then, additional experimental data have be- come available, in particular, enthalpy of formation, lattice parameter, and defect concentrations [18,19,26].
RESULTS AND DISCUSSION Al–Ni–Fe
Experimental enthalpies of formation were compared to Miedema’s semiempirical model [41] and the interpolation methods of Toop, Kohler, Colinet, Muggianu, and Hillert [42].
Using the extended Miedema model [41], the standard enthalpy of formation of a ternary com- pound, ∆Hf298 K, can be calculated from
CAand CBare the molar ratios of A and B elements, respectively, in the corresponding compounds, fABis the degree of surface contact of an A atom with B neighbors while fACis the degree of surface contact of an A atom with C neighbors. ∆Hinteris interfacial enthalpy.
Hillert [42] has classified the empirical models for the prediction of enthalpies of formation in ternary systems into two categories depending on the method of choosing the binary composition:
• symmetric model: Kohler [43], Colinet [44], and Muggianu [45]
• asymmetric model: Toop [46] and Hillert [42]
They are shown in Fig. 1.
R. HU et al.
1656
∆Hf298K =C fA BA∆H(AinB)inter +C fA CA∆H(AinC)intter +C fB CB∆H(BinC)inter
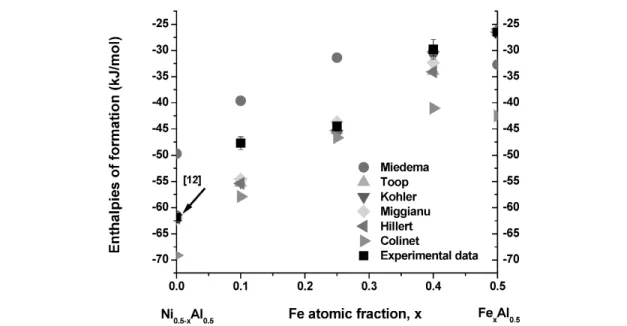
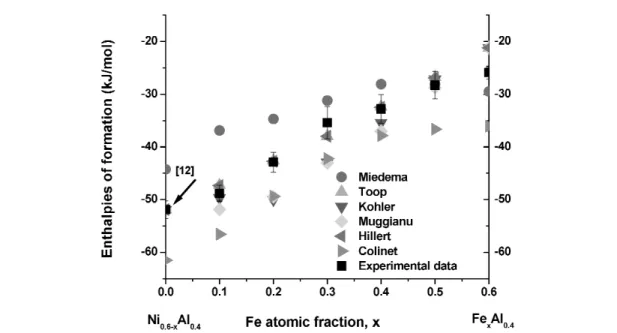
Figures 2–4 show the comparison of experimental enthalpies of formation at 298 K with empiri- cal interpolations and Miedema’s model in the Al–Ni–Fe system. fAB, fAC, fCB, ∆HinterAinB, ∆HinterAinC, and
∆HinterBinCvalues for Miedama’s model are from [41]. The enthalpies of formation of binary compounds for the interpolation models are from [34] with some additions, Table 2. It is apparent that enthalpies calculated from Miedema’s model are less exothermic than those measured from direct synthesis calorimetry, but both show the same tendency of enthalpy change with composition. The interpolation models provide very reasonable approximations to the experimental values in most cases.
Fig. 1 Interpolation models for predicting ternary enthalpies of formation.
Fig. 2 Comparison of experimental enthalpies of formation at 298 K with empirical interpolations and Miedema’s model for Al0.5Ni0.5–xFex.
R. HU et al.
1658
Fig. 3 Comparison of experimental enthalpies of formation at 298 K with empirical interpolations and Miedema’s model for Al0.4Ni0.6–xFex.
Fig. 4 Comparison of experimental enthalpies of formation at 298 K with empirical interpolations and Miedema’s model for Al0.33Ni0.67–xFex.
Table 2∆HAl–Xand ∆HNi–Xat 298 K [34] (kJ/mol).
Ni Co Pd Pt Fe Ru
Al9X2 –30
Al4X –57
Al13X4 –32
Al3X –38 –38 –51* –28
Al5X2 –41 –25
Al2X –26
Al3X2 –57 –84* –96.5
[47]
Al–X AlX –62 –53.4 –91.25 –97.6 –26.5 –54.5
[30] [27] [33] [33] [18] [19]
Al2X3 –86
Al3X5 –89
AlX2 –87.3
[48]
AlX3 –41 –63.6
[47]
Ni–X Ni0.5X0.5 0 0 –0.5 (1273 K) –9.3 –4 [49] +1
*373 K.
Figure 5 shows a Gibbs triangle with experimentally determined enthalpies of formation of the B2 phase [18] superimposed with the B2 phase boundaries at 1400 K [50]. Although the calorimeter samples were slowly cooled to room temperature from the calorimeter temperature, they show that the B2 phase field in Al–Ni–Fe is more extensive than predicted by the thermodynamic model of [50].
Measurements of the composition dependence of the lattice parameter of the B2 phase have also been made [51]. Figure 6 shows the composition dependence of the lattice parameter of the B2 phase in Al–Ni–Fe for constant Al content of 0.4 [51]. It is clear there is a change of slope that occurs at 0.1 Fe for the Al0.4Ni0.6–xFex. Similar results have been obtained by Pike et al. [26]. The results clearly indi- cate that the larger Fe atom preferentially occupies the antistructure sites on the Al sublattice, and only when these are filled do the Fe atoms begin to occupy the TM sublattice. An analysis of these data [51]
produced the following atomic volumes in the Al0.40Ni(0.60–x)Fexsection:
VAl/Al= 0.0134 nm3 VNi/Al= 0.0107 nm3 VNi/Ni= 0.0106 nm3 VFe/Al= 0.0131 nm3 VFe/Ni= 0.0112 nm3
Similar values are obtained for constant 0.33 mole fraction Al.
The atomic volumes of the atoms indicates that the constitutional defect site preference of Fe for the Al sublattice is due to the closer match of the Fe atomic volume with that of the Al coupled with the lower bond strength of Al–Fe. Hardness measurements of [26] also indicate such a site preference, and the softening observed on adding Fe results from the smaller lattice strain than for Ni.
The composition dependence of ∆Hfof the B2 phase in the Al–Ni–Fe system using the W–S model is
∆Hf= ∆H*(1 + x20) + ∆H12x12+ ∆H13x13+ ∆H20x20+ ∆H21x21+ ∆H23x23
∆H*= x∆HfNiAl+ (1 – x) ∆HfNiAl
The definitions of the parameters in the above equations are given in Table 3. Table 4 shows the enthalpy coefficients in the W–S model.
R. HU et al.
1660
Fig. 5 Enthalpies of formation of B2 compounds in the Al–Ni–Fe system [18] and B2 phase boundary at 1400 K [50].
Fig. 6 Lattice parameter of Al0.4Ni0.6–xFex.
Table 3 Definitions of the parameters in the W–S model of the B2 phase.
Parameter Definition
∆Hf Enthalpy of formation of B2 phase in Al–Ni–Fe
∆H* Enthalpy of formation of 1 mole of the ideally stoichiometric B2 phase
∆H12 Enthalpy of formation of 1 mole of Ni antistructure atoms in the β-sublattice
∆H13 Enthalpy of formation of 1 mole of Fe antistructure atoms in the β-sublattice
∆H20 Enhthalpy of formation of 1 mole of vacancies in the α-sublattice
∆H21 Enthalpy of formation of 1 mole of Al antistructure atoms in the α-sublattice
∆H23 Enthalpy of formation of 1 mole of Fe in the α-sublattice x12 Concentration of Ni antistructure atoms in the β-sublattice x13 Concentration of Fe antistructure atoms in the β-sublattice x20 Concentration of vacancies in the αsublattice
x21 Concentration of Al antistructure atoms in the α-sublattice x23 Concentration of Fe antistructure atoms in the α-sublattice
∆HfAlNi Enthalpy of formation of 1 mole of the ideally stoichiometric AlNi
∆HfAlFe Enthalpy of formation of 1 mole of the ideally stoichiometric AlFe
Table 4 Enthalpy coefficients in the W–S model of the B2 phase in Al–Ni–Fe.
Enthalpy coefficients kJ/mol
∆H12 97.5 (AlNi) [12]
∆H13 70.3 (AlFe) [54]
∆H23 –15.8 (Al0.33Ni(0.67–x)Fex) [18]
∆H23 0 (Al0.50Ni(0.50–x)Fex) [18]
∆H23 ~0 (Al0.40Ni(0.60–x)Fex) [18]
The data, Figs. 2–4, show that ∆H23is small (0–2 kJ/mol) for the 0.5 and 0.4 Al sections but for the 0.33 section ∆H23= –15.8 kJ/mol consistent with a small negative heat of mixing of Fe and Ni [18].
As discussed previously, the Ni–X bond strength will be more influential on the enthalpies of forma- tion the smaller is the Al concentration since the probability of such bonds increases with decreasing Al content.
Al–Ni–Ru
Some controversy exists regarding the existence of a miscibility gap in this system in the extensive B2 phase field extending from NiAl to RuAl [52,53]. If there is a miscibility gap then the critical temper- ature is likely relatively low, resulting in a kinetic constraint on the phase separation, making experi- mental verification quite difficult. Calorimetric data on enthalpies of formation at 298 K indicate un- usual behavior, Fig. 7, where there is a decrease in the enthalpy of formation of the B2 compound around 0.1 mole fraction of Ru, indicating a reduction in stability which will likely result in a misci- bility gap, very different from the values predicted by Hillert interpolation model. The effect diminishes on reducing the Al concentration below stoichiometry [19]. This results in negative curvatures for the enthalpy–composition relation characteristic of systems exhibiting miscibility gaps. Since at equilib- rium it appears probable that there is a miscibility gap, then some of the experimental data on enthalpy of formation of the B2 phase obtained in our work represents the metastable enthalpy curve, XRD on the samples shows only one B2 phase [19]. At 298 K, we should have phase separation but this did not occur because the transformation is kinetically constrained.
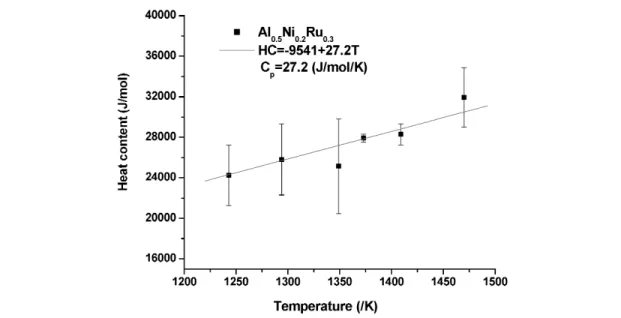
Heat content and capacity
The heat content of Al0.5Ni0.2Ru0.3between room temperature and high temperatures (from 1243 to 1470 K) was measured, and its heat capacity was calculated over this temperature range by fitting the heat content linearly, Fig. 8. The calculated value of Cp= 27.2 J/mol/K, which is close to the value of 32.4 J/mol/K estimated using the Neumann–Kopp rule and slightly lower than the value for Ni0.5Al0.5, which is about 30.5 J/mol/K. This is reasonable since the heat capacity of Ru is smaller than Ni in this temperature range.
R. HU et al.
1662
Fig. 7 Enthalpies of formation of Al0.50Ni0.50–xRux[19].
Fig. 8 Heat content and heat capacity of Al0.5Ni0.2Ru0.3at high temperature.
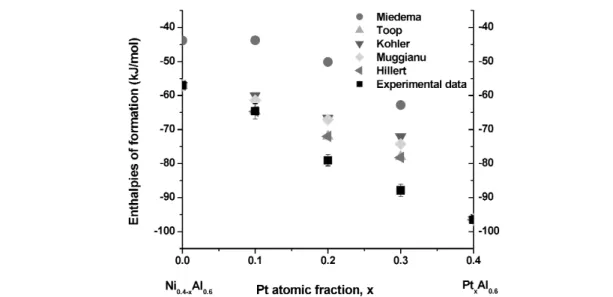
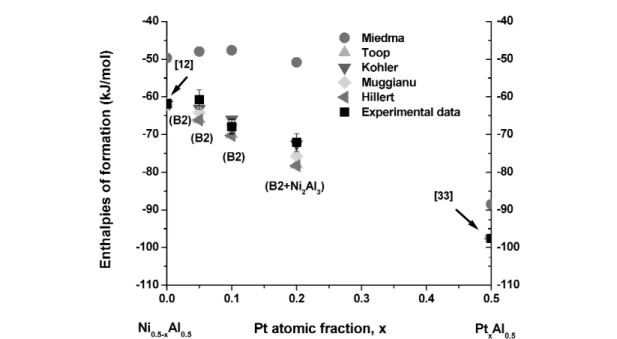
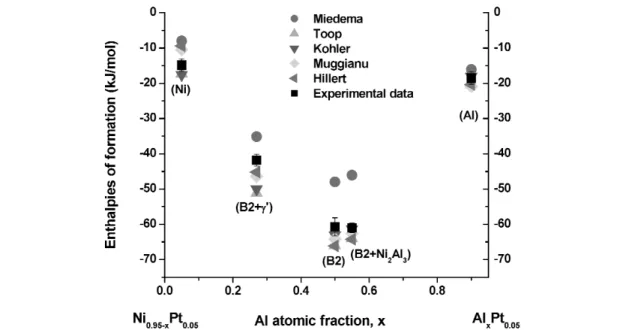
Al–Ni–Pt
The enthalpies of formation of the Al–Ni–Pt phases, B2, L12, Al3Ni2, (Al) and (Ni, Pt) are shown in Fig. 9, superimposed with the B2 phase boundaries at 1333K [55]. With constant Al, when replacing Ni with Pt, the enthalpy of formation of Al–Ni–Pt increases because of the stronger Al–Pt bonding en- ergy. The experimental data are compared with the calculated data from Miedema’s model and the inter- polation models, Figs. 10–13. The linear enthalpy change with composition from Ni0.5Al0.5 to Pt0.5Al0.5indicates the small interaction energy between Ni and Pt, which is in accordance with the en- thalpy of formation from [34]. The Miedema predictions are consistently less exothermic than the ex- perimental data, while the interpolation models provide good estimates.
Fig. 9 Enthalpies of formation of Al–Ni–Pt compounds [this work] and B2 phase boundary at 1333 K [55], the binary data points are from [12,33,34,47].
Fig. 10 Comparison of experimental enthalpies of formation at 298 K with empirical interpolations and Miedema’s model for Al0.6Ni0.4–xPtx.
R. HU et al.
1664
Fig. 11 Comparison of experimental enthalpies of formation at 298 K with empirical interpolations and Miedema’s model for Al0.5Ni0.5–xPtx.
Fig. 12 Comparison of experimental enthalpies of formation at 298 K with empirical interpolations and Miedema’s model for Ni0.9–xAlxPt0.1.
XRD was used to determine the crystal structure and phases of each sample, and the results are shown in Table 5. The composition Al0.5Ni0.3Pt0.2 shows diffraction peaks from B2 with a small amount of a second phase in agreement with the phase equilibria [55].
Table 5 Phases and lattice parameters of Al–Ni–Pt alloys.
Composition Reaction enthalpy, Heat content, Enthalpy of Phase Lattice parameter
∆H1(kJ/mol) ∆H2(kJ/mol) formation of B2 phase (nm)
∆Hf(kJ/mol)
Al0.5Ni0.5 –61.8 ± 1.11 B2 0.2887
[12]
Al0.5Ni0.45Pt0.05 –31.04 ± 2.0 29.71 ± 1.33 –60.75 ± 2.59 B2 0.2903 Al0.5Ni0.4Pt0.1 –36.04 ± 1.33 31.87 ± 1.05 –67.91 ± 1.93 B2 0.2924 Al0.5Ni0.3Pt0.2 –40.62 ± 2.07 31.47 ± 0.71 –72.09 ± 2.38 B2 + ? 0.2963 Al0.45Ni0.45Pt0.1 –29.39 ± 1.79 30.88 ± 1.26 –60.27 ± 2.38 B2 0.2915 Al0.45Ni0.4Pt0.15 –31.8 ± 0.95 29.84 ± 1.22 –61.64 ± 1.79 B2 0.2939
Al0.5Pt0.5 –97.6 ± 5.0 B2 0.3212
[33] (1545–1613 K)
[56]
Al0.4Ni0.6 –51.9 ± 1.7 B2 0.2865
[12] [6]
Al0.55Ni0.4Pt0.05 –29.6 ± 0.51 31.39 ± 0.81 –60.99 ± 1.33 B2 + Al3Ni2 0.2881 Al0.6Ni0.3Pt0.1 –29.68 ± 1.28 34.89 ± 1.54 –64.57 ± 2.23 Al3Ni2 – Al0.6Ni0.2Pt0.2 –45.75 ± 1.25 33.28 ± 0.52 –79.03 ± 1.64 Al3Ni2 – Al0.6Ni0.1Pt0.3 –57.74 ± 1.27 30.11 ± 0.81 –87.85 ± 1.77 Al3Ni2 – Al0.27Ni0.63Pt0.1 –12.29 ± 1.19 37.55 ± 0.96 –49.84 ± 1.79 B2 + L12 – Al0.27Ni0.68Pt0.05 –5.31 ± 1.16 36.54 ± 0.82 –41.85 ± 1.70 B2 + L12 – Al0.05Ni0.90Pt0.05 25.12 ± 1.3 39.96 ± 0.71 –14.84 ± 1.75 (Ni, Pt) – Al0.9Ni0.05Pt0.05 25.33 ± 0.84 43.85 ± 1.26 –18.52 ± 1.77 (Al) –
Fig. 13 Comparison of experimental enthalpies of formation at 298 K with empirical interpolations and Miedema’s model for Ni0.95–xAlxPt0.05.
Al–Ni–Pd
No ternary phase diagram of the Al–Ni–Pd system is available, so the enthalpies of formation and crys- tal structures of Al–Ni–Pd compounds were investigated to provide the basic data for developing the phase diagram.
Figure 14 shows that enthalpies of formation of Al–Ni–Pd compounds increase as Pd replaces Ni since the Al–Pd bonds are stronger than Al–Ni bonds. Figure 15 shows that the enthalpies of formation of Al0.5Ni0.5–xPdx(0 ≤x≤0.5) are linear between Ni0.5Al0.5and Pd0.5Al0.5, which indicates a negligi- ble second near-neighbor interaction energy between Ni and Pd.
Miedema’s model predicts less endothermic values for the enthalpies of formation, see Figs. 15 and 16. The empirical models predict the enthalpies of formation quite well with no particular model being generally better than the others.
R. HU et al.
1666
Fig. 14 Enthalpies of formation of Al–Ni–Pd compounds.
Fig. 15 Comparison of experimental enthalpies of formation at 298 K with empirical interpolations and Miedema’s model for Al Ni Pd.
XRD of Al0.5Ni0.5–xPdxalloys shows that they are single-phase B2 compound. Al0.4Ni0.6–xPdx(0
< x≤0.5) alloys are within the two-phase region, B2 + L12. The crystal structures and lattice parame- ters are summarized in Table 6. The lattice parameters of Al0.5Ni0.5–xPdxB2 phase, Fig. 17, show that with x increasing, the lattice parameter increases linearly, which indicates that the Pd simply substitutes for Ni on the Ni-sublattice.
Table 6 Phases and lattice parameters of the Al–Ni–Pd compounds.
Composition Reaction enthalpy, Heat content, Enthalpy of Phase Lattice parameter
∆H1(kJ/mol) ∆H2(kJ/mol) formation of B2 phase (nm)
∆Hf(kJ/mol)
Al0.5Ni0.5 –61.8 ± 1.11 B2 0.2887 [6]
[12]
Al0.5Ni0.4Pd0.1 –34.35 ± 0.55 31.04 ± 0.8 –65.39 ± 1.26 B2 0.2916 Al0.5Ni0.3Pd0.2 –40.45 ± 0.18 31.68 ± 0.87 –72.13 ± 1.19 B2 0.2956 Al0.5Ni0.2Pd0.3 –44.44 ± 1.95 33.52 ± 3.75 –77.96 ± 4.30 B2 0.2984 Al0.5Ni0.1Pd0.4* –50.52 ± 3.47 36.64 ± 3.03 –87.16 ± 4.85 B2 0.3001
Al0.5Pd0.5 –91.25 ± 4.7 B2 0.3049 [56]
[33]
Al0.40Ni0.60 –51.9 ± 1.7 B2 + L12 –
[12]
Al0.4Ni0.5Pd0.1 –20.61 ± 1.25 36.53 ± 1.12 –57.14 ± 1.86 B2 + L12 – Al0.4Ni0.4Pd0.2 –25.58 ± 1.42 36 ± 2.26 –61.58 ± 3.07 B2 + L12 – Al0.4Ni0.3Pd0.3 –35.87 ± 3.77 33.16 ± 2.91 –69.03 ± 4.83 B2 + L12 – Al0.4Ni0.2Pd0.4 –42.56 ± 2.2 32.52 ± 1.51 –75.08 ± 3.1 B2 + L12 –
*With small amount of non-B2 phase.
The results show that the B2 phase field extends across the ternary system from NiAl to PdAl.
However, the B2 phase field does not extend far on the Al-deficient side with all ternary compositions studied at constant Al0.4consisting of B2 + L12phases.
Fig. 16 Comparison of experimental enthalpies of formation at 298 K with empirical interpolations and Miedema’s model for Al0.4Ni0.6–xPdx.
Al–Ni–Cu
This system is unusual in that the extension of the B2 phase occurs along the composition line from NiAl to Cu3Al. Recent work on the Al–Ni–Cu system shows that there is a B2 phase miscibility gap [57], and consequently one expects this should be reflected in the enthalpy of formation.
The B2 phase boundary at 1173 K in Fig. 18 shows that the B2 phase shifts to the Cu-rich range at the Al–Cu side. The enthalpies of formation of Al0.4Ni0.6–xCux(0 ≤x≤0.45) decreased with x in- creasing, which indicates the weaker bonding of Al–Cu and the B2 crystal structure is not stable at the composition AlCu. Figure 19 shows no indication of a positive deviation in the enthalpy as observed in the Al–Ni–Ru system.
R. HU et al.
1668
Fig. 17 Lattice parameters of Al0.5Ni0.5–xPdxcompounds.
Fig. 18 Enthalpies of formation of Al–Ni–Cu compounds [58] and B2 phase boundary at 1173 K [59].
Phases and lattice parameters of alloys in Al–Ni–Cu are summarized in Table 7. Lattice para- meters of Al0.5Ni0.5–xCuxcompounds initially increased with x, but when x is larger than 0.20, Fig. 20, the lattice parameter becomes almost constant, which may indicate that these compositions are in a two- phase field. The lattice parameters of Al0.4Ni0.6–xCuxincrease, with x increasing in the single phase B2 region, Fig. 21.
Table 7 Phases and lattice parameters in the Al–Ni–Cu system.
Composition Reaction enthalpy, Heat content, Enthalpy of Phase Lattice parameter
∆H1(kJ/mol) ∆H2(kJ/mol) formation of B2 phase (nm)
∆Hf(kJ/mol)
Al0.5Ni0.5 –61.8 ± 1.11 B2 0.2887
[12]
Al0.5Ni0.45Cu0.05 –26.88 ± 0.87 29.23 ± 0.69 –56.11 ± 1.38 B2 0.2888 Al0.5Ni0.4Cu0.1 –26.26 ± 0.66 28.5 ± 0.58 –54.76 ± 1.29 B2 0.2894 Al0.5Ni0.35Cu0.15 –12.2 ± 0.87 28.9 ± 0.31 –41.1 ± 1.24 B2 0.2903 Al0.5Ni0.3Cu0.2 –9.94 ± 1.00 28.97 ± 0.70 –38.91 ± 1.54 B2 0.2909
Al0.5Ni0.25Cu0.25 0 32.02 ± 0.82 –32.02 ± 2.07 B2 0.2910
Al0.5Ni0.2Cu0.3* 5.06 ± 1.4 35.03 ± 1.5 –29.97 ± 2.26 B2 0.2910
Al0.40Ni0.60 –51.9 ± 1.7 B2 0.2865
[12] [6]
Al0.40Ni0.50Cu0.10 –18.93 ± 0.62 29.97 ± 0.81 –48.90 ± 1.39 B2 0.2882 Al0.40Ni0.40Cu0.20 –11.46 ± 1.86 30.17 ± 0.74 –41.63 ± 2.21 B2 0.2892 Al0.40Ni0.35Cu0.25 –8.07 ± 0.56 31.09 ± 0.77 –39.16 ± 1.26 B2 0.2895 Al0.40Ni0.30Cu0.30 –6.45 ± 1.07 31.06 ± 0.45 –37.51 ± 1.50 B2 0.2895 Al0.40Ni0.20Cu0.40 4 ± 0.36 33.23 ± 0.63 –29.23 ± 1.19 B2 0.2901 Al0.40Ni0.15Cu0.45 6.75 ± 1.41 38.53 ± 1.35 –31.78 ± 2.12 Not single 0.290
B2
Al0.55Ni0.30Cu0.15 –8.37 ± 0.95 33.06 ± 0.93 –41.43 ± 1.56 B2 + Al3Ni2 – Al0.10Ni0.10Cu0.80 29.48 ± 0.79 36.09 ± 1.12 –6.61 ± 1.60 (Ni, Cu) – Al0.3Ni0.20Cu0.5 9.95 ± 0.70 38.44 ± 2.71 –28.49 ± 2.95 B2 + A4 –
*With small amount of non-B2 phase.
Fig. 19 Enthalpies of formation of Al0.4Ni0.6–xCuxcompounds.
Heat content and capacity
The heat content of the Al0.5Ni0.35Cu0.15alloy between room temperature and high temperatures (from 1243 to 1470 K) was measured with the calorimeter, Fig. 22. The heat capacities were calculated over this temperature range by fitting the heat content linearly, resulting in 27.7 J/mol/K. which is close to the value of 33.2 J/mol/K estimated using the Neumann–Kopp rule and slightly lower than the value of Ni0.5Al0.5, which is about 30.5 J/mol/K. This is reasonable since the heat capacity of Cu is smaller than Ni in this temperature range.
R. HU et al.
1670
Fig. 20 Lattice parameters of Al0.5Ni0.5–xCuxcompounds.
Fig. 21 Lattice parameters of Al0.4Ni0.6–xCuxcompounds.
CONCLUSIONS
Atomic volume calculations in the Al–Ni–Fe system verify the constitutional defect site preference of Fe for the Al sublattice.
Comparisons of experimental data with the Miedema model and interpolation models show that any of the interpolation models will provide a more accurate prediction of the enthalpy of formation in a ternary system, assuming that the binary values are known accurately. No one interpolation model showed consistently more reliable predictions than any other.
The heat capacities of Al0.5Ni0.35Cu0.15 and Al0.5Ni0.2Ru0.3 were determined to be 27.74 and 27.2 J/mol/K, respectively.
When adding Cu, Pd, or Pt to NiAl, the lattice parameter of the B2 phase increases.
In the Al–Ni–Pd system, the B2 phase extends across the ternary system from NiAl to PdAl.
ACKNOWLEDGMENTS
We wish to thank the National Science Foundation under grants DMR 0209624 and DMR 0600690 for funding this work, Dr. Susan Meschel for her help in collecting the bibliography for this work and nu- merous discussions and advice regarding calorimeter experiments, Dr. Qiti Guo for help in maintenance and operation of the calorimeter, and Prof. Ole Kleppa for providing the inspiration for this work.
REFERENCES
1. P. Villars, A. Prince, H. Okamoto. Handbook of Ternary Alloy Phase Diagrams (computer file), ASM International, Materials Park, OH (1997).
2. T. B. Massalski, H. Okamoto, P. R. Subramanian, L. Kacprzak, W. W. Scott Jr. Binary Alloy Phase Diagrams, 2nded., ASM International, Materials Park, OH (1990).
3. F. Mücklich, N. Ilić. Intermetallics 13, 5 (2005).
4. C. L. Fu. Phys. Rev. B 32, 3151 (1995).
5. H. Araki, T. Mimura, P. Chalermkarnnon, M. Mizuno, Y. Shirai. Mater. Trans., JIM 43, 1498 (2002).
Fig. 22 Heat content and heat capacity of Al0.5Ni0.35Cu0.15at high temperature.
6. R. D. Noebe, R. R. Bowman, M. V. Nathal. Review of the Physical and Mechanical Properties and Potential Applications of the B2 Compound NiAl, NASA Technical Memorandum 105598, 1992.
7. S. J. Suh, M. Dollar, P. Nash. Mater. Sci. Eng., A 192/193, 691 (1995).
8. S. H. Kim, M. H. Oh, D. M. Wee. Metall. Trans. A 34, 2089 (2003).
9. X. Y. Cheng, X. J. Wan, J. T. Guo, C. T. Liu. Scripta Mater. 38, 959 (1998).
10. R. Kainuma, X. J. Liu, I. Ohnuma, S. M. Hao, K. Ishida. Intermetallics 13, 655 (2005).
11. W. Huang, Y. A. Chang. Intermetallics 6, 487 (1998).
12. P. Nash, O. Kleppa. J. Alloys Compd. 321, 228 (2001).
13. J. Breuer, A. Grün, F. Sommer, E. J. Mittemeijer. Metall. Trans. B 32, 913 (2001).
14. N. Bornsen, G. Bester, B. Meyer, M. Fahnle. J. Alloys Compd. 308, 1 (2000).
15. M. Fähnle, B. Meyer, G. Bester, J. Majer, N. Börnsen. Defect Diffusion Forum 194–199, 279 (2001).
16. V. Kuznetsovy, K. Tsaiz, T. Turkebaevz. J. Phys.: Condens. Matter 10, 8957 (1998).
17. R. L. Fleischer. J. Mater. Res. 8, 59 (1993).
18. H.-N. Su, P. Nash, Z. K. Liu. "Enthalpies of Formation of Alloys in the Al-Ni-Fe System", in High Temperature Corrosion and Materials Chemistry, IV, E. Opila, P. Hou, E. Wuchina, B. Pieraggi, T. Maruyama (Eds.), Electrochemical Society, Inc., Pennington, NJ (2003).
19. H. N. Su, P. Nash. J. Alloys Compd. 403, 217 (2005).
20. G. Ghosh, M. Asta. Acta Mater. 53, 3225 (2005).
21. C. Jiang, M. F. Besser, D. J. Sordelet, B. Gleeson. Acta Mater. 53, 2101 (2005).
22. N. Stefanou, R. Zeller, P. H. Dederichs. Phys. Rev. B 35, 2705 (1987).
23. B. D. Cullity, S. R. Stock. Elements of X-ray Diffraction, 3rded., Prentice Hall, Upper Saddle River, NJ (2001).
24. J. P. Neumann. Acta Metall. 28, 1165 (1980).
25. L. M. Pike, Y. A. Chang, C. T. Liu. Acta. Mater. 45, 3709 (1997).
26. L. M. Pike, I. M. Anderson, C. T. Liu, Y. A. Chang. Acta Mater. 50, 3859 (2002).
27. S. V. Meschel, O. J. Kleppa. In Metallic Alloys: Experimental and Theoretical Perspectives, J. S.
Faulkner, R. G. Jordan (Eds.), pp. 103–112, Kluwer Academic, Dordrecht (1994).
28. R. Hultgren, P. D. Desai, D. T. Hawkins, M. Gleiser, K. K. Kelley. Selected Values of Thermodynamics Properties of Binary Alloys, ASM International, Materials Park, OH (1973).
29. O. Kubaschewski, G. Heymer. Trans. Faraday Soc. 56, 473 (1960).
30. R. Hu, P. Nash. J. Mater. Sci. Lett. 40, 1067 (2005).
31. A. P. Bayanov. Russ. J. Phys. Chem. 45, 1077 (1971).
32. W.-G. Jung, O. J. Kleppa. Metall. Mater. Trans. B 23, 53 (1992).
33. W.-G. Jung, O. J. Kleppa. J. Alloys Compd. 176, 309 (1991).
34. F. R. de Boer, D. G. Pettifor. Cohesion in Metals, Vol. 1, North-Holland, Amsterdam (1988).
35. N. Selhaoui, O. J. Kleppa. J. Alloys Compd. 191, 145 (1993).
36. Q. Guo, O. J. Kleppa. J. Alloys Compd. 269, 181 (1998).
37. C. Colinet, A. Pasturel, K. H. J. Buschow. J. Appl. Phys. 62, 3712 (1987).
38. J. N. Pratt, J. M. Bird, S. Martosudirdjo. Rep. U.S. Army, Contr. DAJA 37-73-C-3010, Univ. of Birmingham, UK (1974).
39. C. R. Kao, L. M. Pike, S.-L. Chen, Y. A. Chang. Intermetallics 2, 235 (1994).
40. Y. A. Chang, J. P. Neumann. Prog. Solid State Chem. 14, 211 (1982).
41. H. Bakker. Enthalpies in Alloys: Miedema’s Semi-empirical Model, Trans. Tech. Publications (1998).
42. M. Hillert. Calphad 4, 1 (1980).
43. F. Kohler. Monatsh. Chem. 91, 738 (1960).
44. I. Ansara. Mater. Res. Soc. Symp. Proc. 19, 107 (1983).
45. Y. M. Muggianu, M. Gambino, J. P. Bros. J. Chim. Phys. 72, 83 (1975).
R. HU et al.
1672
46. G. W. Toop. Trans. AIME 233, 850 (1965).
47. S. V. Meschel, O. J. Kleppa. J. Alloys Compd. 197, 75 (1993).
48. S. V. Meschel, O. J. Kleppa. J. Alloys Compd. 191, 111 (1993).
49. P. Nash. Phase Diagrams of Binary Nickel Alloys, ASM International, Materials Park, OH (1991).
50. L. Kaufman, H. Nesor. Metall. Trans. 5, 1623 (1974).
51. H. N. Su. Thermodynamic Modeling of Al and Ni Based Ternary Alloys, Ph.D. dissertation, Illinois Institute of Technology, Chicago, Dec. 2004.
52. I. J. Horner, N. Hall, L. A. Cornish, M. J. Witcomb, M. B. Cortie, T. D. Boniface. J. Alloys Compd. 264, 173 (1998).
53. I. Vjunitsky, E. Schonfeld, T. Kaiser, W. Steurer, V. Shklover. Intermetallics 13, 35 (2005).
54. K. Rzyman, Z. Moser, A. P. Miodownik, L. Kaufman, R. E. Watson, M. Weinert. Calphad 24, 309 (2000).
55. M. R. Jackson, J. R. Rairoden. “Protective coatings for superalloys and the use of phase dia- grams”, NBS, National Bureau of Standards, special publications, SP-496, Applications of phase diagrams in metallurgy and ceramics, proceedings of workshop, Gaithersburg, MD 1977 (498), 423 (1978).
56. P. Villars, L. D. Calvert. Pearson’s Handbook of Crystallographic Data for Intermetallic Phases, Vol. 1, ASM International, Materials Park, OH (1985).
57. R. Kainuma, X. J. Liu, I. Ohnuma, S. M. Hao, K. Ishida. Intermetallics 13, 655 (2005).
58. R. Hu, P. Nash. J. Mater. Sci. 41, 631 (2006).
59. W. Köster, U. Zwicker, K. Moeller. Zeit. Metall. 39, 225 (1948).
![Table 2 ∆ H Al–X and ∆ H Ni–X at 298 K [34] (kJ/mol). Ni Co Pd Pt Fe Ru Al 9 X 2 –30 Al 4 X –57 Al 13 X 4 –32 Al 3 X –38 –38 –51* –28 Al 5 X 2 –41 –25 Al 2 X –26 Al 3 X 2 –57 –84* –96.5 [47] Al–X AlX –62 –53.4 –91.25 –97.6 –26.5 –54.5 [30] [27] [33] [33]](https://thumb-eu.123doks.com/thumbv2/1library_info/5135797.1659675/7.810.107.701.141.479/table-al-and-ni-mol-ni-co-alx.webp)
![Fig. 5 Enthalpies of formation of B2 compounds in the Al–Ni–Fe system [18] and B2 phase boundary at 1400 K [50].](https://thumb-eu.123doks.com/thumbv2/1library_info/5135797.1659675/8.810.97.715.102.426/fig-enthalpies-formation-compounds-al-ni-phase-boundary.webp)