doi:10.1351/pac200678051039
© 2006 IUPAC
Physical techniques and catalyst preparation:
Determining the interactions of transition-metal complexes with oxide surfaces*
Xavier Carrier
1,‡, Eric Marceau
1, and Michel Che
1,21Laboratoire de Réactivité de Surface (UMR 7609-CNRS), Université Pierre et Marie Curie, 4 Place Jussieu, 75252 Paris Cédex 05, France;2Institut Universitaire de France
Abstract: This contribution presents the molecular approach used to investigate the different preparation steps of important catalytic systems, based on Mo, Ni, and Co. The first prepa- ration step consists of impregnating oxide supports by aqueous solutions of transition-metal complexes (TMCs), called precursor complexes, and involves the liquid–solid (wet) inter- face. The following steps consist of thermal activation treatments, involving the gas–solid (dry) interface. The molecular approach is based on (i) the use of the TMC to monitor and probe the nature of its own interactions with the oxide support, (ii) the selection of the most appropriate techniques to monitor such interactions, and (iii) the design of experiments to identify and isolate the key parameters controlling the “TMC–oxide support” interactions.
Physical techniques play a key role in the characterization of catalyst preparation both at the macroscopic [temperature-programmed reduction (TPR), X-ray diffraction (XRD)]
and molecular [Raman, X-ray absorption near-edge spectroscopy–extended X-ray absorption fine structure XANES–(EXAFS), diffuse reflectance UV–vis] levels, particularly when they are used simultaneously. They give some insight into the structure of the species existing on the surface, with the oxide support behaving as a solid ligand, when exposed for a short time to the precursor complex solution or after thermal treatment, or, for longer contact times, as a reactant.
Keywords: catalysts; spectroscopy; Raman; EXAFS; XANES; UV–visible; cobalt; molyb- denum; nickel; alumina.
INTRODUCTION
Supported catalysts constitute the most important class of catalytic systems not only because of their economic importance [1], but also because of the variety of reactions they are able to promote [2,3].
Several strategies exist to design and synthesize such catalysts, and Thomas has reviewed one of them, the integrated strategy, for active site engineering in micro- and mesoporous solids [4]. When large quantities of catalyst are required, some strategies, however, become difficult or impossible to apply.
The present lecture concerns such types of catalysts, particularly oxide-supported ones, produced at the industrial scale from conventional oxides such as alumina, silica, zeolites, etc., using water-soluble mo- lecular complexes as precursors of the catalytically active phase.
*Paper presented at the 40thIUPAC Congress, Beijing, China, 14–19 August 2005. Other presentations are published in this issue, pp. 889–1090.
‡Corresponding author
The preparation of catalysts involves several stages, called unit operations in the industry [5] or preparation steps in the laboratory, such as impregnation, elimination of the solvent, drying, calcination, and reduction. Industry and laboratory procedures can be the same; however, they differ by the quanti- ties of catalysts prepared, typically on the order of tons for industry and grams for the laboratory.
A given sequence of preparation steps, together with the catalytic reaction, constitute the catalyst history [6,7]. The latter can be divided essentially into three parts, the first involving the liquid–solid or wet interface with deposition of the active component precursor in a divided form on the support, the second involving the gas–solid or dry interface with transformation of the precursor into the required catalytically active phase, and the third, also involving the dry interface, with the catalytic reaction it- self [8].
In oxide-supported catalysts, active sites are difficult to characterize because they are located at the frontiers of two or three phases (solid catalyst, on one hand, and liquid and/or gas, on the other hand), where the structure is ill-defined and where techniques and theories do not always apply easily.
In contrast with molecular chemistry and the help given by X-ray diffraction (XRD) on well-defined single crystals, it is a whole set of techniques which must be chosen properly to provide us with the in- formation required before proposing a possible formula or structure for the species interacting with the surface.
In order to study catalyst preparation, we have developed the following approach [6,7] based on:
(i) the use of transition-metal complexes (TMCs) to monitor and probe the nature of their own inter- actions with the oxide support; (ii) the selection of the most appropriate techniques to monitor such interactions, both at the macroscopic and molecular levels; and (iii) the design of experiments to iden- tify and isolate the key parameters controlling the “precursor metal complex–support” interactions.
Within this context, the present contribution will focus on the use of physical techniques to study supported catalysts at different preparation steps and at the macroscopic and molecular levels. Typical examples of systems based on Mo, Ni, and Co will be presented, showing that the combination of se- lected techniques can lead to a much improved description at the molecular level of the transition-metal speciation—being understood as the distribution of the element among various defined chemical com- pounds in these important catalytic systems [9].
MOLYBDENUM SPECIATION IN SUPPORTED Mo CATALYSTS: A COMPARISON OF RAMAN AND EXAFS
Raman spectroscopy and extended X-ray absorption fine structure (EXAFS) are among the most em- ployed spectroscopic techniques for a molecular-scale characterization of heterogeneous catalyst prepa- ration and have led to many review papers (e.g., [10–15] for Raman and [16–18] as well as two special issues in Topics in Catalysis: 10(3,4) 2000 and 18(1,2) 2002 for EXAFS).
However, it is now well recognized [19] that an accurate description of catalytic materials during their preparation, activation, and operation (catalytic reaction) requires measurements in realistic con- ditions (in situ) with the ultimate goal of combining two or more spectroscopic techniques in order to obtain structure–reactivity relationships. Hence, more and more studies are directed toward the com- bined use of characterization techniques, i.e., simultaneously on the same materials in the same envi- ronment with the benefit of avoiding experimental differences (temperature, sample preparation and conditioning, dead space volumes…) that may prevent correlation between separate spectroscopic and catalytic measurements. At present, up to three different techniques have been combined on the same reactor [20]. Nevertheless, one may legitimately wonder whether the combination of techniques, despite being technically challenging, is always scientifically relevant. This question is particularly appropriate when one refers to the combination of Raman and EXAFS. Indeed, despite relying on very different physical principles, both techniques have very similar potentials in determining the coordination, oxi- dation state, as well as dispersion of a given element [19]. The aim of this section is to use selected ex- amples (alumina- and silica–alumina-supported Mo catalysts, which are used at the industrial scale for
hydrotreating and hydrocracking purposes) to show that both techniques are truly complementary for the characterization of catalytic materials.
Alumina-supported Mo catalysts: Reconciling EXAFS and Raman experiments Experimental details
Alumina-supported Mo catalysts can be prepared by a variety of methods [21], but the conventional in- cipient wetness impregnation was chosen in this study since it is directly relevant to industrial proce- dures. Catalysts containing ca. 9 Mo wt % were prepared on γ-alumina (surface area: 200 m2 g–1) with a conventional Mo precursor: ammonium heptamolybdate (hereafter noted AHM, Merck) accord- ing to ref. [22]. Two different preparation routes were followed in order to deposit two types of Mo polyanions. In the first route, the oxide/water contact time was maximized by leaving the sample, still damp, to dry in air at room temperature for ca. 20 h after the impregnation step. This sample will be de- noted as aged Mo/Al2O3. For the second route, the oxide/water contact time was minimized by im- pregnating the support as quickly as possible (a few seconds) before freezing the catalyst in liquid ni- trogen. The catalyst was then freeze-dried under vacuum and stored under vacuum in a dessicator over silica gel. This sample will be denoted as freeze-dried Mo/Al2O3.
A reference Anderson-type heteropolyanion (NH4)3[Al(OH)6Mo6O18] (hereafter noted AlMo6) was synthesized according to ref. [23].
Raman spectra were collected on a modified Dilor OMARS 89 spectrometer with the 488 nm line of an Ar+ion laser with a laser power of 30 mW at the sample position. EXAFS data were collected in the transmission mode at the Laboratoire pour l’Utilisation du Rayonnement Electromagnétique (LURE, France) on beam line D42 or D44 using a Ge(400) two-crystal monochromator. The electron energy and ring current were 1.85 GeV and 250 mA, respectively. Fourier transformation (FT) and Fourier filtering were conducted using “EXAFS98”, and multiple shell fitting was carried out with
“Round Midnight” [24a]. Phase and amplitude functions were generated using FEFF 7.02 [24b].
Characterization of reference compounds
The spectra of reference compounds (AHM and AlMo6) will be presented first for a better understand- ing of the results obtained on supported catalysts.
EXAFS analysis
The FT of the EXAFS spectrum of AlMo6is shown in Fig. 1a along with a schematic representation of the polyanion. This spectrum can be adequately fitted with FEFF-derived phase and amplitude function for the Mo–O, Mo–Mo, and Mo–Al pairs generated from the crystallographic data of this compound [25]. The results of the EXAFS analysis are in close agreement with the crystallographic data (Table 1).
It is well known that most of the polyoxoanions of Mo are made of edge-sharing octahedra with a cis- dioxo structure (two short adjacent terminal Mo=O bonds) [26] with a spread in Mo–O distances from about 1.7 to 2.3 Å as confirmed by the results given in Table 1. The many different distances make a thorough quantitative EXAFS analysis of the first Mo–O shell rather difficult [27]. As a matter of fact, many results obtained on supported oxidic Mo compounds lead to low oxygen coordination number [28] or to imperfect fits [29].
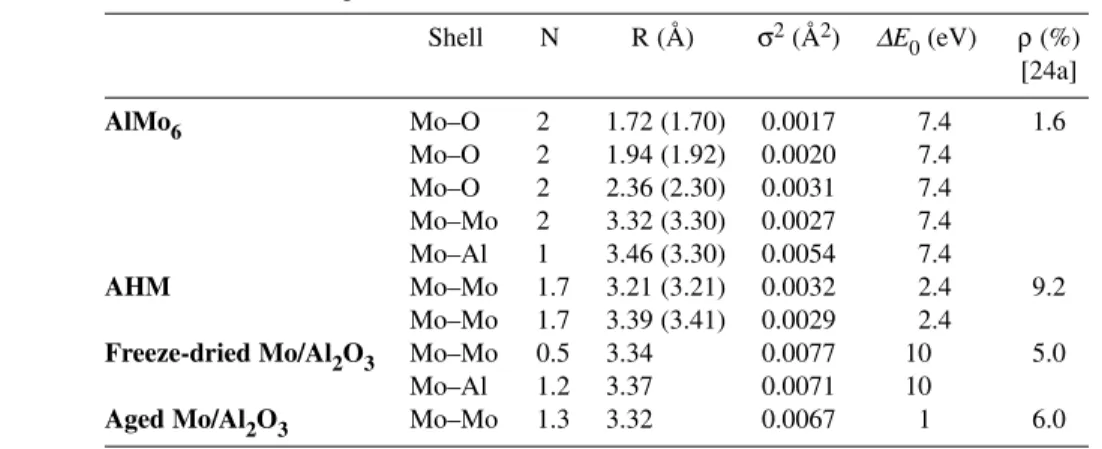
Table 1 EXAFS fitting results.a,b
Shell N R (Å) σ2(Å2) ∆E0(eV) ρ (%) [24a]
AlMo6 Mo–O 2 1.72 (1.70) 0.0017 7.4 1.6
Mo–O 2 1.94 (1.92) 0.0020 7.4
Mo–O 2 2.36 (2.30) 0.0031 7.4
Mo–Mo 2 3.32 (3.30) 0.0027 7.4
Mo–Al 1 3.46 (3.30) 0.0054 7.4
AHM Mo–Mo 1.7 3.21 (3.21) 0.0032 2.4 9.2
Mo–Mo 1.7 3.39 (3.41) 0.0029 2.4
Freeze-dried Mo/Al2O3 Mo–Mo 0.5 3.34 0.0077 10 5.0
Mo–Al 1.2 3.37 0.0071 10
Aged Mo/Al2O3 Mo–Mo 1.3 3.32 0.0067 1 6.0
aAverage crystallographic distances are given in parenthesis.
bStandard errors in EXAFS are ±0.02 Å for distances and ±10 % for coordination numbers.
It is more interesting to focus on the second shell, which includes Mo and Al atoms in this case.
A good fit is only obtained with a Mo–Al distance substantially longer than the crystallographic one. It is interesting to note that the same conclusion was drawn by Plazenet et al. [30] for AlMo6. However, it is worth pointing out that the addition of one Al atom is statistically dubious if the crystallographic structure was unknown. As an example, the EXAFS signal obtained by Fourier-filtering the second shell (∆R = 2.3–3.7 Å) of Fig. 1a is compared with the fitted signal obtained by considering two Mo neigh- bors only (Fig. 1c). A very good agreement is obtained in this case, and the addition of one Al atom does not improve the quality of the fit. This result can easily be explained by the overwhelming signal arising from two Mo atoms, which are strong back-scattering elements.
Fig. 1 Fourier transforms (FT, ∆k = 2.7–13.5 Å) uncorrected for phase-shift of k3-weighted Mo K-edge EXAFS spectra recorded at 77 K of (a) AlMo6along with the result of the fit (dashed line) and (b) AHM. Fourier-filtered k3-weighted Mo K-edge EXAFS signal extracted from (c) AlMo6(∆R = 2.3–3.7 Å, Fig. 1a) and (d) AHM (∆R = 2.1–3.7 Å, Fig. 1b) are also shown with the corresponding fits (dashed line). Both simulations take into account two types of Mo neighbors only.
The FT for AHM (Fig. 1b) strongly differs from that of AlMo6. It is interesting to note that the rel- ative intensities of the peaks corresponding to the Mo–O shells are quite different from those present in AlMo6. However, both entities are made of Mo octahedra with similar Mo–O distances (spanning ca.
1.7–2.3 Å). Hence, it is clear that subtle changes in the geometry may lead to drastic changes in EXAFS spectra explained in terms of destructive interferences between signals arising from different shells.
Hence, it is again clear that a precise quantification of the number of O neighbors will be most difficult for ill-defined compounds such as supported catalysts. The second shell (Mo–Mo) shows two maxima with a shoulder on the first peak. This complex pattern can be explained by the existence of three dif- ferent types of Mo atoms in AHM with four different Mo–Mo distances (from 3.19 to 3.43 Å) [31]. It is shown in Fig. 1d that this second shell can be very satisfactorily fitted (Fig. 1d and Table 1) with two contributions only with an average coordination number of 1.7 for both types of Mo in agreement with the molecular structure of AHM [31].
Hence, both polyoxoanions appear to be easily discriminated by EXAFS by careful analysis of the second shell.
Raman spectroscopy
Polyoxomolybdic compounds show predominant Raman bands above ca. 900 cm–1assigned to sym- metric and antisymmetric stretching modes of terminal Mo=O bonds and below 400 cm–1to bending modes [14]. Accordingly, the Raman spectrum of AHM (Fig. 2a) shows one intense peak at 936 cm–1 along with a doublet centered at 887 cm–1and one weaker band in the bending region at 364 cm–1in agreement with published data [14]. The resolution of the spectrum is lower in the liquid state (Fig. 2b) with a shift of about 10 cm–1toward higher wavenumbers of the high-frequency bands. This shift may result from the loss of intermolecular bonds between AHM molecules through ammonium cations and water molecules in the solid state. The liquid-state spectrum is thus probably more representative of the situation encountered in supported catalysts where dispersed molecular entities do not interact with each other. The Raman spectrum of [AlMo6] is presented in Fig. 2d and shows four main bands at 357, 573, 900, and 946 cm–1in agreement with published data [22,32]. Based on the work by Le Bihan et al. [32], the band at 573 cm–1is not assigned to a pure Mo–O vibration, but rather to the Al–O stretch- ing mode. In line with data for AHM, the position of the high-frequency bands are shifted toward higher wavenumbers for solutions (950 and 910 cm–1), while the Al–O vibration is shifted toward lower wavenumbers at 565 cm–1[33].
Fig. 2 Raman spectra in ambient conditions of (a) AHM (solid state), (b) AHM in aqueous solution ([Mo] = 0.1 M, pH = 5.1), (c) freeze-dried Mo/Al2O3, (d) AlMo6(solid state), and (e) aged Mo/Al2O3.
Mo/Al2O3catalysts Raman spectroscopy
The spectroscopic characterization of supported catalysts by comparison with spectra obtained on ref- erence compounds is rarely straightforward. Indeed, an obvious complication arises from the large width of bands obtained after deposition of TMCs on an oxide surface leading to ill-defined species.
Hence, the spectroscopic signatures of different reference compounds have to be fairly different in order to be used as fingerprints. As a consequence, it is usually extremely difficult to distinguish closely sim- ilar polyoxomolybdate species with Raman spectroscopy. Indeed, most of these species consist of edge- sharing octahedra with a distorted geometry that gives rise to Mo–O vibrations (stretching or bending modes) in the same region. In our case, the main difference that can be found between AHM (Fig. 2b) and AlMo6(Fig. 2d) is the almost complete absence of any vibration in the 565–575 cm–1region for the former. The 565–575 cm–1region is actually the only part of the spectrum that can be used as a true fingerprint of AlMo6since the latter is characterized by a fairly intense band at 573 cm–1in the solid state and 565 cm–1in the liquid state [22].
The absence of any band in the 565–575 cm–1region in Fig. 2c for the freeze-dried Mo/Al2O3 catalysts is thus a clear indication of the extremely low concentration of AlMo6(if any) for this catalyst.
One could argue that a very weak hump centered at 560 cm–1can be seen on Fig. 2c. However, it has to be noticed that this weak hump disappears after drying at 150 °C in contrast to the aged Mo/Al2O3 catalyst [22]. Moreover, the positions of the terminal Mo–O stretching modes closely match those ob- served for AHM. Hence, it can be concluded that this preparation route leads to an heptamolybdate-like species deposited on the alumina surface.
Conversely, all the bands of AlMo6are observed with a good resolution on the Raman spectrum of the aged Mo/Al2O3catalyst (Fig. 2e). The characteristic Al–O band at 573 cm–1is clearly observed, undoubtedly indicating that AlMo6is formed during incipient wetness impregnation of alumina with AHM. We showed previously that impregnation of alumina in aqueous phase leads to extensive alumina dissolution and consecutive formation of AlMo6through complexation of MoVIwith dissolved AlIII [22,33].
Hence, results obtained with Raman spectroscopy converge to show that heptamolybdate-like species are deposited on the alumina surface for the freeze-dried Mo/Al2O3sample while AlMo6 is formed via dissolution of alumina and deposited on the surface for the Mo/Al2O3aged sample. It has to be noted that these results can also easily be confirmed by XRD [22].
EXAFS analysis
The FT of the EXAFS spectra for the aged and freeze-dried catalysts are shown in Fig. 3. The first shell (Mo–O) will not be discussed since, as mentioned above, the spread of Mo–O distances in polymolyb- dates leads to inaccurate results with meaningless information. However, careful analysis of the second shell is more informative. It appears that the second shell (gray zone) for both catalysts is fairly differ- ent in intensity from that observed on AlMo6(Fig. 1a) and in shape from that of AHM (Fig. 1b). Hence, a purely qualitative interpretation is not possible by simple comparison with reference spectra in con- trast to Raman spectroscopy.
Quantitative data analysis was performed by fitting the second shell with Mo–Al and Mo–Mo pairs. The results of the curve fittings are shown on Fig. 3 and Table 1. First, it appears that the maxi- mum amplitude of the χ(k) function is lower for the freeze-dried catalyst (Fig. 3c, kmax= 7.6 Å–1) than for the aged catalysts (Fig. 3d, kmax= 9.7 Å–1), which implies different back-scatterers in the second shell or at least a different structure of the supported phase for both catalysts.
The best fit for the freeze-dried catalyst is obtained with both Al (N = 1.2) and Mo (N = 0.5) neighbors (Fig. 3c). The introduction of Al atoms is essential for fitting the low k region in agreement with the fact that the χ(k) function peaks at a lower maximum (kmax= 7.6 Å–1) than for AlMo6(Fig. 1c, kmax= 10.8 Å–1), which has predominant contributions of Mo atoms in the second shell. This result suggests that Mo atoms are well dispersed (almost no Mo neighbors). Yet, this simple interpretation is
in disagreement with the Raman results that show high-frequency Mo–O bands (Fig. 2c) in the usual range of polymolybdates (Fig. 2b). The observation of Al atoms also suggests the grafting (formation of Mo–O–Al bonds) of Mo species onto alumina with a Mo–Al distance (3.36 Å) in agreement with edge-shared octahedra as those found in AlMo6(3.30 Å).
The aged catalysts can be satisfactorily fitted with Mo neighbors only in agreement with the χ(k) function peaking at higher maximum than for the freeze-dried sample. A slight mismatch at low k (below 6 Å–1) may be explained by a small Mo–Al contribution. The maximum of amplitude (kmax= 9.7 Å–1) is close to that of AlMo6(kmax= 10.8 Å–1) and the Mo–Mo distance is equal to that found for this species. However, the Mo–Mo coordination number (NMo–Mo= 1.3) is lower that that for AlMo6(2 Mo neighbors) and the Debye–Waller factor is higher. These results are also in disagreement with Raman data that convincingly showed the presence of AlMo6on the alumina surface for this cat- alyst.
Comparison of EXAFS and Raman
EXAFS data analysis gives Mo–Mo coordination numbers (below 1.3) that are much lower than those expected by Raman, which showed the presence of AHM-like species (theoretical NMo–Mo = 3.4) for the freeze-dried catalysts or of AlMo6(theoretical NMo–Mo= 2) for the aged catalysts. As a matter of fact, most of literature data agree on this point. Leliveld et al. [29] found a NMo–Moof 0.7 and 0.4 for noncalcined and calcined Mo/Al2O3catalysts with about the same Mo loading as the samples studied here, and Kisfaludi et al. [34] found a NMo–Moof 0.5 for a catalyst prepared by thermal spreading in presence of water vapor while Clausen et al. [28] and Shi et al. [35] did not observe any second shell for the same range of Mo loading. It is interesting to mention that the discrepancy between Raman and EXAFS results on alumina-supported Mo catalysts was already pointed out by Chiu et al. [36] who fur- ther proposed that “significant quantities of polymolybdates are not sampled by EXAFS spectra”. This statement is probably restricted to alumina-supported Mo species since, for example, Plazenet et al. [30]
found a very good agreement between Raman and EXAFS for the detection of AlMo6in zeolite-sup- ported Mo catalysts. The latter result is also obtained on silica–alumina-supported samples as shown below.
The low coordination number observed on alumina may arise from a strong distorsion of poly- molybdic species on alumina that leads to high static disorder, making a thorough analysis of oxidic Fig. 3 FT (∆k = 2.7–13.5 Å) uncorrected for phase-shift of k3-weighted Mo K-edge EXAFS spectra recorded at 77 K of (a) freeze-dried Mo/Al2O3 and (b) aged Mo/Al2O3 as well as corresponding Fourier-filtered EXAFS signal (gray zone, ∆R = 2.5–3.6 Å) and best fits: (c) freeze-dried Mo/Al2O3and (d) aged Mo/Al2O3.
precursors very difficult [27]. As a matter of fact, most of the literature data on Mo K-edge EXAFS focus on sulfided catalysts, which are less difficult to analyze since two shells (Mo–S and Mo–Mo) are usually observed with a single distance for each. However, even in this case, there is still a discrepancy between the MoS2crystallite size measured by EXAFS and transmission electron microscopy (TEM) [37], which is explained by the structural disorder of the Mo sulfide particles.
However, the low Mo–Mo coordination number may also be explained by the presence of a small amount of monomeric MoO42–species that would not be detected by Raman spectroscopy.
This example shows that both Raman and EXAFS can clearly benefit from each other. Raman spectroscopy helps to correct the Mo–Mo coordination numbers found in EXAFS, while EXAFS sug- gests the grafting of AHM-like species in the freeze-dried catalysts (Mo–O–Al bond), which would be very difficult to detect by Raman [15].
Influence of moisture on the surface speciation of Mo supported on amorphous silica–alumina: A combined EXAFS–Raman study
Experimental details
A 5 Mo wt % catalyst was prepared by incipient wetness impregnation of ammonium heptamolybdate on a commercial (Grace–Davison) amorphous silica–alumina (ASA) containing 25 wt % alumina. The catalyst was then calcined at 500 °C for 3 h. This catalyst was characterized through a combined EXAFS–Raman study at the LURE facility [38]. The EXAFS details are the same as above. A Raman spectrometer (Model HL5R of Kaiser Optical Systems) working at 785 nm was used with optical fibers for excitation by the laser and for collection of the scattered Raman signal. The sample was pressed into a self-supported pellet and introduced into a closed cell swept by a stream of water-saturated oxygen at room temperature. A geometry similar to conventional fluorescence X-ray absorption spectrometry (XAS) experiments was adopted for Raman signal detection. The sample-holder orientation was set to 45° with respect to incident X-rays in order to allow simultaneous recording of Raman and EXAFS spectra. Each Raman spectrum corresponds to an integration time of 10 s. In order to compare Mo–K edge EXAFS and Raman spectra in the same temporal frame, 200 Raman spectra were averaged while 4 EXAFS spectra were recorded. Each averaged spectrum was thus collected every 75 min up to 20 h of hydration, and a last spectrum was collected after 40 h of hydration.
Raman results
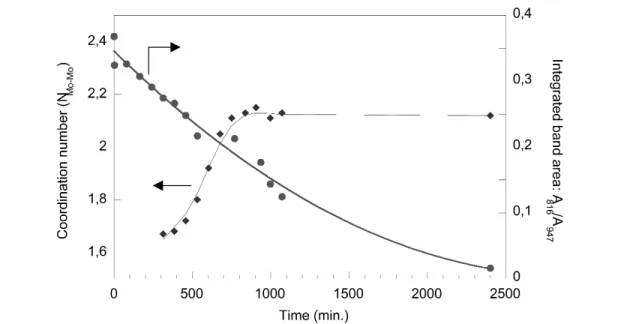
Raman spectra collected during room-temperature hydration of Mo/ASA are presented in Fig. 4A as a function of hydration time. The Raman spectrum of the sample before exposure to moisture exhibits the characteristic lines of MoO3at 816 and 993 cm–1together with a broad band centered at ca. 947 cm–1 characteristic of surface isopolymolybdic entities (see above). It is important to stress that the relative band intensities for MoO3and the isopolymolybdic species do not reflect the relative amount of each phase. Indeed, the high Raman cross-section of MoO3makes this species a strong Raman scatterer, and the bands related to MoO3probably correspond to a small amount of oxide. Examination of Raman spectra obtained after exposure to moisture shows (i) a sharpening and an increase of the band at about 947 cm–1and (ii) the appearance of a shoulder at 910 cm–1along with a weak band at about 560 cm–1. These bands clearly indicate the formation of AlMo6entities. At the same time, a decrease of intensity of the Raman bands assigned to MoO3is unequivocally observed. A plot of the ratio of the integrated band areas at 816 (MoO3) and 947 cm–1(polymolybdic species) confirms this observation (Fig. 5).
Hence, Raman results suggest that prolonged exposure of a calcined Mo/ASA catalyst to moisture leads to the nearly total disappearance of the MoO3phase at the expense of the formation of AlMo6.
EXAFS results
EXAFS data collected simultaneously with Raman spectra discussed above are shown in Fig. 4B. The spectrum obtained on the calcined sample (before exposure to moisture) is qualitatively very similar to that obtained on alumina-supported samples (Figs. 3a, 3b). Accordingly, the second sphere can be fit- ted with 1.6 Mo neighbors at a distance of 3.30 Å. In the course of rehydration, changes of the first and second coordination spheres around Mo are observed. A quantitative analysis of the second shell (Fig. 5) shows that the number of Mo neighbors steadily increases up to ca. 2.1 after 900 min of hy- dration (15 h) and levels off afterwards. These observations can be related to the structural changes ob- served with Raman (formation of AlMo6) since the coordination number (NMo–Mo= 2.1) as well as the Mo–Mo distance (average dMo–Mo= 3.31 Å) obtained after reaching the plateau is in good agreement with that obtained on pure AlMo6(Table 1).
Comparison of EXAFS and Raman
XAS or Raman results would be very difficult to interpret separately. The mixture of MoO3and isopoly- molybdic entities in the calcined sample cannot be revealed by EXAFS alone due to the very low amount of MoO3, while its high Raman cross-section allows its facile detection by Raman. The high Fig. 4 Combined EXAFS–Raman characterization of a calcined Mo/ASA catalyst during room-temperature rehydration in a flow of water-saturated oxygen. Only a selection of spectra are presented for the sake of brevity.
The first spectrum is that of the calcined catalyst before contact with moisture, and the last one is that after 40 h of hydration. (A) Raman spectra and (B) FT (∆k = 4–15 Å) uncorrected for phase-shift of k3-weighted Mo K-edge EXAFS spectra.
sensitivity of Raman to slight changes in Mo speciation is further underlined in Fig. 5: EXAFS tends to show that a steady state is reached after 15 h of hydration (Fig. 5) since the Mo coordination number remains unchanged while quantitative analysis of Raman results proves the constant disappearance of MoO3up to 40 h of hydration. On the other hand, quantification of each species in Raman is very dif- ficult, while EXAFS gives a result that is averaged over all surface Mo species. The Mo–Mo coordina- tion number and distance found with EXAFS after 15 h of hydration are in good agreement with the presence of AlMo6. This is convincing proof that a vast majority of surface species corresponds to the aluminoheteropolymolybdate.
Hence, combination of Raman and EXAFS shows that the sole presence of moisture at room tem- perature (i.e., in the absence of thermal activation) leads to the spreading of MoO3on the surface ac- cording to the following reaction:
12 MoO3+ Al2O3+ 9 H2O →2 [Al(OH)6Mo6O18]3–+ 6 H+
However, it cannot be fully excluded that isopolymolybdates are also formed in the course of the hydration process (possibly as intermediate species for the formation of AlMo6).
The role of water is both as a reactant (Al–O–Al and Mo–O–Mo bond breaking) and as a ligand (Al(OH)6octahedron).
CHARACTERIZATION OF NI2+COORDINATION SPHERE IN THE PREPARATION OF A Ni/Al2O3CATALYST: THE IMPORTANCE OF UV–VIS SPECTROSCOPY
Ni/Al2O3catalysts used in hydrogenation processes are usually prepared by incipient wetness impreg- nation of alumina with an aqueous solution of Ni(II) nitrate. However, thermal treatments applied to the wet system in order to eliminate water and NO3–ions trigger the progressive migration of Ni2+ions into the alumina lattice, where they are lost for reduction by hydrogen if the aim is to form Ni0metal parti- cles [39,40]. To avoid this problem, chelating diamines have been introduced in the impregnating solu- tion as ligands to Ni2+, leading to complexes whose nature can be investigated by UV–vis spectroscopy;
Fig. 5 Time-resolved quantitative analysis of EXAFS and Raman spectra presented in Fig. 4: Mo coordination number (NMo–Mo) determined by EXAFS and integrated area (A) ratio of Raman bands at 816 and 947 cm–1 (A816/A947).
thanks to the stability of the chelates formed, the moment when the nickel cation associates with the support surface (i.e., grafts on it) is delayed [41]. Moreover, diamines and nitrates can decompose by reacting one with the other in an inert gas atmosphere; it is thus not necessary to use air for the thermal treatment, in which the formation of nickel aluminate is unavoidable. Finally, Ni0metal particles can be obtained directly during thermal treatment in inert gas, provided that some hydrogen is subsequently released upon diamines decomposition. This is what happens with acyclic diamines such as cyclohexa- nediamine; but their complexes with Ni(II) are not very soluble, which is a problem to prepare catalysts with high nickel content. On the other hand, thermal oxidation by nitrates of the more soluble Ni(II) complexes containing 2 equiv of ethylenediamine (NH2CH2CH2NH2, en) is complete, so that no hy- drogen is released; it is not possible to obtain Ni0particles by this method.
Experimental details
It was thus decided to impregnate alumina with an aqueous solution containing the nitrate of a complex richer in ethylenediamine, [Ni(en)3]2+[42]. The precursor salt [Ni(en)3](NO3)2was synthesized by ad- dition of 3 equiv of en in a solution of Ni(II) nitrate, followed by evaporation of water and recrystal- lization; the impregnation solution was subsequently prepared by dissolution in water of the precursor salt at a concentration chosen to reach a nickel content of 1.5 wt % in the final Ni0/Al2O3catalyst (0.38 mol L–1) (for more details concerning the preparation, see [41]). The wet system was dried in air in a static oven up to 100 °C and thermally treated in a helium atmosphere up to 500 °C (heating rate:
7.5 °C min–1, flow rate: 50 mL min–1, 1 h at 500 °C). The solid obtained after that thermal treatment was studied by temperature-programmed reduction (TPR) (5 % H2in Ar (25 mL min–1), hydrogen con- sumption measured using a thermal conductivity detector, from room temperature to 1000 °C with a heating rate of 7.5 °C min–1). It showed that 50 % of the nickel could still be reduced by hydrogen at 500 °C. In other words, only 50 % of the nickel were still present as ions on the alumina surface. In contrast with the experiment carried out with 2 equiv of en ligands, some reduction had occurred dur- ing thermal treatment.
Another experiment was carried out following the same procedure, except that the pH of the im- pregnating solution was raised from 8.5 to 11 by addition of concentrated NH3. After thermal treatment in helium, the reduction degree was even higher, since only 30 % of the nickel were still present as ions.
Characterization of the Ni2+coordination sphere with UV–vis spectroscopy
In order to understand the differences between the two experiments, the transformations of Ni2+coor- dination sphere during the catalyst preparation have been studied by use of in situ UV–vis spectroscopy.
Spectra were recorded with a resolution of 1 nm in the reflectance mode on a Cary 5 spectrometer (Varian) equipped with a high-temperature environmental cell (Spectratech) and using BaSO4powder as reference.
Ni2+complexes exhibit three transitions in the UV–vis region: in octahedral symmetry, 3A2g→
3T1g(P), 3A2g→3T1g(F), and 3A2g→3T2g, ranked by decreasing energy (or increasing wavelength).
Their position depends primarily on symmetry: the crystal field is lower for tetrahedral complexes than for octahedral complexes, hence a strong bathochromic shift when the symmetry changes from Ohto Td. In a given symmetry, it also depends on the strength of the crystal field generated by the ligands:
the lower the average field generated by the ligands, the lower the energy absorbed and the higher the wavelength. σ-Donor amine groups –NH2generate a stronger crystal field than σ-donor H2O, itself generating a stronger field than σ- and π-donor oxide anions from alumina surface.
After drying at 20 °C, the two samples prepared from [Ni(en)3](NO3)2solutions at different pH give the expected absorptions for [Ni(en)3]2+(Fig. 6). During drying at higher temperatures (70 and 100 °C) and subsequent thermal treatment in helium between 100 and 200 °C, the bands observed for the sample prepared without addition of NH3shift considerably to higher wavelengths. It can also be seen that the 3A2g→3T1g(F) band around 600 nm is split into several components in the 140–180 °C range, indicating that various species coexist on the surface or that the symmetry of the initially octa- hedral complexes is distorted. At 200 °C, the positions of the bands correspond to transitions much
lower in energy than in [Ni(en)3]2+. The decrease in ∆o, roughly calculated from the position of the
3A2g→3T2gtransition (∆o= 1/λ), is close to 1900 cm–1, compared to ~ 700 cm–1when two –NH2 groups are replaced by two H2O ligands ([Ni(en)2(H2O)2]2+), and 1100 cm–1when they are replaced by two AlO–groups ([Ni(en)2(OAl)2]) [41]. Besides, [Ni(en)(H2O)2(OAl)2] can be discarded because it would have been dehydrated at lower temperatures. The absorptions measured are thus not attributed to mere ligands substitutions, but to the existence of the tetrahedral species described as [Ni(NH2CH2CH2NH3+)2(OAl)2], formed during thermal treatment of supported [Ni(en)2(H2O)2]2+, and in which each en ligand is bonded to nickel by one end only, the protonated end interacting with the alumina surface (Fig. 7). This means that during the heating steps, a major fraction of nickel com- plexes has released 1 equiv of en and grafted onto the support surface, before the two ligands still bonded to Ni2+start interacting with alumina. Elemental analysis shows that 0.5 equiv of en ligand per Ni2+ion remains deposited as such on alumina at 230 °C; it is likely that this fraction of ligands plays a role in the fact that hydrogen is subsequently produced.
The answer about this role is given by the study of the sample prepared with the solution at pH 11. The spectrum of the complex obtained after thermal treatment at 230 °C is not that of [Ni(enH+)2(OAl)2], but the one observed for octahedral [Ni(en)2(OAl)2], corresponding to the grafting of [Ni(en)2(H2O)2]2+on alumina (Fig. 7) [41]. In that case, 1 equiv of en has also dissociated from Ni2+, but the four ends of the two other en ligands remain bonded to Ni(II). Since this correlates with a higher degree of nickel reduction, coming from a higher release of hydrogen, we can assume that the active hydrogen is the one produced by dehydrogenation of the coordinated –CH2NH2ends. The reason why coordinated diamines are able to release hydrogen, unlike when 2 equiv of ligands are used, comes from the fact that nitrates are diverted from oxidizing the coordinated ligands by scavenging the diamines de- Fig. 6 Lower figure: evolution of UV–vis spectra obtained in situ for the Ni sample prepared at pH 8.5, during drying in static air (20 to 100 °C) and thermal treatment in a helium flow (140 to 200 °C); upper figure: UV–vis spectrum obtained in situ for the Ni sample prepared at pH 11 in a helium flow at 230 °C.
posited on the alumina surface. In situ UV–vis spectroscopy not only allows identifying supported species that would not be stable in ambient conditions, but also gives hints into possible mechanisms that account for the final state of the catalyst.
QUANTITATIVE CHARACTERIZATION OF COBALT SPECIATION IN A Co2+/ZSM5 CATALYST: A CROSS-INVESTIGATION USING XRD, TPR, AND XANES
UV–vis spectroscopy is of less interest when one of the species present in the catalytic system domi- nates the absorption spectrum and makes the detection of other species impossible. This is the case of black Co3O4, as seen here for a Co2+/zeolite ZSM5 catalyst prepared by solid-state exchange in stoi- chiometric conditions, from cobalt chloride and H-ZSM5 (Co/H = Co/Al = 0.5, final Co wt % = 1.6) [43]. The aim of the synthesis is to substitute two protons from the zeolite by one Co2+ion in order to obtain isolated cations inside the channels, that could act as active sites for, e.g., hydrocarbons am- moxidation reactions [44]. But cobalt speciation on heterogeneous catalysts depends much on the preparation conditions [45], and it is likely that various species coexist on the surface and need to be quantified separately.
Experimental details
This catalyst was synthesized as follows [46]: the solid-state exchange was performed from a mixture of the precursor salt and of the zeolite (Si/Al = 26) as powders, up to 500 °C (heating rate: 2 °C min–1, flow rate: 25 mL min–1) and overnight at that temperature. The resulting solid was washed three times in order to eliminate weakly interacting cobalt species, dried at 120 °C in a static oven, and finally heated in oxygen up to 500 °C for a brief calcination treatment (heating rate: 5 °C min–1, flow rate:
25 mL min–1) as a way to eliminate adsorbed water.
Surface speciation with XRD and TPR
The presence of Co3O4in the catalyst is revealed on the X-ray diffractogram (Fig. 8a) by its most in- tense peak corresponding to the (311) reflection, among the reflections given by the zeolite lattice (Siemens D500 diffractometer, using Cu Kαradiation (1.5418 Å)). XRD provides information about the existence of crystalline domains, but is silent on the nature of dispersed or less organized species.
Since the electron absorption spectrum shows mostly broad bands given by cobalt oxide, other tech- niques must be used to identify the dispersed species.
As a routine technique, TPR allows us to rank the various types of oxidic or ionic species ac- cording to their lower or higher reactivity toward hydrogen during a temperature ramp. Bulk-like Co3O4 particles are reduced in the lower temperature range (340 °C here, Fig. 8b), at the temperature of re- duction of the unsupported oxide, while dispersed species are reduced in the higher temperature range.
Precisely, a reduction peak is detected at 640 °C: it is attributed in the literature to cobalt oxidic species Fig. 7 Possible structures of the complexes detected at 200 °C on the catalyst prepared without addition of NH3 (a), and at 230 °C on the catalyst prepared with addition of NH3(b).
Fig. 8 (a) X-ray diffractogram of the Co2+/ZSM5 catalyst; (b) TPR thermogram; (c) normalized XANES spectra of the Co2+/ZSM5 catalyst, and reference compounds, Co3O4and Co2+ions/ZSM5; (d) comparison between the Co2+/ZSM5 catalyst XANES spectrum and the simulation based on a 0.14 weight of Co3O4and 0.86 weight of Co2+ions signal.
of low nuclearity inside the zeolite, and that we will note (CoOx)nfollowing [47]. However, the use of TPR for the characterization of such systems is limited by three factors:
• Some smaller peaks such as the one seen around 500 °C cannot be ascribed to one species with certainty.
• The integration of the peaks leads to the consumption in hydrogen, but one should know the stoi- chiometry of reduction of the cobalt species by H2to Co0to be able to quantify them; the mean oxidation state of cobalt in Co3O4is known, but can be questioned in (CoOx)n.
• Finally, isolated Co2+ions inside the zeolite are not reduced below 950 °C [48], and TPR does not allow one to quantify them; integration of the peaks detected below 950 °C shows that at best only 39 % of the cobalt species have been reduced, meaning that TPR is silent about the major- ity of the cobalt species.
Quantification of different Co species: XANES spectroscopy
In spite of its easy implementation, TPR cannot be trusted alone for a quantitative study of cobalt spe- ciation in this catalyst. A technique based on absorption—to take advantage of the proportionality be- tween absorbance and concentration—and sensitive to all cobalt atoms is necessary for a cross-investi- gation: this choice technique is XAS that we use in transmission at the Co K edge, limited to the near-edge zone (XANES).
XANES-normalized spectra presented on Fig. 8c have been recorded in transmission at the LURE (Orsay) on line D42 in ambient conditions (Si(311) monochromator, energies were scanned in 0.3 eV steps from 7680 to 7830 eV). A comparison between the catalyst spectrum and those of two references (Co2+ions/ZSM5 prepared by liquid ion exchange from cobalt nitrate, and Co3O4) shows that the main contribution in the catalyst comes from Co2+ions, whether in oligomeric species or isolated. However, the catalyst spectrum is slightly shifted toward higher energies compared with that of the Co2+refer- ence, which indicates a higher average oxidation state of cobalt due to the presence of Co3O4as a minor compound.
Figure 8d shows the good agreement reached by a simulation based on a linear combination of the reference spectra with the experimental spectrum. According to this simulation, the catalyst con- tains 86 molar % of Co2+ions, the 14 % remaining being located inside Co3O4particles. A compari- son of this result with the quantification obtained from TPR peaks integration leads to the conclusion that only the first H2consumption peak must be ascribed to the reduction of cobalt in mixed-valence oxide Co3O4, i.e., in the bulk-like particles detected by XRD (corresponding indeed to 16 % of the total cobalt if a H2/Co = 1.33 stoichiometry is used for calculations). Cobalt in the more dispersed species (CoOx)nrevealed by the reduction peak at 640 °C should contain only Co2+ions and be named (CoO)n. They represent 23 % of total cobalt, while exchanged isolated Co2+cations, which were the sought-for active species, but about which TPR was silent, amount to 63 % of total cobalt. All three techniques were necessary to identify and quantify the three types of cobalt-containing species present in the cat- alyst.
CONCLUSION
Selected systems of practical catalytic importance (alumina-supported Mo and Ni catalysts as well as Co2+/ZSM5) have been chosen in this contribution in order to show the importance, benefit, but also limitations of spectroscopic and physical techniques commonly used for the characterization of catalyst preparation (Raman, XANES-EXAFS, UV–vis, TPR and XRD).
The characterization of alumina-supported Mo catalysts aims at showing the complementary na- ture of EXAFS and Raman, which are both molecular-scale spectroscopies. It is shown that while both techniques have similar potentials in determining the state of a given element (coordination number, ox- idation state as well as dispersion), a major improvement may be achieved by combining their results.
In line with this, an example of a combined use (i.e., simultaneously, on the same materials, in the same
environment) of EXAFS and Raman is given for Mo supported on silica-alumina supports. Raman is much more sensitive than EXAFS toward slight changes in Mo speciation, while EXAFS makes a more quantitative analysis possible, both on dry and wet interfaces.
In situ UV–vis spectroscopy is shown to be very well suited for a thorough description of Ni(II) speciation during thermal activation of alumina-supported Ni catalysts. A detailed analysis of the band positions allows one to follow the fate of the inorganic (Ni(II)) and organic (ethylenediamine) partners of the catalyst precursor, [Ni(en)3]2+, leading to the understanding of reduction processes occurring in an inert atmosphere. At last, the benefit of combining XRD, TPR (a routine, but hardly quantitative, technique) with XANES (much less accessible but fully quantitative) is pointed out.
This selection of examples shows that a true molecular-scale understanding of catalyst prepara- tion (a definite prerequisite for a rational catalyst design) can only be achieved through combination of several characterization techniques adapted to the metallic precursor studied.
ACKNOWLEDGEMENT
J. M. Krafft and F. Villain are gratefully acknowledged for constant technical and scientific support in the Raman and EXAFS measurements, respectively. The combined EXAFS and Raman experiments were made possible by the precious contribution of V. Briois, C. Jubin, J. M. Krafft, and F. Villain.
Professor François Bozon-Verduraz (Université Paris VII, Denis Diderot) is thanked for providing ac- cess to the UV–vis–NIR spectrometer.
REFERENCES
1. G. Martino. Stud. Surf. Sci. Catal. 130, 83 (2000).
2. Handbook of Heterogeneous Catalysis, G. Ertl, H. Knözinger, J. Weitkamp, (Eds.), Wiley-VCH, Weinheim (1997).
3. J. M. Thomas, W. J. Thomas. Principles and Practice of Heterogeneous Catalysis, Wiley-VCH, Weinheim (1997).
4. J. M. Thomas. Angew. Chem., Int. Ed. 38, 3588 (1999).
5. J. F. Le Page. Catalyse de Contact, Technip, Paris (1978).
6. M. Che. Stud. Surf. Sci. Catal. 75A, 31 (1993).
7. M. Che. Stud. Surf. Sci. Catal. 130A, 115 (2000).
8. M. Che, L. Bonneviot. Pure Appl. Chem. 60, 1369 (1988).
9. D. M. Templeton, F. Ariese, R. Cornelis, L. G. Danielsson, H. Muntau, H. P. van Leeuwen, R.
Lobinski. Pure Appl. Chem. 72, 1453 (2000).
10. H. Knözinger. Catal. Today 32, 71 (1996).
11. M. A. Bañares. In In-Situ Spectroscopy of Catalysts, B. M. Weckhuysen (Ed.), p. 59, American Scientific Publ., Stevenson Ranch (2004).
12. M. A. Bañares, I. E. Wachs. J. Raman Spectrosc. 33, 359 (2002).
13. G. Mestl. J. Mol. Catal. A 158, 45 (2000).
14. G. Mestl, T. K. K. Srinivasan. Catal. Rev.- Sci. Eng. 40, 451 (1998).
15. I. E. Wachs. Catal. Today 27, 437 (1996).
16. D. Bazin, J. Lynch, M. Ramos-Fernandez. Oil Gas Sci. Technol. 6, 667 (2003).
17. J. A. van Bokhoven, T. Ressler, F. M. F. de Groot, G. Knopp-Gericke. In In-situ Spectroscopy of Catalysts, B. M. Weckhuysen (Ed.), p. 123, American Scientific Publ., Stevenson Ranch, CA (2004).
18. K.-J. Chao, A. C. Wei. J. Electron Spectrosc. Relat. Phenom. 119, 175 (2001).
19. B. M. Weckhuysen. In In-situ Spectroscopy of Catalysts, B. M. Weckhuysen, (Ed.), p. 1, American Scientific Publ., Stevenson Ranch, CA (2005).
20. A. M. Beale, A. M. J. van der Eerden, K. Kervinen, M. A. Newton, B. M. Weckhuysen. Chem.
Commun. 3015 (2005).
21. C. Papadopoulou, J. Vakros, H. K. Matralis, C. Kordulis, A. Lycourghiotis. J. Colloid Interface Sci. 261, 146 (2003).
22. X. Carrier, J. F. Lambert, S. Kuba, H. Knözinger, M. Che. J. Mol. Struct. 656, 231 (2003).
23. X. Carrier, J. F. Lambert, M. Che. Stud. Surf. Sci. Catal. 121, 311 (1999).
24. (a) A. Michalowicz. J. Phys. IV 7, 235 (1997); (b) S. I. Zabinsky, J. J. Rehr, A. Ankudinov, R. C.
Albers, M. J. Eller. Phys. Rev. B 52, 2995 (1995).
25. H. Y. Lee, K. M. Park, U. Lee, H. Ichida. Acta Crystallogr., Sect. C 47, 1959 (1991).
26. M. T. Pope. Heteropoly and Isopoly Oxometalates, Springer-Verlag, Berlin (1983).
27. R. Prins, D. C. Koningsberger. In X-ray Absorption: Principles, Applications, Techniques of EXAFS, SEXAFS and XANES, D. C. Koningsberger, R. Prins, (Eds.), p. 321, John Wiley, New York (1988).
28. B. S. Clausen, B. Lengeler, H. Topsoe. Polyhedron 5, 199 (1986).
29. R. G. Leliveld, A. J. van Dillen, J. W. Geus, D. C. Koningsberger. J. Catal. 165, 184 (1997).
30. G. Plazenet, E. Payen, J. Lynch, B. Rebours. J. Phys. Chem. B 106, 7013 (2002).
31. H. T. Evans, B. M. Gatehouse, P. Leverett. J. Chem. Soc., Dalton Trans. 6, 505 (1975).
32. L. Le Bihan, P. Blanchard, M. Fournier, J. Grimblot, E. Payen. J. Chem. Soc., Faraday Trans. 94, 937 (1998).
33. X. Carrier, J. F. Lambert, M. Che. J. Am. Chem. Soc. 119, 10137 (1997).
34. G. Kisfaludi, J. Leyrer, H. Knözinger, R. Prins. J. Catal. 130, 192 (1991).
35. W. Shi, X. Cai, J. Wei, J. Ma, T. Hu, N. Wu, Y. Xie. Surf. Interface Anal. 32, 202 (2001).
36. N. S. Chiu, S. H. Bauer, M. F. L. Johnson. J. Catal. 89, 226 (1984).
37. C. Calais, N. Matsubayashi, C. Geantet, Y. Yoshimura, H. Shimada, A. Nishijima, M. Lacroix, M.
Breysse. J. Catal. 174, 130 (1998).
38. V. Briois, S. Belin, F. Villain, F. Bouamrane, H. Lucas, R. Lescouezec, M. Julve, M. Verdaguer, M. S. Tokumoto, C. V. Santilli, S. H. Pulcinelli, X. Carrier, J. M. Krafft, C. Jubin, M. Che. Phys.
Scr., T 115, 38 (2005).
39. J. M. Rynkowski, T. Paryjczak, M. Lenik. Appl. Catal., A 106, 73 (1993).
40. J. Zielinsky. J. Catal. 76, 157 (1982).
41. F. Négrier, E. Marceau, M. Che, J. M. Giraudon, L. Gengembre, A. Löfberg. J. Phys. Chem. B 109, 2836 (2005).
42. F. Négrier. Ph.D. dissertation, Université Pierre et Marie Curie, Paris (2002).
43. M. Mhamdi. Ph.D. dissertation, Université de Tunis II–El Manar, Tunis (2004).
44. Y. Li, J. N. Armor. Appl. Catal., A 188, 211 (1999).
45. K. Bourikas, C. Kordulis, J. Vakros, A. Lycourghiotis. Adv. Colloid Interface Sci. 110, 97 (2004).
46. M. Mhamdi, E. Marceau, S. Khaddar-Zine, A. Ghorbel, M. Che, Y. Ben Taarit, F. Villain. Z. Phys.
Chem. 219, 963 (2005).
47. R. S. da Cruz, A. J. S. Mascarenhas, H. M. C. Andrade. Appl. Catal., B 18, 223 (1998).
48. X. Wang, H. Y. Chen, W. M. H. Sachtler. Appl. Catal., B 26, L227 (2000).
![Fig. 2 Raman spectra in ambient conditions of (a) AHM (solid state), (b) AHM in aqueous solution ([Mo] = 0.1 M, pH = 5.1), (c) freeze-dried Mo/Al 2 O 3 , (d) AlMo 6 (solid state), and (e) aged Mo/Al 2 O 3 .](https://thumb-eu.123doks.com/thumbv2/1library_info/5129178.1658775/5.810.100.710.691.975/raman-spectra-ambient-conditions-solid-aqueous-solution-freeze.webp)