1
Titel der Arbeit:
ACOUSTIC COMMUNICATION, SEXUAL SELECTION, AND SPECIATION IN FIELD CRICKETS
Dissertation
zur Erlangung des akademischen Grades:
Doctor rerum naturalium (Dr. rer. nat.)
eingereicht an der Lebenswissenschaftlichen Fakultät der Humboldt-Universität zu Berlin von:
Thomas Blankers
Präsident der Humboldt-Universität zu Berlin:
Prof. Dr. Jan-Hendrik Olbertz
Dekan der Lebenswissenschaftlichen Fakultät der Humboldt-Universität zu Berlin : Prof. Dr. Richard Lucius
Gutachter/innen:
1. Prof R. Matthias Hennig 2. Prof Michael G. Ritchie
3. Prof Kerry L. Shaw Tag der mündlichen Prüfung:
20. Mai 2016
2
3
TABLE OF CONTENTS
CHAPTER 1 5
GENERALINTRODUCTION
CHAPTER 2 13
CONSERVATIONOFMULTIVARIATEFEMALEPREFERENCEFUNCTIONSANDPREFERENCE MECHANISMSINTHREESPECIESOFTRILLINGFIELDCRICKETS
CHAPTER 3 31
PHENOTYPICVARIATIONANDCOVARIATIONINDICATEHIGHEVOLVABILITYOFACOUSTIC COMMUNICATIONINCRICKETS
CHAPTER 4 53
CONTRASTINGSEXUALSELECTIONREGIMESDRIVEINTERSPECIFICDIVERGENCEINTHE PHENOTYPICVARIANCE-COVARIANCEMATRIXOFANACOUSTICMATINGSIGNAL
CHAPTER 5 73
THEEVOLUTIONARYHISTORYOFTWOSYMPATRICCRICKETSPECIESWITHDIVERGENT MATINGSIGNALS:GENETICDIVERGENCEANDTHEROLEOFGENEFLOWANDSEXUAL SELECTIONINSPECIATION
CHAPTER 6 103
GENERALDISCUSSION
ABSTRACT 113
ZUSAMMENFASSUNG 117
SELBSTÄNDIGKEITSERKLÄRUNG 120
ACKNOWLEDGEMENTS 121
4
5
CHAPTER 1
GENERAL INTRODUCTION
6
“The case of the male Argus pheasant is eminently interesting, because it affords good evidence that the most refined beauty may serve as a sexual charm, and for no other purpose”
Charles Darwin – The Descent of Man, and Selection in Relation to Sex, 1871
The diversity in sexual displays and behaviours, among species as well as between the two sexes of a single species, is truly fascinating. Striking ornamentation such as display feathers in birds and horns and weaponry in mammals, intriguingly complex courtship rituals seen in exotic birds, and the overwhelming choruses of acoustic insects and frogs calling for mates testify to the fundamental role of sexual advertisement in the life and times of animals everywhere. Almost a century and a half since Darwin’s second famous book (1871) where he introduced his concept of sexual selection, we have greatly advanced our understanding of how and why sexual signals are so diverse (e.g. Andersson 1994).
However, the role of sexual selection in establishing the primary reproductive barriers between populations and thus driving speciation has hitherto remained a topic of active debate (Fisher 1930, Dobzhanksy 1940, West-Eberhard 1983, Andersson 1994, Panhuis et al. 2001, Ritchie 2007, Servedio 2015).
Variation in sexually selected traits is directly linked to mating success and thus predisposed to drive reproductive isolation between populations that differ in sexual traits and corresponding mate preferences. Until the early 1980s the role of sexual selection in establishing reproductive barriers and instigating speciation was problematic conceptually because it was unclear how sexual selection could establish and maintain reproductive isolation between closely related species (Ritchie 2007). Following the influential work by Fisher (1930), Lande (1980, 1981), and West-Eberhard (1983) species recognition and sexual selection were reconciled giving rise to a conceptual model for (arbitrary) trait- preference co-evolution and speciation by sexual selection. Since then, empirical evidence supporting a strong role for sexual selection in facilitating speciation has accumulated for a wide range of taxa (Arbuthnott 2009, Kraaijeveld et al. 2011).
However, there are still many challenges to a comprehensive synthesis of sexual selection and speciation. One of the biggest conundrums concerns the case where populations are geographically overlapping and/or exchange migrants. Parapatric or sympatric speciation was once thought to be rare and unlikely, but the contemporary view is that speciation frequently unfolds in the face of gene flow (Bolnick & Fitzpatrick 2007, Bird et al. 2012). At the same time, theoretical research predicts that sexual selection has only very limited or potential adverse effects on speciation when individuals migrate readily between diverging populations (van Doorn et al. 2004, Weissing et al. 2011, Servedio 2015). This is in strong contrast to observations for several species rich radiations where divergence rates are estimated to be extremely high among geographically overlapping species that have parted primarily in mating behaviour (e.g. cichlid fish: Seehausen 2000, Wagner et al. 2012; swordtail crickets: Mendelson &
Shaw 2005).
Whether or not currently sympatric species have at some point exchanged genetic material is often unclear. Thus, one of the main challenges towards understanding the role of sexual selection in speciation is determining how gene flow affects interspecific genomic variation in sexually divergent species and whether genomic regions harbouring loci involved in mating behaviour are less homogenic between species compared to other regions (Feder et al. 2013, Sousa & Hey 2013). A second challenge is determining how mate choice drives variation among individuals within species. Mate choice can be a purely aesthetic and arbitrary process (Darwin 1871, Fisher 1930, Lande 1981) in which case a strong association between the genetic architecture of traits and preferences (to allow for trait-preference co- evolution) is expected. Alternatively, sexual traits are used by the choosing sex to gain information on the vigour and fitness of the sender (Wallace 1895, Zahavi 1975, Hamilton & Zuk 1982).
We thus need to unravel the genetic architecture of signals and preferences and examine the genomic ramifications of the evolution of reproductive isolation between sexually divergent, ecologically similar, and geographically proximate taxa. This first requires a profound understanding of the behavioural basis of mate choice and quantitative genetic insights in the evolution of signals and preferences (i.e. the extent to which preferences match signals, the genomic distribution and location of
7
the loci controlling preference and signal variation, and the selection response constraining phenotypic evolution). Second, to understand the role of sexual signals in speciation we must unravel the evolutionary historical context in which they evolved. Few study systems allow for such a broad and comprehensive assessment of the behavioural, quantitative genetics, and genomic implications of sexual selection and sexual signal evolution.
Crickets (Orthoptera: Gryllidae) are at the forefront of neurobiological, evolutionary, and behavioural research and are a model system for acoustic communication (Greenfield 2002, Gerhardt &
Huber 2002). The most widely studied field cricket genera (Gryllus, Laupala, and Teleogryllus) have been used to unravel neuronal mechanisms of signal production and evaluation (e.g. Bennet-Clark 2003, Hedwig & Poulet 2004, Hennig et al. 2004, Schöneich and Hedwig 2012, Schöneich et al. 2015), to study the evolution of mating behaviour (e.g. Simmons 2004, Gray 2011), and to inform the genetic architecture of sexual signals and corresponding preferences (e.g. Hoy 1974, Shaw et al. 2007). Closely related species of crickets often occur sympatrically and are morphologically and ecologically cryptic, but show strong differentiation in the male acoustic mating signals and corresponding female preferences (Alexander 1962, Otte 1992, Otte 1994) Recently, genomic and transcriptomic resources for several species of field crickets and other orthopterans have become available (e.g. Andres et al. 2013, Bailey et al. 2013 Berdan et al. 2015, Berdan et al. in review). Thus, a substantial amount of neurological, behavioural, and genetic resources combined with geographically dense distributions of closely related species and nonetheless strongly divergent acoustic mating signals render crickets an ideal system for the study of mate choice behaviour, genetic control of sexual signals, and the role of divergence in mating behaviour in speciation.
In this thesis I examine acoustic sexual communication in North-American field crickets (Gryllus). Using a combination of behavioural, quantitative genetics, and genomic approaches, this thesis aims at (1) understanding the evolution of the calling song in crickets and the role of song traits in reproductive isolation, and (2) unravelling the contribution of demography, gene flow, and (sexual) selection to genome-wide patterns of genetic divergence during speciation. Furthermore, this thesis provides insight in multivariate phenotypic evolution and the mechanistic basis of acoustic behaviour in field crickets. Below I will briefly introduce these two topics.
Phenotypic evolution and spherical cows
Phenotypic and genetic distributions of biological traits are multivariate and thus form a complex trait space. This space is described by the orthogonal phenotypic dimensions in which traits vary. Because these dimensions consist of combinations of traits (which are thus correlated) and are not of equal variance, we cannot assume that the trait space is spherical: the evolution of a single trait can only be understood when the variation in other traits that covary with the focal trait are taken into account (Lande 1979, Lande & Arnold 1983).
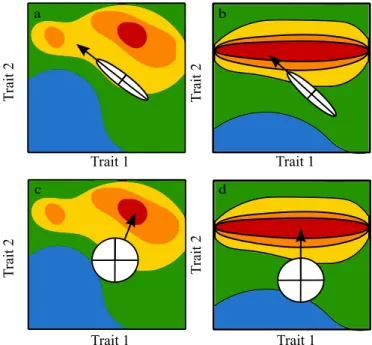
If two traits are strongly correlated and the greatest phenotypic dimension of variation does not align with the direction of selection the response to selection can be biased away from the selection optimum (Steppan 2002, Blows 2007; Fig. 1a). This is commonly referred to as an evolutionary constraint on selection. When only one of two traits is under selection, a strong correlation between the traits will result in indirect selection acting on the trait that is not under selection (Fig. 1b). Despite a comprehensive framework developed by Lande and Arnold (Lande 1979, Lande & Arnold 1983) and advances in analytical tools (e.g. Aguirre et al. 2014) many studies of quantitative phenotypic evolution largely ignore the genetic constraints and pleiotropic effects that can result from covariance among traits. This will strongly overestimate the selection response (Fig. 1a versus Fig. 1c) or neglect the effects of indirect selection (Fig. 1b versus Fig. 1d).
8
Figure 1 Multivariate response to selection (adapted from Steppan et al. 2002). The white ellipse represents a strong correlation between two traits in a population in such a way that the response to selection is constrained (a). Due to the patterns of covariation, the population in (a) cannot evolve towards the fitness optimum in the top-right corner. In (b), the fitness peak is much broader because trait 1 is not under selection directly. The population can respond to selection acting on trait 2, but due to the strong correlation between trait 1 and 2, the traits will covary in response to this selection and trait 1 will be dragged along by indirect selection. In (c) and (d) the covariance is effectively zero (spherical) and the selection response is neither constrained nor results in indirect selection.
The multivariate phenotype and the additive genetic (co)variation for multivariate traits are described by the phenotypic and genetic variance-covariance matrix, denoted P and G, respectively.
These are symmetric n x n matrices with the variances of the n traits on the diagonal and the covariance between each trait pair in the off-diagonal matrix elements. Both P and G are vital to the mathematical description of evolution and are used to study genetic constraints, pleiotropy, phenotypic plasticity, and predict the evolutionary response to natural and sexual selection (Lande 1979, Lande & Arnold 1983, Lynch & Walsh 1998).
Similar to morphological traits, sexual signals like the calling song of crickets are often multicomponent (Scheuber et al. 2004, Hebets & Papaj 2005, Higham & Hebets 2013). Despite the caveats to univariate examinations of sexual signal evolution (Blows 2007), a comprehensive overview of multivariate divergence in sexual signals is missing and our understanding is limited to insights from only a handful of studies (e.g., Blows et al. 2004, Bentsen et al. 2006, Bertram et al. 2011). This thesis provides a detailed examination of interspecific divergence in multivariate song phenotypes across several cricket species as well as in hybrids between species. Simultaneously the song preference space is explored in a multivariate context to gain insight into the dimensionality and strength of sexual selection. One of the powerful features of studying sexual signalling behaviour in crickets is that these results can be coupled with several decades’ worth of neuro-ethological insights into the mechanisms of song production and song perception which are discussed briefly below.
Acoustic mate choice in crickets
Cricket males produce songs by rubbing their forewings (i.e. stridulation). With each closing movement of the wing, the plectrum or scraper of one of the wings (typically the left wing) excites the stridulatory teeth of the file on the bottom of the other wing. The number of excitations of the teeth and the size and resonant properties of the wing (i.e. the harp) determine the carrier frequency (i.e. the pitch) of the song; the temporal parameters of the song (i.e. pulse and chirp rhythm) are determined by the rate and number of opening and closing movements of the wing (reviewed in Gerhardt & Huber 2002). In this thesis I will frequently discriminate between two song types: trilled songs, which are long trains of pulses (the convention is >20 pulses, Alexander 1962) irregularly interspaced with pauses, and chirped
9
songs, which are more regular groups of between 3 and 10 pulses. Throughout this thesis, species producing trills and species producing chirps will be referred to as ‘trillers’ and ‘chirpers’, respectively.
The central nervous system governs both the activation and patterning of the acoustic signals (reviewed in Gerhardt & Huber 2002). Chemical (i.e. by injecting acetylcholine [ACh] or gamma- aminobutyric acid [GABA]) or electrical stimulation of specific locations in the brain elicit or inhibit calling (and courtship/aggressive) song production. The excitatory regions are concentrated in the protocerebrum and adjacent to the mushroom body. The fine-scale temporal properties of the song depend on neuronal networks called pattern generators that control the movement of stridulatory organs. Neuromuscular properties and intrinsic properties of the muscles affect the temporal rhythm of the song. Movement of the wings for the purpose of both flight and stridulation involve, at least in part, the same muscles and motor neurons, but stridulation and flight are controlled by distinct neuronal networks (Hennig 1990). Although the neuronal control of song productions is hardwired early on in development, likely as early as during the final stages of embryogenesis, neurogenesis is continuous throughout the life of crickets (Cayre et al. 1994).
Acoustic signals are processed by females first in the auditory periphery, where the mechanical properties of the ear (tympanum) determine the sensitivity to a specific carrier frequency (Gerhardt &
Huber 2002). A neuronal representation of the stimulus is then passed on to the central auditory pathway, where a complex network of ascending neurons and local brain neurons with varying filter properties is used in evaluation of the sound signal (Gerhardt & Huber 2002, Hennig et al. 2014, Schöneich et al. 2015).
Female crickets respond to the male song and move towards the sound source (phonotaxis) either in mid-air or while walking. A single pulse is sufficient to induce steering behaviour in female crickets (Hedwig & Poulet 2004), but integration of the sensory output over longer timescales determines the direction in which they walk or fly. Preferences are usually finely tuned to conspecific songs and combining the information from multiple traits is expected to facilitate accurate discrimination against heterospecifics. However, preference functions for specific song traits can also differ in shape, i.e. a function can be open-ended (‘linear’ preference) or closed or unimodal (‘concave’
preference). The shape of the preference function depends on the filter properties of the neurons of the auditory pathway and is potentially related to the information a trait conveys (i.e. ‘essential’ versus
‘motivational’ traits [Popov & Shuvalov 1976] or ‘static’ versus ‘dynamic’ traits [Gerhardt 1991]).
Aims
The aims of this thesis are twofold. First, intra- and interspecific variation in songs and preferences are analysed to provide insight into the role of song traits in mate choice and in the evolution of reproductive isolation. Chapter 2 elucidates the preference mechanisms for acoustic communication in three trilling field crickets and elaborates on the role of song traits in sexual communication; Chapter 3 and 4 focus on the evolvability (sensu lato) of the song by disentangling the genetic architecture and comparing multivariate song divergence to female preference behaviour. Second, genome-wide nucleotide polymorphism data from two closely related and sympatrically occurring species will be used to discuss patterns of genetic variation and footprints of selection in an evolutionary historical context (Chapter 5). In the general discussion (Chapter 6) I will then elaborate on the proximate basis and ultimate consequences of acoustic mate choice behaviour and on the role of sexual selection on speciation with gene flow.
REFERENCES
Arbuthnott, D. 2009. The genetic architecture of insect courtship behavior and premating isolation. Heredity. 103: 15–22.
Aguirre, J.D., Hine, E., McGuigan, K. & Blows, M.W. 2014. Comparing G: multivariate analysis of genetic variation in multiple populations. Heredity. 112: 21–9.
Alexander, R. 1962. Evolutionary change in cricket acoustical communication. Evolution 6: 443–467.
Andersson, M. 1994. Sexual Selection. Princeton University Press.
Andrés, J.A., Larson, E.L., Bogdanowicz, S.M. & Harrison, R.G. 2013. Patterns of transcriptome divergence in the male accessory gland of two closely related species of field crickets. Genetics 193: 501–513.
Bailey, N.W., Veltsos, P., Tan, Y.F., Millar, A.H., Ritchie, M.G. & Simmons, L.W. 2013. Tissue-specific transcriptomics in the field cricket Teleogryllus oceanicus. G3 Genes|Genomes|Genetics 3: 225–230.
Bennet-Clark, H.C. 2003. Wing resonances in the Australian field cricket Teleogryllus oceanicus. J. Exp. Biol. 206: 1479–96.
10
Bentsen, C.L., Hunt, J., Jennions, M.D. & Brooks, R. 2006. Complex multivariate sexual selection on male acoustic signaling in a wild population of Teleogryllus commodus. Am. Nat. 167: E102–E116.
Berdan, E.L., Blankers, T., Waurick, I., Mazzoni, C.J. & Mayer, F. in Review. A genes eye view of ontogeny: De novo assembly and profiling of a Gryllus rubens transcriptome. Mol. Ecol. Resour.
Berdan, E.L., Mazzoni, C.J., Waurick, I., Roehr, J.T. & Mayer, F. 2015. A population genomic scan in Chorthippus grasshoppers unveils previously unknown phenotypic divergence. Mol. Ecol. 24: 3918–30.
Bertram, S.M., Fitzsimmons, L.P., McAuley, E.M., Rundle, H.D. & Gorelick, R. 2011. Phenotypic covariance structure and its divergence for acoustic mate attraction signals among four cricket species. Ecol. Evol. 2: 181–195.
Bird, C.E., Fernandez-Silva, I., Skillings, D.J. & Toonen, R.J. 2012. Sympatric Speciation in the Post “Modern Synthesis” Era of Evolutionary Biology. Evol. Biol. 39: 158–180.
Blows, M.W. 2007. A tale of two matrices: multivariate approaches in evolutionary biology. J. Evol. Biol. 20: 1–8.
Blows, M.W., Chenoweth, S.F. & Hine, E. 2004. Orientation of the genetic variance-covariance matrix and the fitness surface for multiple male sexually selected traits. Am. Nat. 163: 329–340.
Bolnick, D.I. & Fitzpatrick, B.M. 2007. Sympatric Speciation : Models and Empirical Evidence. Annu. Rev. Ecol. Evol. Syst. 38:
459–487.
Cayre, M., Strambi, C. & Strambi, A. 1994. Neurogenesis in an adult insect brain and its hormonal control. Nature 368: 57–59.
Darwin, C. 1871. The Descent of man, and Selection in Relation to Sex. D. Appleton and Company, New York.
Dobzhansky, T. 1940. Speciation as a Stage in Evolutionary Divergence. Am. Nat. 74: 312.
Doorn, G.S. Van, Dieckmann, U. & Weissing, F.J. 2004. Sympatric Speciation by Sexual Selection : A Critical Reevaluation.
Am. Nat. 163: 709–725.
Feder, J.L., Flaxman, S.M., Egan, S.P., Comeault, A.A. & Nosil, P. 2013. Geographic Mode of Speciation and Genomic Divergence. Annu. Rev. Ecol. Evol. Syst. 44: 73–97.
Fisher, R. 1930. The genetical theory of natural selection. Oxford University Press, New York.
Gerhardt, H.C. 1991. Female choice in treefrogs: static and dynamic acoustic criteria. Anim. Behav. 42: 615–636.
Gerhardt, H.C. & Huber, F. 2002. Acoustic communication in insects and anurans. The University of Chicago Press, Chicago.
Gray, D.A. 2011. Speciation, divergence, and the origin of Gryllus rubens: behavior, morphology, and molecules. Insects 2: 195–
209.
Greenfield, M.D. 2002. Signalers and Receivers: Mechanisms and Evolution of Arthropod Communication. Oxford University Press, New York.
Hamilton, W. & Zuk, M. 1982. Heritable true fitness and bright birds: a role for parasites? Science (80-. ). 218: 384–387.
Hebets, E.A. & Papaj, D.R. 2005. Complex signal function: developing a framework of testable hypotheses. Behav. Ecol.
Sociobiol. 57: 197–214.
Hedwig, B. & Poulet, J.F. 2004. Complex auditory behaviour emerges from simple reactive steering. Nature 430: 781–785.
Hennig, R.M. 1990. Neuronal control of the forewings in two different behaviours: Stridulation and flight in the cricket, Teleogryllus commodus. J. Comp. Physiol. A 167: 617–627.
Hennig, R.M., Franz, A. & Stumpner, A. 2004. Processing of Auditory Information in Insects. Microsc. Res. Tech. 63: 351–374.
Higham, J.P. & Hebets, E.A. 2013. An introduction to multimodal communication. Behav. Ecol. Sociobiol. 67: 1381–1388.
Hoy, R.R. 1974. Genetic Control of Acoustic Behavior in Crickets. Am. Zool. 14: 1067–1080.
Kraaijeveld, K., Kraaijeveld-Smit, F.J.L. & Maan, M.E. 2011. Sexual selection and speciation: the comparative evidence revisited. Biol. Rev. 86: 367–377.
Lande, R. 1981. Models of speciation by sexual selection on polygenic traits. Proc. Natl. Acad. Sci. 78: 3721–3725.
Lande, R. 1979. Quantitative genetic analysis of multivariate evolution, applied to brain: body size allometry. Evolution 33: 402–
416.
Lande, R. 1980. The genetic covariances between characters maintained by pleiotropic mutations. Genetics 94: 203–215.
Lande, R. & Arnold, S.J. 1983. The measurement of selection on correlated characters. Evolution 37: 1210–1226.
Lynch, M. & Walsh, B. 1998. Genetics and analysis of quantitative Traits. Sinauer, Sunderland, MA.
Mendelson, T.C. & Shaw, K.L. 2005. Rapid speciation in an arthropod. Nature 433: 375–376.
Otte, D. 1992. Evolution of cricket songs. J. Orthoptera Res. 1: 25–49.
Otte, D. 1994. The Crickets of Hawaii: Origin, Systematics, and Evolution. Orthoptera Society/Academy of Natural Sciences of Philadelphia, Philadelphia, PA.
Panhuis, T.M., Butlin, R., Zuk, M. & Tregenza, T. 2001. Sexual selection and speciation. Trends Ecol. Evol. 16: 364–371.
Popov, A. V. & Shuvalov, V.F. 1977. Phonotactic behavior of crickets. J. Comp. Physiol. A 119: 111–126.
Prum, R.O. 2012. Aesthetic evolution by mate choice: Darwin’s really dangerous idea. Philos. Trans. R. Soc. B Biol. Sci. 367:
2253–2265.
Ritchie, M.G. 2007. Sexual Selection and Speciation. Annu. Rev. Ecol. Evol. Syst. 38: 79–102.
Servedio, M.R. 2015. Geography, assortative mating, and the effects of sexual selection on speciation with gene flow. Evol.
Appl. doi: 10.1111/eva.12296.
Scheuber, H., Jacot, A. & Brinkhof, M.W. 2004. Female preference for multiple condition-dependent components of a sexually selected signal. Proc Biol Sci 271: 2453–2457.
Schöneich, S. & Hedwig, B. 2012. Cellular basis for singing motor pattern generation in the field cricket (Gryllus bimaculatus DeGeer). Brain Behav. 2: 707–725.
Schoneich, S., Kostarakos, K. & Hedwig, B. 2015. An auditory feature detection circuit for sound pattern recognition. Sci. Adv.
1: e1500325–e1500325.
Seehausen, O. 2000. Explosive speciation rates and unusual species richness in haplochromine cichlid fishes: effects of sexual selection. Adv. Ecol. Res. 31: 237–274.
Shaw, K.L., Parsons, Y.M. & Lesnick, S.C. 2007. QTL analysis of a rapidly evolving speciation phenotype in the Hawaiian cricket Laupala. Mol. Ecol. 16: 2879–2892.
Simmons, L.W. 2004. Genotypic variation in calling song and female preferences of the field cricket Teleogryllus oceanicus.
Anim. Behav. 68: 313–322.
Sousa, V. & Hey, J. 2013. Understanding the origin of species with genome-scale data : modelling gene flow. Nature 14: 404–
414.
11
Steppan, S.J., Phillips, P.C. & Houle, D. 2002. Comparative quantitative genetics: evolution of the G matrix. Trends Ecol. Evol.
17: 320–327.
Wagner, C.E., Harmon, L.J. & Seehausen, O. 2012. Ecological opportunity and sexual selection together predict adaptive radiation. Nature 487: 366–369.
Wallace, A.R. 1895. Natural selection and tropical nature: Essays on descriptive and theoretical biology. Macmillan, London.
Weissing, F.J., Edelaar, P. & van Doorn, G.S. 2011. Adaptive speciation theory: a conceptual review. Behav. Ecol. Sociobiol. 65:
461–480.
West-Eberhard, M.J. 1983. Sexual selection, social competition, and speciation. Q. Rev. Biol. 58: 155–183.
Zahavi, A. 1975. Mate selection—A selection for a handicap. J. Theor. Biol. 53: 205–214.
12
13
CHAPTER 2
CONSERVATION OF MULTIVARIATE FEMALE PREFERENCE FUNCTIONS AND PREFERENCE MECHANISMS IN THREE SPECIES
OF TRILLING FIELD CRICKETS
Based on: Blankers, T, Hennig RM. Gray DA. 2015. Conservation of multivariate female preference functions and preference mechanisms in three species of trilling field crickets. Journal of Evolutionary
Biology 28: 630-641.
14
Abstract. Divergence in mate recognition systems among closely related species is an important contributor to assortative mating and reproductive isolation. Here we examine divergence in male song traits and female preference functions in three cricket species with songs consisting of long trills. The shape of female preference functions appears to be mostly conserved across species and follows the predictions from a recent model for song recognition. Multivariate preference profiles, combining the pulse and trill parameters, demonstrate selectivity for conspecific pulse rates and high trill duty cycles.
The rules for integration across pulse and trill timescales were identical for all three species. Generally, we find greater divergence in male song traits than in associated female preferences. For pulse rate we find a strong match between divergent male traits and female peak preferences. Preference functions for trill parameters and carrier frequency are similar between species and show less congruence between signal and preference. Differences among traits in the degree of trait-preference (mis)match may reflect the strength of preferences and the potential for linkage disequilibrium, selective constraints, and alternative selective pressures, but appear unrelated to selection for species recognition per se.
15 INTRODUCTION
Divergence in sexual signal traits is thought to result from selection imposed by divergent mate preferences (Lande 1981; West-Eberhard 1983; Higashi et al. 1999) and co-evolution of signals and preferences helps maintain species specific communication (Gerhardt & Huber 2002; Greenfield 2002).
Therefore, male sexual signalling traits are expected to be closely congruent with female mating preferences (Rodriguez et al. 2006). However, the degree of congruence between signals and preferences is likely to vary (1) with the strength of those preferences (Rodriguez et al. 2006; Rodriguez et al. 2013), (2) with the specific genetic mechanisms that may link changes in signals with changes in preferences (Andersson & Simmons 2006; Chenoweth & Blows 2006), and (3) depending upon whether the preferences themselves are under selection because they lead to high quality matings (i.e. preferences for traits indicative of direct or indirect benefits) or are free to vary (i.e. preferences for arbitrary ‘Fisherian’
traits).
Because sexual signals are often multimodal and/or multicomponent (Scheuber et al. 2004;
Hebets & Papaj 2005; Higham & Hebets 2013), understanding the evolution of male signal traits and female preferences requires a multidimensional framework (Blows et al. 2003; Gerhardt & Brooks 2009).
Multivariate preference functions reflect the complexity of signal processing and allow different selection pressures on different traits to be compared (Bentsen et al. 2006; Gerhardt & Brooks 2009; Oh
& Shaw 2013). In addition to adopting a multivariate framework, researchers should strive to examine the neuro-physiological mechanisms underlying signal recognition and preference (Römer et al. 2002;
Bass & McKibben 2003; Fisher et al. 2005, Kostarakos & Hedwig 2012). This is critical for understanding the degree of mechanistic change required in order to produce species-level divergence.
That is, does the evolution of assortative mating require major changes to mechanisms of signal recognition, or are minor changes to the “tuning” of the same underlying preference mechanisms sufficient to facilitate divergence (Clemens & Hennig 2013; Hennig et al. 2014)? Here, we address this question by comparing the variation in the calling song, used by male crickets in long distance mate attraction (Alexander 1962), and corresponding female preferences between three species of field crickets.
Acoustic communication and song recognition in crickets
Cricket calling songs vary among species in two features: the carrier frequency and the temporal pattern of pulses and chirps/trills (long chirps exceeding 20 pulses, Alexander 1962, Weissman et al. 2009, Walker 2014). The temporal pattern of pulses and chirps/trills can be described by the duration, pause, period (or, inversely, rate) and duty cycle (Fig. 1a). Female crickets are known to evaluate carrier frequency and varying combinations of the parameters governing the temporal pattern of a song over short and long timescales (Popov & Shuvalov 1977, Doherty 1985, Grobe et al. 2012). In this study we will refer to the evaluation of song parameters, or, matching of the signal with an internal, neuronal template as ‘song recognition’ or ‘signal recognition’. A recent model of song recognition in crickets suggests that females evaluate the song signal with a short, innate template that responds best to a particular pulse parameter (e.g. pulse rate). The output of this pulse detector is then integrated (i.e., the accumulation of sensory evidence for decision making, Gold & Shadlen 2007) over a given time window (Clemens & Hennig 2013, Hennig et al. 2014). The model predicts that (1) females evaluate the temporal pattern of the pulses, (2) following integration of the pulse detector output, female preference is independent of the temporal pattern of the trill, i.e. depends only on the duty cycle (equivalent to song energy over time), and (3) a trill pattern without a pulse rate modulation (i.e., continuous tones at a repetition rate equivalent to the trill rate) is ineffective in eliciting a positive female response.
16
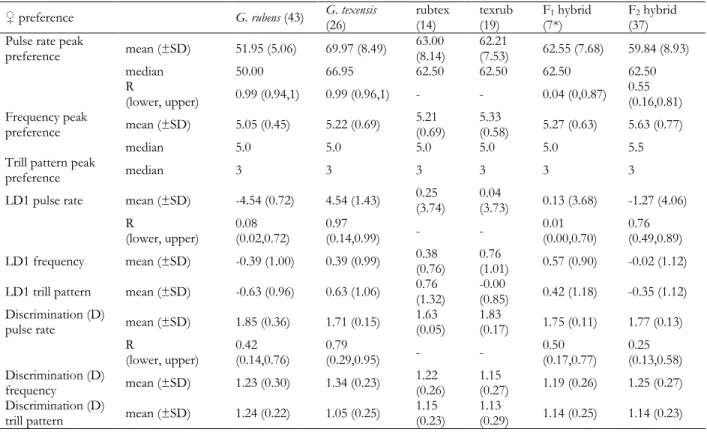
Figure 1 Signals for long distance mate attraction in crickets. A schematic overview of the typical structure of the calling song of G. rubens, G. texensis, and G#14 is given in (a), along with a definition of all temporal song parameters discussed in this study. In (b) and (c) bivariate plots constrained by trill duty cycle and trill rate, and carrier frequency and pulse rate, respectively, show the intra- and interspecific variation in the calling song. In (d) variation along the first two linear discriminants (LD1 and LD2) is shown. The coefficients of the variables on the linear discriminants and the proportion of the trace can be found in Table 1. Song recordings from 40 G. rubens (blue), 37 G. texensis (red), and 24 G#14 (green) males were analysed.
Here we adopt a comparative mechanistic approach to investigate whether these three predictions hold in three species of Gryllus field crickets that produce long trills (hypothesis 1) and whether interspecific divergence in the multivariate female preference functions is manifested on both timescales and in the spectral content of the song (i.e., carrier frequency; hypothesis 2). We then examine the degree of mismatch between signals and preferences (hypothesis 3) and interpret our results in comparison with other cricket species, and in light of the putative mechanisms that influence the degree of mismatch between male signals and female preferences.
We characterized preference functions of three trilling species of crickets in the genus Gryllus:
G. rubens Scudder 1902, G. texensis Cade & Otte 2000, and an undescribed species which we refer to here as ‘G#14’. The former two species are partially sympatric sister species (Gray et al. 2008; Gray 2011).
Gryllus rubens ranges across the south-eastern USA and southern gulf states to eastern Texas; G. texensis ranges from central Texas across the southern gulf states to western Florida; G#14 has a limited distribution in central Arizona apparently disjunct from populations further south in Mexico. G#14 is entirely allopatric with respect to G. rubens and G. texensis. It is not currently clear if G#14 is sister to either species or not. All three species produce long trills, in strong contrast with the short chirps found in most Gryllus species.
METHODS
Collecting and rearing
Gryllus texensis were collected in Austin (TX), Lancaster (TX) and Round Rock (TX); G. rubens were collected in Gainesville (FL), Lake City (FL), and Live Oak (FL); G#14 were collected in Agua Fria National Monument (AZ). The crickets were housed in 19L containers at an average temperature of 25.3 oC (+/- 2.73 SD) with gravel, shelter, and water and food ad libitum. Males and females were separated before reaching sexual maturity and acoustically isolated during the experimental period.
Second generation laboratory offspring was used in the experiments.
Male song recording and analysis
Individuals were placed in separate boxes (mean temperature 24.9 oC +/- 0.98 SD) for a 16-24 hour period. Each box was equipped with a microphone and isolating foam to ensure acoustic isolation.
Using customized software (LabVIEW, 2007), each microphone (TCM 141 Conrad) was scanned for 800 ms and a male was recorded for 20 seconds if it produced sound during that 800 ms interval. The dominant carrier frequency was determined from the spectral peak of the real time signal. For analysis of the temporal pattern, the normalized envelope of the song signal was computed after signal rectification by squaring and low-pass filtering at 200 Hz (equivalent to a temporal resolution of 2.5 ms).
Temporal parameters such as pulse and pause duration were calculated when the envelope crossed or fell below a threshold value at 10 - 15% of the signal envelope. Individual mean values were based on at least two 10 second windows, typically containing around 400 pulses and 2-10 trills each, from two different recordings.
17 Female preference functions
Female preference was tested using a trackball system similar to that used by Hedwig and Poulet (2004).
Females, mounted to a metal rod, were placed on a hollow Styrofoam sphere (diameter: 100 mm, weight: 1.2 to 1.8 g) supported by an air stream between two perpendicularly placed loudspeakers (Piezo Horntweeter PH8) in a wooden box with sound absorbing foam. Each loudspeaker was calibrated with a Bruel and Kjaer 2231 sound level meter and a half-inch condenser microphone (Bruel and Kjaer 4133 relative to 2 x 10⁻⁵ Pa, fast reading) at the top of the sphere where the female cricket was placed during experiments.
Digitally stored signals were transmitted from a hard disk by a D/A-board (update rate: 100.000 kHz, PCI 6221, National Instruments, Texas) to a digitally controlled attenuator (PA5, Tucker-Davis, Florida), amplified (Raveland, Conrad Electronics) and broadcast through the speakers. The longitudinal and lateral movements of the sphere were recorded by either a single optical sensor (Agilent ADNS- 2051) at the bottom of the half-sphere or by two sensors (ADNS-5050, Avago Technologies) with a focussing lens positioned laterally at an angle of 90 degrees.
A silent control was used to monitor baseline activity and a continuous tone was used to control for motivation and selectivity of female responses. At the beginning and the end of each test session, a species-specific, attractive song signal was presented to control for possible changes in phonotactic motivation during a session. For each test signal, the lateral deviation of a female during signal presentation for each of the two speakers was averaged and normalized with respect to the attractive control signal. The resulting phonotactic scores were therefore typically between 0 (no orientation towards the sound signal) and 1 (strong orientation towards the signal), although negative scores (orientation away from the signal) and scores higher than 1 (orientation towards signal stronger compared to control stimulus) were possible.
Test signals and controls were presented at 80 dB sound pressure level (SPL). The responses of 8 to 30 females per species were evaluated for each test pattern (for sample sizes per test see figure captions). All tests included the four control stimuli (silent, continuous tone, and an attractive stimulus at the beginning and end of a test) and eight test stimuli (total duration was 29 minutes per test), and were performed at 24°C-26°C.
Statistical analyses
All statistical analyses were performed in R 2.15.1 (R Core Team 2012). A linear discriminant analysis (MASS package, Venables & Ripley 2002) was used to separate males in multivariate space. Within- species coefficients of variation (CV) and intra-class correlation coefficients were calculated to examine variability of traits within and between species. The intra-class correlation coefficient (ICC) between males of the same species was calculated using the ICCbare function from the ICC package (Wolak et al.
2012) and indicates the amount of variation partitioned within rather than between groups (in this case species).
First, we tested on which combination of temporal traits female preferences were dependent and whether this dependence was linear or nonlinear by using a linear regression model including linear and polynomial terms (hypothesis 1). The regression curves were fitted using the lm function from the Stats package and the model with the best fit was selected using Akaike’s information Criterion (AIC, Akaike 1973).
Second, we tested whether the general features of song recognition were conserved across species (hypothesis 2). We compared the individual-level peak preferences (most attractive stimulus for each individual) for carrier frequency using Mann-Whitney U tests. The relative weight of preferences for the pulse and the trill timescale and a bivariate preference space constrained by pulse rate and duty cycle were compared between the species. Third, the strength of trait-preference mismatch for pulse rate and duty cycle, carrier frequency, and trill duty cycle was assessed for each species (hypothesis 3).
To this end, a population-level peak preference was determined. Instead of simply taking the highest preferred stimulus, we quantified which stimuli were not statistically different from the highest preferred stimulus. This way, peak preference could be calculated as the average of all stimuli that elicit a very high response, rather than by a single stimulus that elicited a slightly higher response than similarly attractive stimuli by chance (and might stochastically bias peak preference away from or closer to the male mean).
Pairwise t-tests were performed to compare the response for the highest preferred stimulus with the response for the stimulus with the second highest preference, followed by comparing the response for the latter stimulus with that for the stimulus with third highest preference, and so on, until the P-value associated with the t-test was lower than a Bonferroni-corrected significance level (α = 0.05). The peak preference was either the most attractive stimulus or the average of the most attractive stimuli that were not significantly different from each other. Mismatch was then calculated as the mean of the male signal
18
minus the peak preference, divided by the mean of the male signal means (grand mean). Therefore, mismatch was scaled to allow for comparison between song traits differing in magnitude. Negative mismatch indicated a lower value for the mean of the male signal compared to the preference.
RESULTS
Male song divergence
The majority of song parameters differed among species, but pulse rate and carrier frequency were most divergent (Table 1; Fig. 1d). Pulse rate alone was sufficient to discriminate among species, but the discriminative potential strongly increased when trill rate and carrier frequency were also considered (Fig. 1b,c). The variation in carrier frequency and pulse parameters was mostly partitioned between species (low CVs and high ICCs); the exception being pulse duty cycle, which was similar between species. For trill parameters, more variation was partitioned within species rather than among (higher CVs and lower ICCs); the exception being a high ICC for trill rate and low CV for trill duty cycle (Table 1).
Table 1 Male song variation and the potential for species discrimination. The mean, standard deviation (SD) and coefficient of variation (CV = SD/mean) of the carrier frequency, and of the period, rate, duration, pause duration, and duty cycle at both pulse and trill timescales are shown. Additionally, the intra-class correlation coefficient (ICC) and the coefficients of the first and second linear discriminants (LD1 and LD2, proportion of trace in parentheses) for the parameters included in the linear discriminant analysis are given.
Preference functions: carrier frequency
Preferences for carrier frequencies between 2.5 and 7 kHz were tested using stimuli with a constant, attractive temporal pattern. First, we compared the responses to these stimuli between species by examining the shape and peak of the preference functions (hypothesis 2). No species-specific tuning of the preference functions to a particular frequency was found (Fig. 2a). Rather, all three species responded well to signals with carrier frequencies from 4.5 to 6 kHz (Fig. 2a). No significant differences in individual-level peak preference were found between G. rubens and G. texensis (W29 = 208; P = 0.912) and between G. rubens and G#14 (W12 = 146, P = 0.1738). Peak preference was slightly but significantly higher for G#14 compared to G. texensis (5.3 vs. 5.0 kHz; W12 = 72, P = 0.0134).
Second, we examined the congruence between the range of variation in the males and the optimum and width of the preference functions (hypothesis 3). The carrier frequency of male songs was restricted to a smaller range and located below the peak of the female preference (Table 1, Fig. 2a). The strength of mismatch between population-level peak preferences and the male signal varied between 0.04 for G. texensis and -0.20 for G#14 (Table 3). The divergence in the male signal was not mirrored by female preference (Fig. 2a).
G. rubens n=40 G. texensis n=37 G#14 n=24
Mean + SD, CV Mean + SD, CV Mean + SD, CV ICC LD1
(0.823) LD2 (0.124) Frequency
(kHz) 4.7 + 0.2, 0.04 5.2 + 0.2, 0.04 4.5 + 0.1, 0.03 0.766 0.654 0.328 Pulse
period (ms) 21.3 + 1.6, 0.08 16.9 + 1.1, 0.06 26.5 + 1.7, 0.06 0.899
rate (s-1) 47.3 + 3.6, 0.08 59.3 + 3.6, 0.06 38.0 + 2.0, 0.05 0.904 2.205 -1.557 duration (ms) 9.0 + 1.6, 0.17 7.1 + 1.0, 0.14 11.9 + 1.6, 0.13 0.715
pause (ms) 12.3 + 2.3, 0.18 9.9 + 1.3, 0.13 14.6 + 1.5, 0.10 0.596
duty cycle 0.43 + 0.08, 0.19 0.43 + 0.06, 0.14 0.45 + 0.05, 0.11 0.012 -0.218 0.337 Trill
period (s) 4.1 + 1.8, 0.45 1.1 + 0.4, 0.38 2.5 + 0.8, 0.33 0.605
rate (s-1) 0.31 + 0.17, 0.54 1.08 + 0.31, 0.28 0.49 + 0.14, 0.29 0.784 0.277 1.647 duration (s) 3.2 + 1.6, 0.50 0.7 + 0.3, 0.46 1.7 + 0.7, 0.44 0.579
pause (s) 0.92 + 0.83, 0.90 0.36 + 0.20, 0.46 0.79 + 0.29, 0.37 0.193
duty cycle 0.76 + 0.13, 0.17 0.63 + 0.12, 0.19 0.66 + 0.07, 0.11 0.298 -0.150 -0.282
19
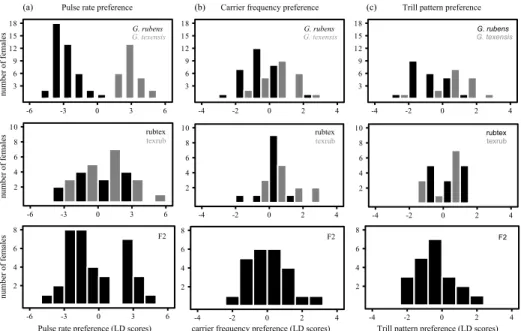
Figure 2 Female preferences for variation of spectral and temporal song traits. The preference functions are based on the average responses to test patterns that vary in the trait shown on the x-axis. Colours are as in Fig. 1. Error bars show the standard error. The black, dashed lines represent a phonotactic score of zero. The boxes (1st and 3th quantile and median) and whiskers (full range) show variation in the male signal. (a) The preference functions for carrier frequency (n = 29 for G. rubens and G. texensis¸ and n = 12 for G#14). (b) The preference curves for pulse rate (additional test performed at constant duty cycle
= 0.5; n = 82, 31, 8). The curves for pulse duty cycle in (c) result from diagonal transects taken from the pulse profile from upper left to lower right in Fig. 3a-c (n=20, 14, 9) at approximately constant pulse rate (G. rubens: 54.5 pps; G. texensis: 72.5 pps;
G#14: 29.9 pps). The curves in (d) and (e) represent diagonal transects across the trill profile in Fig. 3d-f (n = 16, 14, 14) taken at approximately constant trill duty cycle (G. rubens: >0.74; G. texensis: >0.72; G#14: >0.65) or trill rate (G. rubens: 1.45 tps; G.
texensis: 1.29 tps; G#14: 1.02 tps), respectively.
Preference functions: bivariate pulse profiles and peak pulse rate preferences
Responses to variation in pulse pattern were tested using bivariate pulse tests. This bivariate preference space is constrained by 16 combinations of pause and pulse durations (Fig. 3a-c). Along a diagonal line across one of the panels in Fig. 3a-c, either the sum of pause and pulse duration is constant (from the top left to the bottom right corner) in which case the pulse duty cycle varies but not the pulse rate, or the ratio of pulse duration to pulse period remains constant (from the bottom left to the top right corner) in which case the pulse rate varies, but not the pulse duty cycle.
20
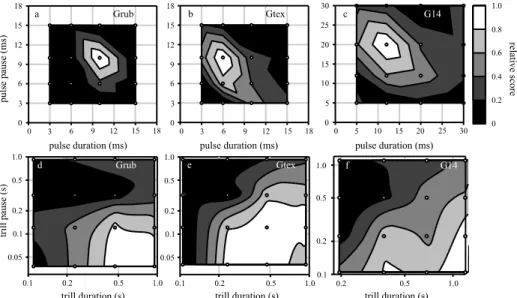
Figure 3 Preference functions for the pulse (a-c) and trill pattern (d-f). Within each panel, pulse and trill rates increase from upper right to lower left; pulse and trill duty cycles increase from upper left to lower right. Note the differences in scale between (a, b) and (c) and between (d, e) and (f). The grayscale indicates the differences in relative scores as per the legend to the right of (c). Scores were normalized with respect to the response to the most attractive stimulus for each species. The contour plots show the preference space obtained using Delaunay triangulation and linear interpolation using the TriScatteredInterp function in MATLAB. The small white circles represent the 16 test points (stimuli). Sample sizes are as in Fig. 2c for the pulse profile plots (top three panels), and as in Fig. 2d, e for the trill profile plots (bottom three panels).
First we examined the features for song recognition to test for the relevant temporal parameters of the pulse pattern (hypothesis 1). All three species had a single most attractive test pattern (Fig. 3a-c).
The range of preferred song patterns was constrained by a small range of pulse rates across a wide range of pulse duty cycles (from top left to bottom right) rather than by a small range of pulse duty cycles across a wide range of pulse rates. However, this pulse rate dependency was weaker for G. rubens (Fig.
3a). We performed a linear regression on the preference for all 16 test points (dependent variable) shown in Fig. 3a-c. A model including quadratic terms for pulse rate, pulse duty cycle, and their interaction had the best fit according to the AIC score (Table 2). The coefficients of the quadratic terms for both pulse rate and duty cycle were significant (Table S1).
Second, we looked for differences between the species (hypothesis 2). The shape of the preference function was similar between species, but they differed in the range of preferred pulse rates (Fig. 3a-c). In addition to the bivariate pulse profile tests, we also conducted a univariate test varying the pulse rate at a constant pulse duty cycle of 0.5. The purpose of this univariate test was to examine species differences and compare the male signal and female preference at a higher resolution. All three species showed unimodal, sharply tuned preference functions (Fig. 2b). The univariate preference function for pulse duty cycle, which is derived from the bivariate pulse test by taking a cross section along a diagonal with constant pulse rate, was similar between species and centred at low to intermediate values, corresponding to the male signal (Fig. 2c). For pulse rate, the strength of mismatch between population-level peak preference and the male signal (hypothesis 3) varied between -0.06 (G.
rubens) and -0.16 (G. texensis). For pulse duty cycle the strength of mismatch ranged from 0.09 for G#14 to -0.32 for G. texensis (Table 3).
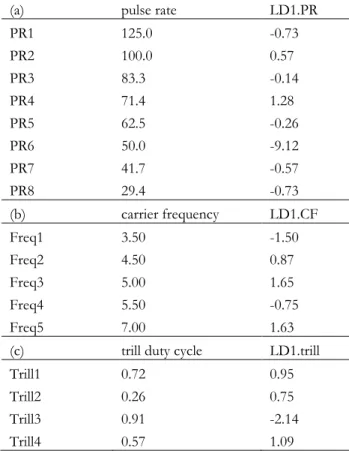
Table 2 AIC based model selection for the pulse and trill preference tests (Fig. 3). Four different linear models were tested including (1) only linear terms for pulse/trill rate and pulse/trill duty cycle and their interaction (“linear”), (2) a quadratic term for rate and a linear term for duty cycle and their interaction [“(rate)2”], (3) a linear term for rate and a quadratic term for duty cycle and their interaction [“(duty cycle)2”], or (4) only quadratic terms and their interaction (“quadratic”). The lowest AIC score is in bold face type and for the corresponding model the summary statistics are shown to the right.
Models Model with lowest AIC
species timescale linear (rate)2 (duty
cycle)2 quadratic R2 F-statistic P-value G. rubens pulse 204.79 210.18 208.09 201.19 0.11 F8,183 =3.856 0.0003
trill 102.66 108.90 106.34 115.01 0.17 F3,108 =7.286 0.0001 G. texensis pulse 100.93 94.64 107.63 75.78 0.31 F8,103 =7.117 < 0.0001
trill 141.73 144.67 149.97 157.23 0.19 F3,156 =13.19 < 0.0001 G#14 pulse 227.40 218.63 226.55 216.33 0.14 F8,215 =5.706 < 0.0001 trill 445.85 457.00 456.10 468.36 0.30 F3,284 =41.48 < 0.0001
21
Preference functions: bivariate trill profiles and linear selection on trill duty cycle
Similar to the analysis of the preference for parameters of the pulse pattern, we conducted two bivariate tests for trill preferences with 16 combinations of trill duration and pause (Fig. 3d-f). Here too we first examined the features for song recognition to test the predictions based on the model for song recognition (hypothesis 1). The observed preference spaces in Fig. 3d-f indicated that females responded well to a range of different trill durations as long as the pause between trills was shorter than the trill duration. This is equivalent to a response to songs with a high trill duty cycle. At very low trill rates, higher duty cycles (bottom left in Fig. 3d-f) also yielded low responses. We compared several models for the relationship between the preference for a stimulus (dependent variable) and different combinations of linear and quadratic terms for trill rate and trill duty cycle (independent variables). We found that a linear term for trill rate and trill duty cycle and an interaction term of the two yielded the lowest AIC (Table 2). However, only the trill duty cycle term was significant (Table S2). The linear model confirms the pattern observed in Fig. 3d-f: trill duty cycle is the main cue for the attractiveness of the long timescale.
To examine the divergence in the preference functions for the trill pattern (hypothesis 2) we compared preferences in bivariate space (Fig. 3d-f) as well as unidimensional representations of these data (Fig. 2d-e).The preference functions in Fig. 2d-e correspond to cross sections across the contour plots in Fig. 3d-f. Females of all three species preferred faster trill rates and higher trill duty cycles than males tended to produce, and the shapes of the preference functions were similar, especially for G.
rubens and G#14 (Fig. 2d-e, Fig. 3d-f). Gryllus texensis females discriminated against the highest trill duty cycles and showed a broader preference function favouring higher trill rates than the other species (Fig.
3e). There was considerable mismatch between the male signal and female preferences for trill duty cycle (ranging from -0.36 for G. texensis to -0.2 for G#14, Table 3). However, the range of variation in trill duty cycle in males overlapped with the range of trill duty cycles preferred by the females (Fig. 2e).
22
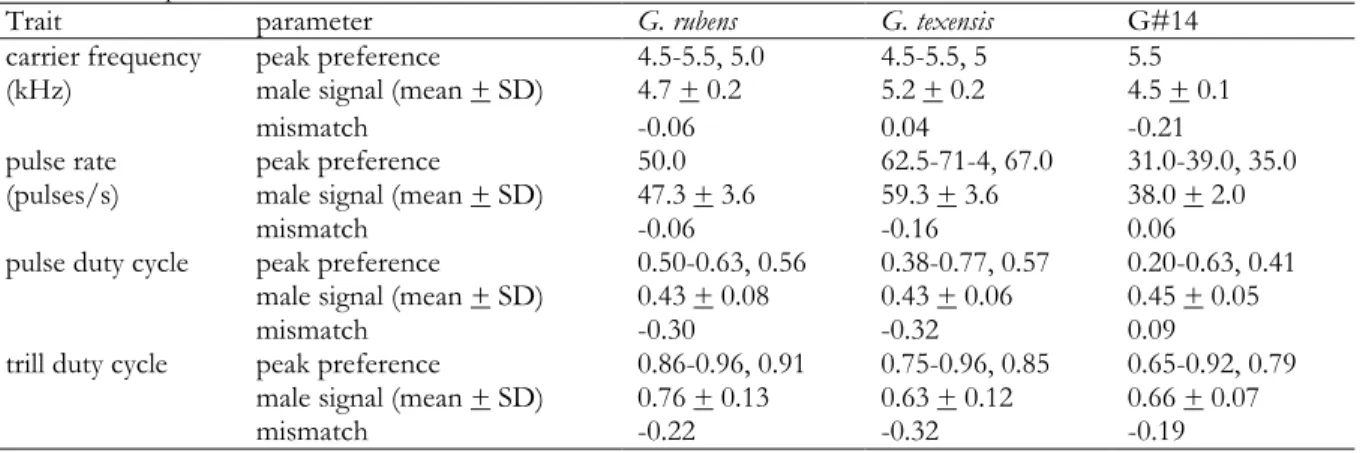
Table 3 Trait-preference mismatch. Peak preference (range, mean) was calculated as the average of the stimuli for which we measured significantly higher phonotactic scores than the next highest stimulus. Mismatch was calculated as the mean of the male signal minus the peak preference divided by the mean of the male signal means (grand mean). The male signal means are shown for comparison.
Trait parameter G. rubens G. texensis G#14
carrier frequency
(kHz) peak preference 4.5-5.5, 5.0 4.5-5.5, 5 5.5
male signal (mean + SD) 4.7 + 0.2 5.2 + 0.2 4.5 + 0.1
mismatch -0.06 0.04 -0.21
pulse rate
(pulses/s) peak preference 50.0 62.5-71-4, 67.0 31.0-39.0, 35.0
male signal (mean + SD) 47.3 + 3.6 59.3 + 3.6 38.0 + 2.0
mismatch -0.06 -0.16 0.06
pulse duty cycle peak preference 0.50-0.63, 0.56 0.38-0.77, 0.57 0.20-0.63, 0.41 male signal (mean + SD) 0.43 + 0.08 0.43 + 0.06 0.45 + 0.05
mismatch -0.30 -0.32 0.09
trill duty cycle peak preference 0.86-0.96, 0.91 0.75-0.96, 0.85 0.65-0.92, 0.79 male signal (mean + SD) 0.76 + 0.13 0.63 + 0.12 0.66 + 0.07
mismatch -0.22 -0.32 -0.19
Preference functions: integration of pulse and trill timescales
Template matching on the short timescale for features of the pulse pattern should be independent of the overall trill pattern of the song (Clemens & Hennig 2013). The trill pattern on the other hand, should, in the absence of modulation by pulses at conspecific pulse rates, not result in positive phonotaxis (hypothesis 1). To test this prediction for our data, a series of tests were conducted to measure the relative weight of the pulse and trill pattern. Stimuli were presented as trains of pulses (with a constant duty cycle of 0.5) without trill modulation (i.e., continuous trains of pulses with no trill pause, corresponding to a trill duty cycle of 1). At very low pulse rates (i.e., longer pulse durations and pauses) the pulses represented trills without any pulse structure (i.e., pure continuous tones, followed by a pause with an equivalent duration). Any increased response at these low rates would indicate an important role for the trill timescale in song recognition bypassing any template operating on the pulse timescale. None of the species showed a response at low rates corresponding to conspecific trill rates without pulse modulation (Fig. 4) nor did they respond to long, continuous tones as used as a negative control (see Methods). However, the responses to species-specific pulse rates without any trill modulation were as strong as seen in Fig. 2b for all three species.
23
Figure 4 Integration of short and long timescales. The curves show responses to continuous trains of pulses varying in the rate from 0.33 pulses per second to a rate of 167 pulses per second at constant duty cycle of 0.5. Corresponding pulse durations ranged from 1500 ms to 3 ms. In (a) a schematic representation of three test patterns played back to the females is shown (top).
Error bars represent standard error, the dashed line shows a phonotactic score of zero, and the box-and-whiskers show the median, 1st and 3rd quantile, and range of male pulse and trill rate [(a): n= 20, (b): n= 16, (c): n = 9].
Song recognition
The results from the previous tests (pulse pattern, trill pattern, and weighing of the timescales) suggest that song recognition was primarily dependent on pulse rate and trill duty cycle and interspecific differences in preference functions were mostly manifested in different peak preferences for pulse rate.
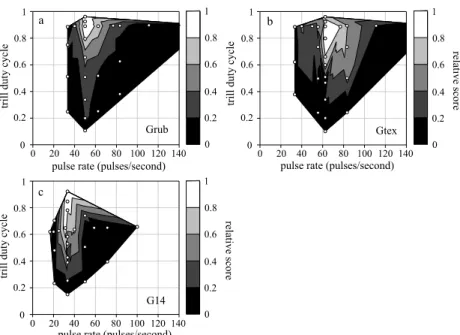
To visualize each of the three species in the proper parameter space (i.e., defined by pulse rate and trill duty cycle) the results from both bivariate profile tests (Fig. 3) were combined. Additionally, data from another test with eight unique combinations of trill duty cycle and pulse rate complemented the parameter space for song recognition (Fig. 5). The three species showed divergent preferences for pulse rate with little to no overlap. Gryllus rubens responded only to very high trill duty cycles (>0.75), whereas G#14 and G. texensis also responded well to lower duty cycles (>0.6). Gryllus texensis females also showed a reduced response to the highest duty cycle (~0.96)
24
Figure 5 Illustration of the preference space constrained by trill duty cycle and pulse rate. The interpolation was done using the same algorithm as in Fig. 3 and included the test points for both the pulse and trill pattern tests in Fig. 3, as well as an additional test encompassing stimuli with other combinations of pulse rates and trill duty cycle [for the latter test: n=12 (a), n=13 (b), n=8 (c)]. Scores were normalized with respect to the response score for the most attractive stimulus in each species.
The test patterns are displayed in the contour plots as white points, with the patterns for the pulse test (Fig. 3a-c) at constant trill duty cycle (i.e., along a horizontal line), the patterns for the trill test (Fig. 3e-f) at constant pulse rate (i.e., along a vertical line) and the patterns from the additional test outside either the horizontal or vertical array of points.
DISCUSSION
Female preference in three trilling Gryllus species was primarily constrained by pulse rate and trill duty cycle, the latter of which was largely independent of temporal measures such as trill rate (hypothesis 1).
Between species we found a shift in the peak preference for pulse rate, small differences between trill duty cycle preferences, and no divergence in any other preference functions (hypothesis 2). Pulse rate also revealed the strongest degree of congruence between the male signal and female preference; for pulse duty cycle, carrier frequency and trill duty cycle we observed mismatch (hypothesis 3).
Conservation of preferences and underlying mechanisms
Preference for a high trill duty cycle discriminates against males producing songs with short chirps or trills separated by longer pauses, i.e. song patterns with a low to intermediate chirp/trill duty cycle. From a computational point of view, the observed selectivity follows the recently proposed, general scheme of song pattern recognition in crickets (Clemens & Hennig 2013). The tympanic ear of crickets constitutes an initial, peripheral filter for the carrier frequency (Gerhardt & Huber 2002) and generates a neuronal representation of the received stimulus. Then, the song pattern is first compared to a short template for evaluation of the pulse pattern. The result of this sensory computation is manifested here as the pulse rate preference of females (Fig. 2b, 3a-c). Second, the output of this sensory filter at the pulse timescale is integrated over a longer time window. The observed preference of females for high trill duty cycles and the rejection of low trill duty cycles (Fig. 2e, Fig. 3e-f) correspond to such an integration process that does not evaluate the specific timing of pulses or trills. Rather, females respond stronger with increasing song energy over time, equivalent to an increase in trill duty cycle (Clemens & Hennig 2013).
Mechanistically, the computational components for the evaluation of calling songs with long trills appear to be the most basic and parsimonious required: a simple pulse rate detector combined with a linear preference for high trill duty cycles (Fig. 5a-c). Song recognition by crickets with short chirps would similarly require a detector for the pulse pattern followed by integration of that detector’s output over time. However, additional selectivity for intermediate chirp rates and chirp duty cycles (Hennig 2009; Grobe et al. 2012; Rothbart & Hennig 2012) needs additional computational components (Hennig et al. 2014). Because trills are considered ancestral in Gryllidae (Alexander 1962), the data from the present study suggest that these species’ preference functions are also of an ancestral type, although perhaps representing a reversal to an ancestral type within Gryllus (Desutter-Grandcolas & Robillard 2003).