Research Collection
Journal Article
Provisional assignment of the G blood-group locus to chromosome 15 in swine
Gene mapping in swine using natural and induced marker chromosomes
Author(s):
Fries, R.; Stranzinger, G.; Vögeli, P.
Publication Date:
1983
Permanent Link:
https://doi.org/10.3929/ethz-b-000422816
Originally published in:
Journal of heredity 74(6), http://doi.org/10.1093/oxfordjournals.jhered.a109830
Rights / License:
In Copyright - Non-Commercial Use Permitted
This page was generated automatically upon download from the ETH Zurich Research Collection. For more
information please consult the Terms of use.
The Journal of Heredity 74:426-430. 1983.
Provisional assignment of the G
blood-group locus to chromosome 15 in swine
Gene mapping in swine using natural and induced marker chromosomes
ABSTRACT: Using the lod score test, 85 combinations of 19 biochemical and immunoge- netic markers and 7 natural and radiation-Induced chromosomal markers were checked with respect to linkage. Highly positive lod scores were obtained for the combination of the G blood-group locus with the rob (15; 17) centrlc-fuslon chromosome. Positive lod scores also were obtained for the G blood-group locus and the reciprocal translocation rep (2p+;15q—) marker chromosome. Thus, it was concluded that the locus for the G blood-group system may be on chromosome 15 of swine. For several combinations of markers it was possible to exclude linkage at certain recombination frequencies.
R. Fries G. Stranzinger P. Vogeli
The authors are affiliated with the Institute of Ani- mal Production, Animal Breeding Section, Federal Institute of Technology, Tannenstrasse I, CH-8092 Zurich, Switzerland. They thank the staff of the Animal Breeding Section for helpful assistance. They also thank Prof. J. Moustgaard and Dr. P. B. Nielsen of the Royal Veterinary and Agricultural University, Copenhagen, for providing the facilities to analyze a part of the blood samples in their department, Dr. D. A. Redmcr, and Dr.
L. D. Young for their help in translating, and Cheryl Yates for stenographic work. The study was financially supported by the ETH grant no. 5487/41-0735.5.
© 1983, American Genetic Association.
R E L A T I V E to the advanced knowledge of the order and chromosomal location of gene loci in man and some laboratory animal species, little is known about gene maps in farm ani- mals. Few gene mapping studies by family analyses and even fewer by somatic cell hy- bridization techniques have been reported13. The present gene map of swine consists of four linkage groups (detected by family analyses) and two syntenic groups (detected by somatic cell hybridization techniques). In 1964, Andresen and Baker7 found linkage between the C and J blood-group loci. Hruban et al.l 6 added the histocompatibility complex (SLA) locus to the C-J linkage group. An- dresen4"6, Andresen and Jensen8, Juneja et al.19, and Rasmusen24 established linkage between the loci for glucosephosphate isom- erase (GPI) isozymes, halothane sensitivity (HAL), A - 0 inhibition (S), H blood groups, postalbumin-2 (PO2) serum proteins, and 6-phosphogluconate dehydrogenase (6PGD) isozymes. Rasmusen25 found indications that there is linkage between genes at the H blood-group locus and the loci for C and J blood groups. Thus, the loci for SLA, C, J, GPI, HAL, S, H, PO2 and 6PGD may form one large linkage group. Andresen1 reported linkage between the I blood group and the serum amylase (AM) loci. A further linkage
group containing the loci for the K blood group and the hemopexin (Hpx) system was reported by the same author2. Imlah17 found evidence for linkage of the transferrin (Tf) locus with an undefined early lethal factor. In 1980, Gellin et al.14 and Forster et al.10 reported synteny between the loci for glucoses-phos- phate dehydrogenase (G6PD), hypoxanthine phosphoribosyltransferase (HPRT) and phosphoglycerate kinase (PGK). Forster et al.10 assigned this synteny group to the X- chromosome. Gellin et al.15 indicated that the genes for pyruvate kinase-2 (PK2), man- nose-phosphate isomerase (MPI) and nucle- oside phosphorylase (NP) were syntenic. Ac- cording to Echard et al.9 these genes may be on chromosome 8. Leong et al.20 found evi- dence that the gene for soluble superoxide dismutase (SOD 1) is on chromosome 9.
The present contribution to the swine gene map was obtained when the linkage relation- ships of several natural and induced marker chromosomes and immunogenetic and bio- chemical traits were analyzed by the lod score method.
Materials and Methods
The pigs used in this study were purebred Swiss Landrace or were descendents of a wild boar and Swiss Landrace sows.
Chromosomal preparations were made ac- cording to the standard method of Moorhead ct al.21 by pokeweed stimulation of leukocytes.
The marker chromosomes are summarized in Table I. The induction of marker chromo- somes by sperm irradiation has been described elsewhere13. Hybridization of a wild boar {Sus scrofa scrofa: 2n = 36 chromosomes) with domestic pigs {Sus scrofa domestica; In = 38 chromosomes) provided hybrids (2n = 37 chromosomes) showing a centric fusion be- tween chromosomes 15 and 17. Heteromor- phisms of the centromeric heterochromatin were shown by a sequential Q-C-banding technique (see Fries and Stranzinger1').
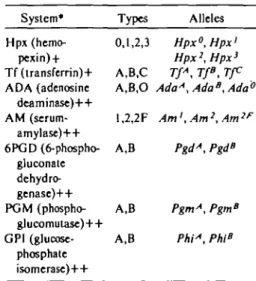
Table II gives a summary of the blood- group systems that were studied and the test procedures that were applied, and Table III lists the serum and enzyme systems. Investi- gation of the polymorphic protein systems was by starch gel electrophoresis.
The statistical examination of the segre- gation data followed the lod score method of Morton22. The significance criteria for ac- ceptance or rejection of linkage were chosen as recommended by Morton22 for human linkage studies. Lod scores greater than 3 are significant for linkage. Lod scores smaller than
—2 are a significant indication that there is no linkage.
Results and Discussion
The lod scores at various recombination frequencies (0), calculated from 85 pairs of 7
chromosomal and 19 serological and bio- chemical markers, respectively, are given in Table IV.
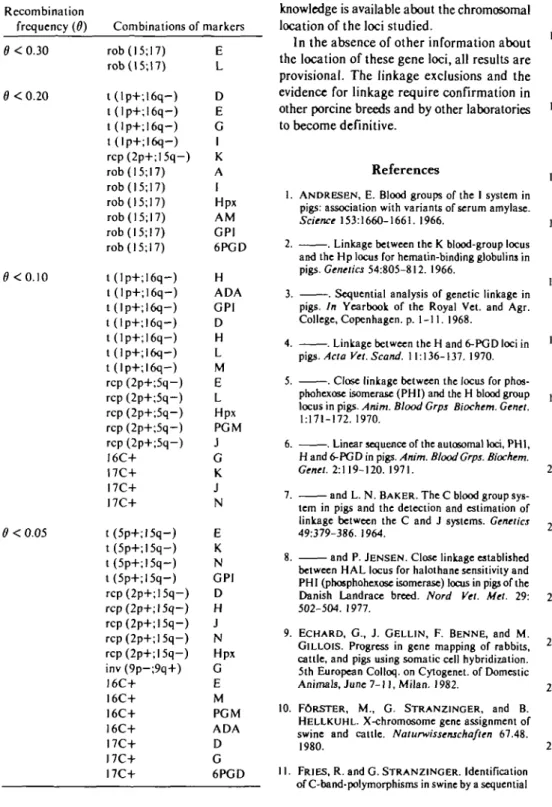
The combinations for which it was possible to exclude linkage (lod scores smaller than
—2) at certain recombination frequencies are listed in Table VI. Lod scores significant for linkage (greater than 3) could not be found when information on the linkage phase was not involved in the calculations. The lod score of the combination G blood group and the rob (15; 17) marker chromosome almost reaches the value of 3 (2.92 for 0 = 0.20, Table IV).
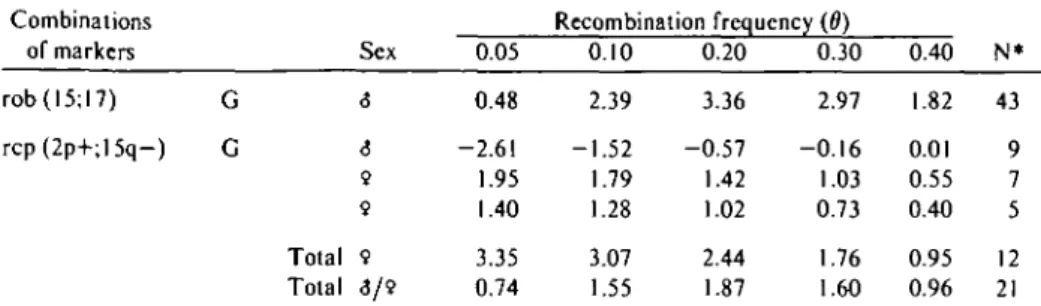
The segregation of the G blood-group alleles and the rob (15;17) marker was studied mostly in the large family of one boar whose linkage phase was known. The lod scores for this boar were recalculated using the linkage phase in- formation and are summarized in Table V.
The lod score at 0 = 0.20 is greater than 3 and is therefore significant for linkage.
A lod score of 1.07 at 6 = 0.20 was obtained for the combination G blood group and the rep (2p+;15q-) marker chromosome. The seg- regation data for this combination were col- lected from the progeny of one male and two females whose linkage phases were known.
The lod scores calculated separately for each animal, incorporating the linkage phase in- formation, are given in Table V. It can be seen that the lod scores for the two females taken together are greater than 3; however, those for the male exclude close linkage.
These results make it possible to provi- sionally locate the G blood-group locus on
chromosome 15. This location mostly was based on the positive lod scores resulting from the combination of the robX15;17) and rep (2p+;15q-) chromosomal markers with the G blood-group locus. A lod score significant for linkage was only calculated for the com- bination rob (15; 17) and G blood group.
Therefore the G blood-group locus could be located on chromosome 15 or on chromosome 17. The positive lod scores of the combination rep (2p+;15q—) and the G blood-group locus gave evidence that this locus could be on chromosome 15 rather than 17. Additional evidence was given by the fact that close linkage between another chromosome 17 marker and the G blood-group locus could be excluded (17C+, Table VI).
Since one of the breakpoints in the recip- rocal translocation rep (2p+;15q—) was de- termined to be in the centromere of chromo- some 15 (see Fries and Stranzinger12), it was expected that one could find the maximum lod score for this combination at 0 = 0.20 (as for the G blood group and the centric-fusion marker rob (15;17)). A maximum lod score at 0 = 0.20 for rep (2p+;15q-) and the G blood group was only calculated when the results from the progeny of the male and female in- formative parents were taken together (Table V). When the sexes were taken separately, maximum lod scores were calculated at 0 = 0.05 for the females and at 0 = 0.40 for the male. The most reasonable explanation for this is that the crossing over rate was changed differently in meiosis in the male and female
Table I. Symbols and explanation of chromosomal markers studied Marker
symbol* Explanation
t ( l p + ; translocation of a part of chr. 16 to 16q-) chr. 1-(radiation-induced) t (5p+; translocation of a part of chr. 15 to
15q—) chr. 5 (radiation-induced) rep (2p+; reciprocal translocation between the
15q—) chr. 2 and 15 (with the larger fragment deriving from chr. 15;
radiation-induced)
inv (9p+; inversion within chr. 9 (radiation- 9 q - ) induced)
rob (15; centromeric (Robertsonian) fusion of 17) the chr. 15 and 17 ("wild-boar-
chromosome")
I6C+ enlargement of the centromeric region of chr. 16 (natural) I7C+ enlargement of the centromeric
region of chr. 17 (natural)
* According to the recommendations of the Paris Conference23
Table II. Blood group systems investigated
Table ID. Scrum protein and enxyme systems investigated
A D E F G H I J K L M N
System factors A
Da,Db Ea,Eb,Ed,Ee Ef,Eg,EI Fa,Fb Ga,Gb Ha,Ha*,Hb,Hc la.Ib
Ja Ke
Ka,Kb,Kc,Kd La
Lb,Ld,Lg,Lk Ma.Mb.Mc Na.Nb
Alleles AA,A~
D",Db
£aet>^ £dbt Ed'f, Ed't
papb Ga,Gb
H°, Hb, Hc, H- I", Ib
J°,J- Kac Kaet Ka^e
Kb,K- yid ladk^ ]J>d
' /.»«' Ma, Mb, Mc, M-
Na,Nb
Test method*
4 1,3 1 1 2,4 4 2 2 2 4 1 3 4 2
System*
Hpx (hemo- pexin) + Tf (transferring ADA (adenosine
deaminase)++
AM (serum- amylase)++
6PGD (6-phospho- gluconate dehydro- genase)++
PGM (phospho- glucomutase)++
GP1 (glucose- phosphate isomerase)++
Types
ft 1 1 \
y, i ,^,j
A,B,C A,B,O 1,2,2F A,B
A,B A,B
Alleles Hpx0, Hpxi Hpx2, Hpx3
TfA, TfB, TfC AdaA, AdaB, Ada0
Am',Am2,Am2F
PgdA, PgdB
PgmA, PgmB
PhiA, Phi"
• Factor for distinguishing between H°/H°- and * Serum protein system-+; enzyme system-++
HmIH' genotypes
t 1: direct agglutination test, 2: anliglobulin (Coombs) test, 3: dextran test, 4: hemolytic test
by the reciprocal translocation.
The lod scores for the combination t (5p+;15q—) and G blood group do not add much information regarding the location of the G blood-group locus, because they were calculated from only three informative des- cendents (Table IV).
According to Andresen3 close linkage be- tween the G blood-group locus and the other known porcine gene loci can be excluded. In spite of this Jjfrgensen'8 reported a linkage disequilibrium between the HAL and the G blood-group locus. The HAL locus had been
shown to be closely linked to the H blood- group locus and other loci of the large linkage group SLA-C-J-GPI-HAL-S-H-PO2-6PGD.
The lod scores from the combination of the loci of this linkage group and markers of chro- mosome 15 were especially interesting. A positive lod score for the H blood group could only be calculated for the rob (15;17) marker (based on only three informative descendants).
On the other hand a lod score of 0.83 at 6 = 0.40 was found for the GPI locus and the rob (15; 17) marker (100 informative descen- dants). The analyses of linkage of the 6GPD
locus with t (5p+; 15q—), rep (2p+; 15q—) and rob (15; 17) provided positive lod scores at higher recombination frequencies. Positive lod scores at higher recombination frequencies have been obtained for J and rep (2p+;15q—) and rob (15; 17). However, these are very weak indications that the linkage group S L A - C - J-GPI-HAL-S-H-PO2-6PGD is located on chromosome 15, especially when considering there was a lod score of 0.80 calculated for the combination of the GPI locus and the 16C+
marker. The linkage group would be located far from the centromere of chromosome 15.
Table IV. Lod scores for chromosomal and immunogenctic and biochemical markers, respectively, at various recombination frequencies
Combinations of markers t ( ! p + ; l 6 q - ) A
D E G H 1 M N Hpx ADA GPI t(5p+;l5q-) D
E G H 1 K L M N GPI 6PGD rcp(2p+;l5q-) D
E G H J K L M N Hpx PGM 6PGD inv (9p-;9q+) A
E G H N M GPI
0.05 -0.35 -10.56 -9.01 -12.44 -6.58 - 7 . 6 8 - 0 . 3 3 0.26 -0.96 - 6 . 0 0 -6.14 -3.55 -3.86 - 0 . 7 2 - 3 . 3 5 -1.81 - 2 . 9 8 -5.51 -3.81 - 2 . 1 6 - 2 . 1 6 - 1 . 3 5 - 2 . 6 3 - 7 . 8 6 -0.14 - 3 . 2 6 -2.42 - 8 . 8 4 -7.21 - 0 . 0 0 - 2 . 8 8 -3.61 - 4 . 3 3 - 1 . 5 4 - 0 . 3 5 - 0 . 3 5 - 2 . 8 9 0.54 0.26 - 0 . 3 3 0.54
Recombination frequency (d) 0.10
0.09 -6.44 -5.23 -7.25 -3.69 -4.67 -0.11 0.21 - 0 . 0 3 - 3 . 1 4 - 3 . 5 0 - 2 . 0 0 -1.85 -0.44 -2.00 -0.84 -1.48 - 3 . 3 3 - 2 . 2 3 - 1 . 3 3 - 1 . 3 3 -0.61 -1.56 -4.64 0.69 - 1 . 7 3 -0.96 - 5 . 3 0 -4.44 0.58 -1.77 -2.22 -2.66 -0.59 0.09 0.09 -1.77 0.47 0.21 -0.11 0.47
0.20 0.33 -2.77 -2.00 -3.18 -1.29 -2.00 -0.03 0.13 0.56 - 0 . 8 0 -1.30 -0.84 -0.31 -0.19 -0.84 -0.12 - 0 . 3 3 -1.42 - 0 . 9 0 -0.58 -0.58 -0.06 -0.64 -1.87 1.07 - 0 . 5 3 0.10 - 2 . 2 0 -1.94 0.77 -0.78 -0.97 -1.16 0.06 0.33 0.33 -0.78 0.32 0.13 0.03 0.32
0.30 0.28 -1.07 - 0 . 6 3 -1.19 -0.37 -0.77 0.04 0.06 0.57 0.04 -0.42 -0.31 - 0 . 1 3 -0.08 -0.31 0.06 0.01 -0.54 - 0 . 3 3 -0.23 - 0 . 2 3 0.07 -0.24 -0.67 0.86 -0.11 0.33 -0.81 -0.76 0.55 - 0 . 3 0 -0.38 -0.45 0.17 0.28 0.28 -0.30 0.17 0.06 0.04 0.17
0.40 0.11 -0.25 -0.11 -0.27 -0.05 -0.18 0.02 0.02 0.28 0.14 -0.08 0.07 0.10 -0.02 -0.07 0.04 0.04 -0.12 -0.07 - 0 . 5 3 - 0 . 5 3 0.41 -0.05 - 0 . 1 5 0.36 -0.01 0.19 -0.18 -0.18 0.19 -0.07 -0.09 -0.11 0.07 0.11 0.11 -0.07 0.05 0.02 0.01 0.05
N*
9 32 34 40 29 24 9 2 16 30 26 12 25 3 13 14 19 19 16 7 7 10 10 29 21 18 21 30 21 10 9 10 14 15 9 9 9 3 2 9 3
Nt 1 1 2 2 2
2 2 3 1 2 2 2 2 2 1 1 1 1 3 3 2 2 3 2 1 2 1 2 2
• Number of informative progeny * Number of informative parents
Therefore it would be practically impossible to significantly prove its location on chromo- some 15 by the markers studied here and by the method of family analyses. Experiments for investigating the chromsomal localization of the 6PG D and GP1 loci by somatic cell hy- bridization techniques are in progress.
Inconsistent information resulted from the lod scores of the combinations I—17C+ and I—rob (15;17). For I—rob (15;17), linkage can be excluded for a recombination frequency of 0 = 0.20 while for I—17C+ a positive lod
Table V. Lod scores calculated when linkage phase was known Combinations
of markers rob(l5;l7) rcp(2p+;15q-)
G G
Sex
<5
6 9 9 Total 9 Total S/9
0.05 0.48 -2.61 1.95 1.40 3.35 0.74
Recombination frequency (0) 0.10
2.39 -1.52 1.79 1.28 3.07 1.55
0.20 3.36 -0.57 1.42 1.02 2.44 1.87
0.30 2.97 -0.16 1.03 0.73 1.76 1.60
0.40 1.82 0.01 0.55 0.40 0.95 0.96
N*
43 9 7 5 12 21
" Number of informative progeny
Table IV. Cont'd.
Recombination frequency (6)
Combinations of markers 0.05 0.10 0.20 0.30 0.40 N*
rob(!5;!7)
16C+
17C+
A E G H I J K L M N Hpx Tf AM GP1 6PGD D E F G H J K L M N Hpx PGM ADA GPI 6PGD D E F G H I K L M N Hpx AM GPI 6PGD
-13.57 -34.60 -0.33 0.54 - 1 1 . 4 5 -6.65 -0.72 -28.71 -0.72 -0.93 -12.68 0.02 -17.94 -19.78 -20.98 -0.19 -2.81 -0.19 -5.15 -1.18 0.54 -0.72 -1.44 -2.11 -1.18 -1.44 -2.16 -2.88 -0.90 -0.72 -2.16 0.37 -0.84 -3.09 -0.19 1.09 -3.35 -3.61 -0.72 -3.55 -0.63 - 0 . 6 3 -1.44 -2.16
-7.88 -19.90 1.79 0.47 -6.82 -3.48 -0.44 -16.81 -0.44 -0.46 -7.11 0.62 -10.82 -10.17 -11.93 0.02 -1.54 0.02 -2.72 -0.67 0.47 -0.44 -0.89 - 1 . 1 3 -0.55 -0.89 - 1 . 3 3 -1.77 0.28 - 0 . 4 4 - 1 . 3 3 0.53 -0.08 -1.79 0.25 0.98 - 2 . 0 0 -2.22 - 0 . 4 4 - 2 . 0 0 -0.17 -0.17 -0.89 - 1 . 3 3
2.99 8.33 2.92 0.32 2.78 • 0.88 0.19 6.47 0.19 0.12 2.42 0.86 4.52 2.33 4.25 0.12 0.52 0.12 0.87 0.25 0.32 0.19 0.39 0.37 0.17 0.39 0.58 0.78 0.80 0.19 0.58 0.52 0.47 0.70 0.48 0.72 0.84 0.97 0.19 0.84 0.13 0.13 0.39 0.58
-0.95 -2.90 2.61 0.17 -0.99 0.05 -0.08 -2.02 -0.08 -0.02 -0.55 0.67 -1.67 0.46 -1.07 0.09 -0.14 0.09 -0.24 -0.09 0.17 -0.08 -0.15 -0.11 -0.07 -0.15 - 0 . 2 3 - 0 . 3 0 0.58 -0.08 - 0 . 2 3 0.36 0.45 -0.25 0.40 0.44 -0.31 -0.38 -0.08 -0.31 0.15 0.15 -0.15 -0.23
- 0 . 1 6 -0.56 1.50 0.05 -0.21 0.19 -0.02 - 0 . 2 6 - 0 . 0 2 - 0 . 0 0 0.33 0.27 -0.37 0.83 0.02 0.03 -0.02 0.03 - 0 . 0 4 - 0 . 0 2 0.05 -0.02 - 0 . 0 4 - 0 . 0 2 - 0 . 0 2 -0.04 - 0 . 0 5 -0.07 0.18 - 0 . 0 2 - 0 . 0 5 0.13 0.19 - 0 . 0 5 0.17 0.14 -0.07 -0.09 - 0 . 0 2 -0.07 0.06 0.06 -0.04 - 0 . 0 5
102 117 48 3 38 56 3 101 3 4 53 16 56 100 82 5 17 5 21 8 3 3 6 10 9 6 6 9 18 3 7 7 17 13 17 5 13 10 3 12 8 8 5 6
3 3 2 1 1 1 1 2 1 1 2 1 1 2 3 1 4 1 3 3 1 1 2 2 1 2 1 2 2 1 1 1 2 2 2 1 2 1 1 2 1 1 1 1
Table VI. Combinations for which linkage can be excluded to certain recombination
frequencies Recombination
frequency (0) 8 < 0.30
6 < 0.20
5 < 0.10
e < o.o5
Combinations of markers rob (I5;17)
rob(15;17) t(lp+;l6q-) t(lp+;16q-) t(lp+;16q-) t(lp+;16q-) rcp(2p+;15q-) rob(I5;17) rob (15;17) rob(15;17) rob(15;l7) rob (15; 17) rob(15;17) t(lp+;16q-) t(lp+;16q-) t(lp+;16q-) t(lp+;16q-) t(lp+;l6q-) t(lp+;l6q-) t(lp+;l6q-) rep (2p+;5q-) rep (2p+;5q-) rcp(2p+;5q-) rcp(2p+;5q-) rep (2p+;5q-) 16C+
17C+
I7C+
I7C+
t(5p+;15q-) t(5p+;l5q-) t(5p+;15q-) t(5p+;l5q-) rcp(2p+;15q-) rcp(2p+;15q-) rcp(2P+;l5q-) rcp(2p+;15q-) rcp(2p+;l5q-) inv(9p-;9q+) I6C+
I6C+
16C+
16C+
I7C+
17C+
17C+
E L D E G 1 K A 1 Hpx AM GPI 6PGD H ADA GPI D H L M E L Hpx PGM J G K J N E K N GPI D H J N Hpx G E M PGM ADA D G 6PGD
score of 1.09 was calculated at 6 = 0.05. These scores, as well as those of other combinations, will become interesting only when further knowledge is available about the chromosomal location of the loci studied.
In the absence of other information about the location of these gene loci, all results are provisional. The linkage exclusions and the evidence for linkage require confirmation in other porcine breeds and by other laboratories to become definitive.
References
1. ANDRESEN, E. Blood groups of the I system in pigs: association with variants of serum amylase.
Science 153:1660-1661. 1966.
Q-C-banding technique. IVth European Chro- mosome Analysis Workshop:! 1.3. 1980.
12. -and - -. Chromosomal mutations in pigs
2. . Linkage between the K blood-group locus and the Hp locus for hematin-binding globulins in pigs. Genetics 54:805-812. 1966.
. Sequential analysis of genetic linkage in pigs. In Yearbook of the Royal Vet. and Agr.
College, Copenhagen, p. 1-11. 1968.
-. Linkage between the H and 6-PGD loci in pigs. Ada Vet. Scand. 11:136-137. 1970.
. Close linkage between the locus for phos- phohexose isomerase (PHI) and the H blood group locus in pigs. Aram. Blood Grps Biochem. Genet.
1:171-172. 1970.
. Linear sequence of the autosomal loci, PHI, H and 6-PGD in pigs. Anim. Blood Grps. Biochem.
Genet. 2:119-120. 1971.
7. and L. N. BAKER. The C blood group sys- tem in pigs and the detection and estimation of linkage between the C and J systems. Genetics 49:379-386. 1964.
8. and P. JENSEN. Close linkage established between HAL locus for halothane sensitivity and PHI (phosphohexose isomerase) locus in pigs of the Danish Landrace breed. Nord Vet. Met. 29:
502-504.1977.
9. ECHARD, C , J. G E L L I N , F. BENNE, and M.
GllXOlS. Progress in gene mapping of rabbits, cattle, and pigs using somatic cell hybridization.
5th European Colloq. on Cytogenet. of Domestic Animals, June 7-11, Milan. 1982.
10. F6RSTER, M., G. STRANZINGER, and B.
HELLKUHL. X-chromosome gene assignment of swine and cattle. Naturwissenschaften 67.48.
1980.
11. FRIES, R. and G. STRANZINGER. Identification
of C-band-poIymorphisms in swine by a sequential
derived from X-irradiated semen. Cytogenet. Cell Genet. 34:55-66. 1982.
13. , G. DOLF, and G. STRANZINGER. Gen-
kartierung bei landwirtschaftlichen Nutztieren:
Gegenwfirtiger Stand, eigene Untersuchungen und AnwendungsmOglichkeiten. Schweiz. Landw.
Monatshefte 60:205-221. 1982.
14. GELLIN, J., F. BENNE, M. C. HORS-CAYLA, and
M. GlLLOlS. Gene mapping in the pig (Susscrofa I.). I. Study of two syntenic groups G6PD, PG K, HPRT,andPKM2, MPl. Ann. Genet. 23:15-21.
1980.
15. , G. ECHARD, F. BENNE, and M. GILLOIS.
Pig gene mapping: PKM2-MPI-NPsynteny. Cy- togenet. Cell Genet. 30:59-62. 1981.
16. HRUBAN, v., H. S I M O N , J. HRADECKY, and F.
JILEK. Linkage of the pig main histocompatibility complex and the J blood group system. Tissue Antigens 7:267'-21'1. 1976.
17. IMLAH, P. Evidence for the Tf locus being associ- ated with an early lethal factor in a strain of pigs.
Anim. Blood Grps. Biochem. Genet. 1:5-13.
1970.
18. JpRGENSEN, P. F. Polymorphic systems in blood:
associations with porcine halothane sensitivity and meat quality. Ada Agric Scand. (Suppl.) 21:
386-395.1979.
19. JUNEJA, R. K., B. GAHNE, I. EDFORS-LILJA, and
E. ANDRESEN. Genetic variation at a pig serum protein locus, PO-2 and its assignment to the Phi, Hal, S, H, Pgd linkage group. Anim. Blood Grps.
Biochem. Genet. 14:27-36. 1983.
20. LEONG, M. M., C. C. LIN, and R. F. RUTH. As- signment of superoxide dismutase (SOD 1) to pig chromosome 9. Cytogenet. Cell Genet. 32:294.
1981.
21. MOORHEAD, P. S., P. C. NOWELL, W. J.
M E L L M A N N , D. M. BATTIPS, and D. A. H U N -
GERFORD. Chromosome preparations of leuko- cytes cultured from human peripheral blood. Exptl.
Cell Res. 20.613-616. 1960.
22. MORTON, N. E. Sequential tests for the detection of linkage. Am. J. Hum. Genet. 7:277-318.
1955.
23. PARIS CONFERENCE (1971). Standardization in human cytogenetics. Cytogenel. Cell Genet. 11:
313-362.1972.
24. RASMUSEN, B. A. Linkage of genes for PHI, halothane sensitivity, A-0 inhibition, H red blood cell antigens, and 6-PGD variants in pigs. Anim.
Blood Grps. Biochem. Genet. 12:207-209. 1981.
25. . Linkage between genes at the H blood group locus and the loci for C and J blood groups in pigs. Anim. Blood Grps. Biochem. Genet. 13:
285-289. 1982.