Keller and Keller: A distribution-free, multivariate discriminating method 601 J. Clin. Chem. Clin. Biochem.
Vol. 24, 1986, pp. 601-609
© 1986 Walter de Gruyter & Co.
Berlin - New York
A Distribution-Free, Multivariate Discriminating Method
Initial experience with the discrimination of patient groups by 2 or more clinical chemical parameters
By Bernhard Keller and Herbert Keller
Institut för Klinische Chemie und Haematologie des Kantons St. Gallen
. (Received October 21, 1985/April 6, 1986)
Summary: We communicate a distribution-free quasi graphic procedure for obtaining a linear discriminating function. The method is based on the following considerations:
Suppose a group A is to be separated from a group B using two parameters X and Y. The centre of each group is defined äs the median (or mean or mode) of its points. Of all straight lines passing through any point of A and any point of B those are retained which intersect the segment joining the centres of A and B. For each of these the number of wrongly allocated points is calculated (i. e. the points which do not lie on the same side of the straight line äs their group centres). In this way one obtains straight lines with maximal separating power (for the two groups given). Finally, each optimal line is rotated in such a way that its defining points are also correctly allocated.
If more than two parameters are available a stepwise procedure can be used: the distance from the separating straight line obtained from the first two parameters is introduced äs a new parameter, which is then combined with the third parameter to yield a new discriminating function which depends on all three parameters.
Iterating this step one can combine any nümber of parameters.
The method was implemented on a personal Computer.
It was first applied to a textbopk model (chances of survival for M. haemolyticus neonatorum estimated by concentrations of haemoglobin and bilirubin in cord blood). As a second model we used a tetravariate study (primary hypetparathyreoidism versus other hypercalcaemic diseases, estimated by the blood concentrations of calcium, phqsphate and chloride, and by haematocrit).
In addition to the learning collectives, 2 test collectives were available: a group of primary hyperparathyreoid- ism.patients from anpther clinic and a group of patients with secondary hyperparathyreoidism from a third clinic. In this orientating study the new method shows good discriminating capacity.
Eine verteilungsfreie, multivariate Diskriminanzmethode
Zusammenfassung: Es wird ein verteilungsfreies, quasi graphisches Verfahren zur Ermittlung einer linearen Diskriminanzfunktipn beschrieben, das auf folgenden Überlegungen basiert:
Angenommen ein Kollektiv A sei von einem Kollektiv B zu trennen, wobei Parameter X and Parameter als Variate dienen. Nun wird im Kollektiv A und B der Schwerpunkt (oder der Median oder das Dichtemittel) festgelegt und die beiden Schwerpunkte durch eine Gerade verbunden. Der nun eingesetzte Algorithmus lautet: von jedem Punkt des Kollektivs A wird zu jedem Punkt des Kollektivs B eine Verbindungs-Gerade gezogen. Jene Geraden, welche die Schwerpunkt-verbindende Strecke schneiden, bewirken eine Trennung der
J. Clin. Chem. Clin, Biochem. / Vol. 24,1986 / No. 8
beiden Kollektive. Es wird nun für jede einzelne dieser Geraden untersucht, wie groß die Anzahl der falsch zugeordneten Punkte ist, wobei jeder Punkt als falsch zugeordnet betrachtet wird, der nicht auf der gleichen Seite der Geraden wie der Schwerpunkt seines Kollektivs liegt. In dieser Weise werden die Geraden mit der maximalen Trennwirksamkeit ermittelt, anschließend wird jede optimale Gerade so gedreht, daß auch die
definierenden Punkte korrekt zugeordnet werden. :'
Wenn mehr als zwei Parameter zur Verfügung stehen, so muß schrittweise vorgegangen werden: die Abstände von der Trenngeraden bezüglich der ersten beiden Kenngrößen wird als neuer Parameter betrachtet und ihm ein dritter Parameter gegenübergestellt. In dieser Weise kann beliebig oft fortgefahren werden. Zur Durchführung des Rechenverfahrens wurde ein Programm für einen Personal-Computer entwickelt.
Das neue Verfahren wurde zunächst an einem Lehrbuch-Modell (Überlebenschancen bei Morbus haemolytl··
cus neonatorum, geschätzt aus der Hämoglobin- und Bilirubin-Konzentration im Nabelschnur-Blut) erprobt.
Ferner konnte eine tetravariate klinische Studie überprüft werden (primärer Hyperparathyreoidismus versus andere hypercalcaemische Erkrankungen, abgeschätzt aus den Kenngrößen Hämatokrit, Chlorid, Calcium und Phosphat). Außer den beiden Lernkollektiven stand ein Kollektiv von primären Hyperparathyfeöidismus- Patienten aus einer anderen Klinik, sowie ein Kollektiv von Patienten mit sekundärem Hyperparathyreoidis- mus aus einer dritten Klinik zur Verfügung. Bei diesen orientierenden Untersuchungen erwies sich das Verfahren als sehr leistungsfähig.
Introduction
If two or more distinct groups are to be discriminated by two or more features, methods of discriminant analysis are used (1—9). The "classical" linear dis- criminant analysis (10) presupposes a muitivariate normal distribution. Frequently this type of distribu- tion is not given (or its presence cannot be verified, e. g. because of lack of data). This may be the reason why frequently unsatisfactory results are obtained.
Therefore different non-parametric methods of dis- criminant analysis have been developed (5, 11, 12) by many authors.
Procedure
Our new, quasi "graphic" procedure is based on the following considerations:
If two collectives are to be separated by two charac- teristics, a dissecting straight line (= discriminant function) is found, which separates all points so that none or a minimal number of points is wrongly classi- fied (allocated). It is possible that several straight lines have the same power of Separation (we will not enter into the possibility that a curve-linear function provides the optimal dissection).
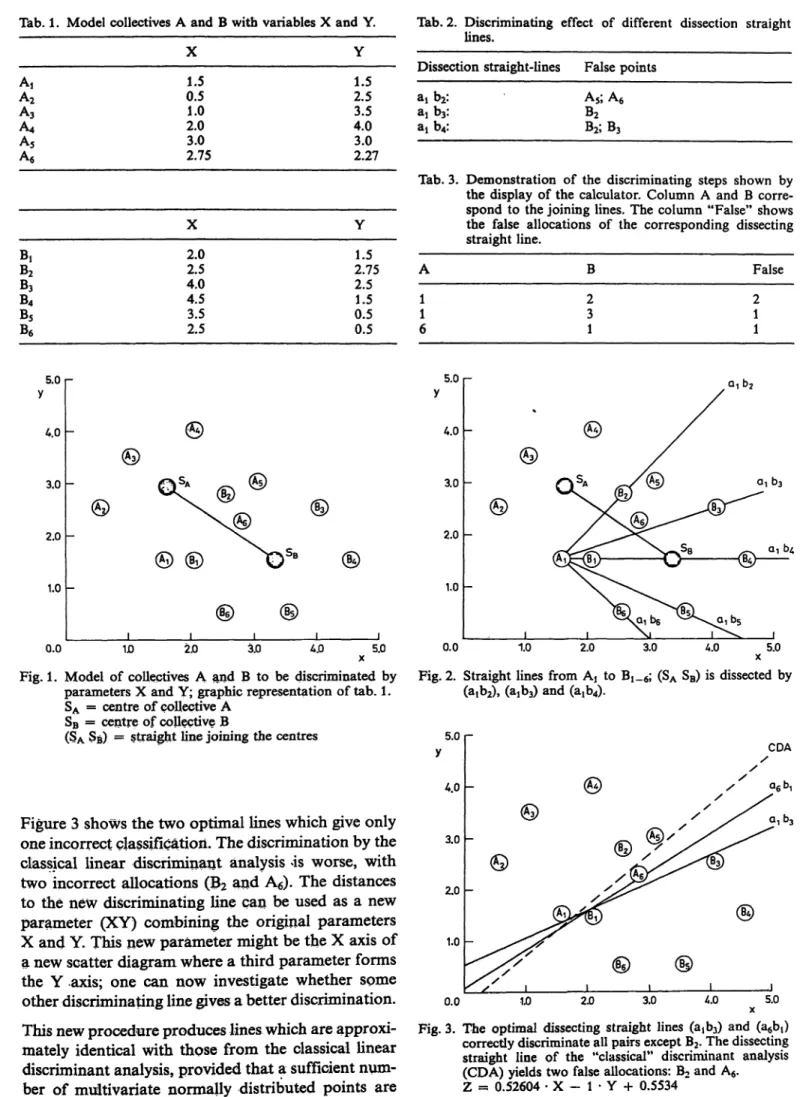
We demonstrate our procedure by a model (tab. 1):
A scatter diagram (fig. 1) of parameter X and shows the values of group A and B. (In fig. l the points are numbered for easier reference). For each group (cluster) the mean values (or the medians or the modes) are calculated (SA, SB respectively).
If one or both variates have a discriminating power with respect to the groups then the means (or medians or modes) cannot be identical. The greater the dis- criminating power, the greater the distance between SA and SB will be.
Now the following algorithm is applied: from each point of group A a straight line to each point of collective B is drawn. All lines which do not intersect the connecting line (SASB) are ignored. For all lines that intersect the connecting line, the number of in- correctly allocated points is determined, applying the following rule: a point is considered to be incorrectly allocated if it does not lie on the same side of the straight line äs its group mean (or mode or median).
Figure 2 shows the six possible straight lines from AI to Bi_6; (AiBj), (AtBs) and (AjB6) do not intersect (SASß). The discriminating effect of the three other lines is given in table 2.
Subsequently for point A? all dissecting lines are searched and it is checked whether the discriminating power is better than for the preceding lines. Continu- ing in this way the discriminating power of all possible lines is investigated. Finally the straight line (or lines) is retained, which provides the smallest number of wrong allocations. In our exainple this is true for two straight lines (aib3) and (a^), where just one point is misclässified: B2 (tab. 3).
The optimal straight line is now rotated in such a way that the defining points äife correctly classified, too.
J. Cliru Chem. Clin. Biochem. / Vol. 24,1986 / No. 8
Keller and Keller: A distribution-free, multivariate discriminating method 603 Tab. 1. Model collectives A and B witb variables X and Y.
AA,2 A3 A4
A5 A6
0.51.0 2.03.0 2.75
1.52.5 4.03.5 3.02.27
B,B2
B3
B4
B5
B6
X 2.02.5 4.04.5 3.52.5
Y 2.751.5 2.51.5 0.50.5
Tab. 2. Discriminating effect of different dissection straight lines.
Dissection straight-lines False points a, b2:
aib3: aj b4:
A5; A6
B2
B2;B3
Tab. 3. Demonstration of the discriminating steps shown by the display of the calcuiator. Column A and B corre- spond to the joining lines. The column "False" shows the false allocations of the corresponding dissecting straight line.
A 11 6
B 23 1
False 21 1 5.0 r
4.0
3.0
2.0
1.0
0.0 1D 2.0 3.0 5.0
Fig. 1. Model of collectives A and B to be discriminated by Parameters X and Y; graphic representation of tab. l.
SA = centre of eollective A SB = centre of eollective B
(SA SB) == straight line joining the centres
Figure 3 shows the two optimal lines which give only one incorrect classificatiori. The discrimination by the classical linear discriminant änalysis is worse, with two incorrect allocations (B2 and A6). The distances to the new discriminating line can be used äs a new Parameter (XY) combining the original parameters X and Y. This new parämeter might be the X axis of a new scatter diagram where a third parämeter forms the Y .axis; one can now investigate whether some other discriminating line gives a better discrimination.
This new procedure produces lines which are approxi- mately identical with thpse from the classical linear discriminant änalysis, provided that a sufficient num- ber of multivariate normally distributed points are
5.0
4.0
3.0
2.0
1.0
0.0 1.0 2.0 3.0 4.0 5.0
Fig. 2. Straight lines from Aj to !_ ; (SA SB) is dissected by (atb2), (a!b3) and (ajb^.
CDA
Fig. 3. The optimal dissecting straight lines (3^3) and (a6bt) correctiy discriminate all pairs except B2. The dissecting straight line of the "classical" discriminant änalysis (CDA) yields two false allocations: B2 and A6. Z = 0.52604 · X - l · Y H- 0.5534
J. Clin. Chem. Clm. Biochem. / Vol. 24,1986 / No. 8
available. In any case, the straight line, obtained in this way, is the best possible for the given "learning collective". If more than one optimal discriminating line is found, each one must be investigated to deter- mine whether the addition of a new parameter leads to a better discrimination. It is possible that impor- tant differences occur, although the discriminating lines showed identical power of Separation in the first step.
Application
For the application in practice we have developed a program ("OPTIGER") in BASIC for the HP 87XM (see Addendum)1)-
For small collectives — e. g. 12 points in our model
— the calculation is performed in a few seconds. If the number of points is considerably larger (> 100), then the procedure takes a few hours.
On the order "determination of the optimal discrimi- nating line" the Computer screen displays the indivi- dual steps of the procedure. As an example, the discriminating steps of our model are shown in table 3. Also the classical discriminant analysis can be performed on request by the same program OPTI- GER. Less time is necessary for this calculation, e. g.
only a few minutes for > 100 points.
During the construction of the optimal discriminating line, the predominance of false positive over false negative allocations or vice versa, is not taken into account. Consequently the diagnostic sensitivity or specificity predominates. Using the OPTIGER pro- gram a shifting of the discriminating line is possible in order to improve diagnostic sensitivity or specificity.
Nevertheless in any case a shifting causes a deteriora- tion of the discriminating power.
The efficiency of OPTIGER has been tested, using an example from a well known textbook (13), and on a clinical study from the literature. Other examples have been published separately (14, 15).
Examples of application Textbook-model
Discriminant analysis for the assessment ofsurvival in cases of Icterus haemolyticus neonatorum, (2 para->
meters available)
are determined. It is required to predict the chance of survival by means f these two parameters. Out of 79 infants affected by the haemolytic disease 63 survived and 16 died. The histogram (fig. 4) shows that with both parameters the giroups overlap widely.
It is not possible to assess the chance of survival by the haemoglobin or the bilirubin level alone.
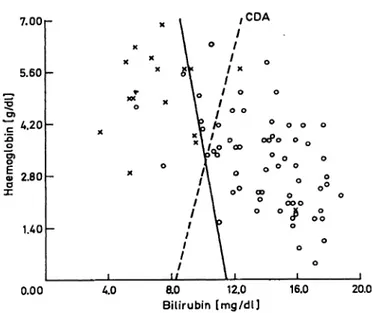
Another pict re shows the scatter diagram (fig. 5):
obviously the survivors are concentrated in the lower right part, and those that died in the upper left.
0.12
0.00
0.25 l
0.0 2.0 4.0 6.0 Θ.Ο Ίαό 12Ό U.O
Haemoglobin [g/dl] 16.0 18.0 20.0 0.41 -
o 0.27
O.U
0.00
> O.U
0.00 0.70 WO 2.10 2BO 3.50 4.20 490 5.60 6L30 7.00 Bilirubin [mg/dl]
In this example the concentrations of haemoglobin Fig. 4, Histogram of haemoglobin and bilirubin concentrations and bilirubin in the cord blood of new born babies in cord Wood of newborns, suffering of M. haemo-
lyticus neonatorum. Non-surviyors (N = 16) top, sunfl-
1N . vors (N = 63) bottom. Both collectives are calculated
) A hs ng can be received from the authors on request. s 100%.
J. Clin. Chem. Clin. Biochem. / VoL 24,1986 / No. 8
Keller and Keller: A distribution-free, multivariate discriminating method 605
7.00
5.60
4.20
9
φ 2.80 α
uo
0.00 40
CDA
ο ο ο οοοο
*»
ao 12.0
Bilirubin [mg/dl]
16.0 20.0
Fig. 5. Scatter diagram of figure 4. With the straight line con- structed by classical discriminant analysis (CDA) 11 patients are falsely allocated; with the OPTIGER-line 5 patients are falsely allocated.
o = survivors; * = non-survivors; OPTIGER l = -2.5027 · haemoglobin - l · bilirubin + 28.703
0.21 -
0.10
ΟΌΟ
0.10
10D
0.21
-20.0 -16Λ -123 -9.2 -5.6 -2.0
Z1 1.6 5.2 8.8 12Λ 16.0
Fig. 6. Histogram in analogy to fig. 4, the function Z = 2.5 Hb - Bilirubin + 28.7
is used s p rameter.
The calculation of the classical discriminant analysis results in a discriminating function, whereby 54 of 63 survivors are correctly classified (and 9 are misclassi- fied), and 14 of the 16 that died are correctly classified (and 2 are misclassified), i. e. 68 out of 79 (86%) are correctly classified.
The OPTIGER program finds two straight lines with correct classifications of 60/63 survivors and 14/16 non-survivors. There are only 5 misclassifications, 94% being correctly allocated by OPTIGER. It is noteworthy to state that both discriminating lines are nearly vertical on the X axis, which means that haemoglobin has a much higher discriminatory power than bilirubin.
The histogram of the distribution with the new p ra- meter Z l of both collectiVes is shown in figure 6. By the new discriminant function,
Z! = 2.5 Hb - Bilir bin -h 28.7,
the chances of $ufvival improve with increasing nega- tivity of the resulting value, and vice versa.
Tetravariate clinical study
In order to discriminate between the primary hyper- parathyreoidism and other hypercalcaemic disorders, several authors have recommended discriminant analysis (16—20).
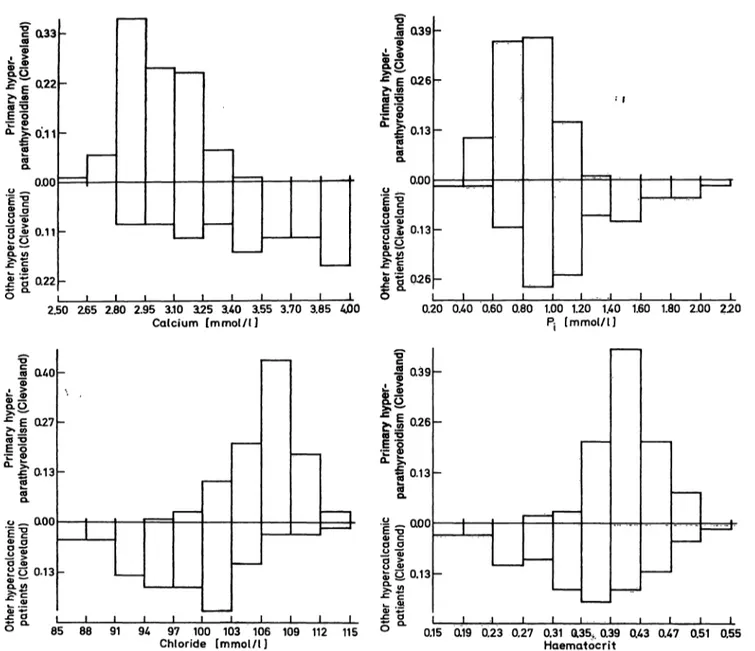
Recently a study by Lafferty (Cleveland) (21) was published on this subject. For the discrimination of hypercalcaemic patients he used haematocrit, chlor- ide, calcium and phosphate, and for some of the patients he also used parathormone. We received the complete data base from the author2). It contains 100 patients suffering from primary hyperparathyreoid- ism, verified by biopsy; 31 patients with bone metas- tases of malign diseases, 20 patients with pseudohy- perparathyreoidism, 4 patients with vitamin-D intox- ication, 3 patients with thyreotoxicosis and 6 patients with hypercalcaemia from other diseases. The histo- grams of the 4 parameters are shown in figure 7 where the patients with primary hyperparathyreoidism are t the top and all other 64 non-hyperparathyreoidism patients at the bottom. The calcium concentration in serum is lower in the hyperparathyreoidism group compared with the other patients, but there is a broad overlaping zone.
The same is true for phosphate in serum, where the hyperparathyreoidism patients also show lower values.
Within the distribution of the chloride concentrations the hyperparathyreoidism group shows a peak, sig- nificantly higher than in the non-hyperparathyreoid- ism group.
2) We thankfully acknowledge the generosity of Dr. Lafferty.
J. Clin. Chem. Clin. Bioctem. / Vol. 24,1986 / No. 8
t (133
£α.
Ί
£^Γα22
II
E "^ £· 0:1 1
ι ι Η
0.00g! 0.11
Φ — *:: ο
>;*?
ΐ α>
5 "5 0.22 δ °· ,
_
- _
_
— |
^·g Q39
S.O
·*1Γθ26
11
ί 0.13S.2 ο ^||
σ ^ 0.13 Φ ώ
^ ^* "£·
J g B 026ΐ .2
, , , , δ0"
-
"
-
>—
J |
·· ι
__Μ
.1 Ι 1 Ι Ι
2.50 Ζ65 2.80 2.95 3.10 3L25 3.40 3.55 3.70 3.85 4jOO
Calcium [mmol/l] 0.20 ΟΛΟ 0.60 0.80 1.00 1.20 1.40 1.60
[mmol/l] 1.80 2.00 220 ,-.
S <uo
έϊ
Q.O, c =5E S έ|α13
S
f* fion
"ε "gφ α
s?
Ο Φ£ o 0.13
S."iL^
_
-
_
I1
039
fr i °· 26
11
« 0.13S 5£ o 0.13
f.i
S 4285 88 91 94 97 100 103 106 109 112
Chloride [mmol/l] 0.15 0.19 0.23 0.27 0.31 QL35,. 0.39 0.43 0.47 0.51 0.55 Haematocrit
Fig. 7. Histograms of patients with primary hyperparathyreoidism from the Cleveland clinic (top), and other hypercalcaemic patients from the Cleveland clinic (bottom): both collectives are calculated s 100%.
Also the mean haematocrit value is higher in hyperpa- rathyreoidism patients, gain with complete overlap- ing.
Parathormone was not included in our calculations because its concentration was not determined for the majority of patients. Furthermore, parathormone is an analytically uncertain parameter with insufficient standardization and insufficient comparability from one laboratory to another.
The univariate validity of each par meter does not suffice to solve the diagnostic problem. We therefore triedca bivariate combination. With 4 parameters, 6 bivariate combinations are possible. Figure 8 shows the scatter diagram of calcium versus phosphate with the optimal discriminating line, Zi9 calculated by the Computer. The discriminating line allocates 94/100 hyperparathyreoidism patients correctly, and 55/64 non-hyperparathyreoidism patients; i.e. 15 patients
2.50 r
0.00250 2.90 3,30 3.70 A.10 450
Calcium [mmol/l]
Fig. 8. Scatter diagram of primary hyperparathyreoidism col- lective frpm the Cleveland clinic (*) and pther hypercal- caemic patients from the Cl^eland clinic (o)
Ca vs Pi
ZI = -0.95697 - Ca - l · PS + 3.9501
J. Clin. Chem. Clin. Biochem. / Vol. 24,1986 / No. 8
Keller and Keller: A distribution-free, multivariate discriminating method 607
were wrongly classified. The discriminating power of the classical discriminant analysis is lower, 18 patients being incorrectly allocated. A new scatter diagram was constructed with the parameter Zj on the X-axis and Chloride on the Y-axis (flg. 9). With OPTIGER one can find 6 optimal discriminating lines of ident- ical discriminating power: 95/100 hyperparathyreoid- ism patients and 58/64 non-hyperparathyreoidism patients are correctly classified: 11 patients are mis- classified. The new discriminant function, Z2, is ob- viously better than Z\.
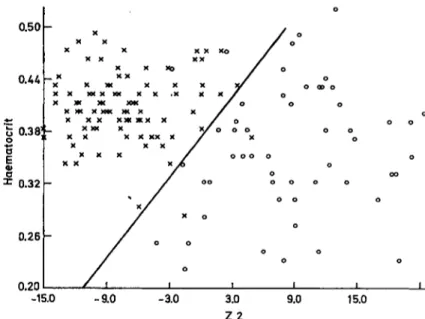
With Z2 on the X-axis and haematocrit on the Y- axis, the new scatter diagram gives even better dis- criminating by Z3 (fig. 10): now 98/100 hyperparathy- reoidism patients and 62/64 non-hyperparathyreoid- ism patients are correctly classified, the number of misclassifications being only 4. The distribution of the "learning-group" under Z3 is shown in figure 11.
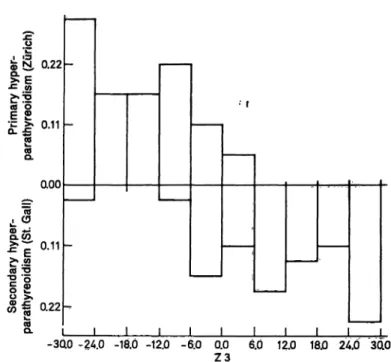
The discriminating power of Z3 was controlled by two other independent patient groups: 37 samples from patients with verified primary hyperparathyreo- idism from the clinics of the Zürich University, and 37 samples from patients of our own hospital, suffer- ing of secondary hyperparathyreoidism. The discrimi- nation of the Zürich hyperparathyreoidism patients from the non-hyperparathyreoidism group is nearly äs perfect äs that for the learning group (fig. 12). 35/
37 Zürich hyperparathyreoidism patients are cor- rectly classified. As expected, the distribution of the patients with secondary hyperparathyreoidism is worse (fig. 13). Only 29/37 St. Gall secondary hyper- parathyreoidism patients are correctly classified.
115
109 l .—,
103
i 97O
91
85
o oo o
-200 -1.50 -1iOO -0.50
Z1
0.00 aso
Fig. 9. Scatter diagram of primary hyperparathyreoidism col- lective from the Cleveland clinic (*) and other hypercal- caemic patients from the Cleveland clinic (o)
ZI vs Cl"
Z2 = + 12.55505 - Ca + 13.12 · P£ - l · Cl + 50.246
With the function,
Z3 = 19.4 calcium (mmol/1) + 20.3 phosphate (mmol/1) — 15.5 Chloride (mmol/1) — haematocrit 100 -l· 115,
a primary hyperparathyreoidism becomes more pro- bable with increasing negativity of the results, and vice versa.
0.50
0.44
0.38!
0.32
0.26
0.20-15.0 -9.0 -3.0 3.0 22
9.0 15.0
Fig. 10. Scatter diagram of primary hyperparathyreoidism col- lective from the Cleveland clinic (*) and other hyper- calcaemic patients from the Cleveland clinic (o).
Z2 vs haematocrit
Z3 = -h 19.39438 · Ca H- 20.26731 · Pt -1.545 · Cl - 100 · haematocrit + 115.05043
0.27
t!
|lsn
•0.00
! ?
0.13•l ;t
a27-3QO -24.0 -18.0 -12.0 -6.0 0.0 6.0 12 18.0 24.0 30.0 Z3
Fig. 11. Histogram of primary hyperparathyreoidism collective from the Cleveland clinic (top), and other hypercalcae- mic patients from the Cleveland clinic (bottom), with Z3 äs parameter.
J. Clin. Chem. Clin. Biochem. / Vol. 24,1986 / No. 8
•c 0.26
»!. °
•C W£*!2
| g 0.13
£t
Λ(0CL 0.00
O --*-
E lα 5 0.13 u >
£α» — ΐ .ϊ 0.26 δ *
-30 -
-
~
~
.0 -24 ι .0 -18 ι
.0 -12
Ι
.0 -6.0 0.
Ζ0 0
3 6 12.0 18.0 24JO 3C
"C
lL ίΓί Λ 00
Φ Ν, 0.22
•c wδε
c5 *!
·— >. η 11
ο! J= υ·ΊΊ
L. Ο.
ηηη
Λ C3Λ Φ ·*-
">, Ι
Q.Wcd Ό
"i g ο \L w !* 0.22
CO°· l )Ό -3C -
10 -24 .0 -1ίJ. -15>.o -e5.0 0 z
• f
·'
'
0 6
3 .0 12..0 1**.0 2/».O 3Cto
Fig. 12. Histogram of a patient collective with primary hyper- parathyreoidism from the Z rich clinies (top) and other hypercalcaemic patients from the Cleveland clinic (bottom).
Fig. 13. Histogram of primary hyperparathyreoidism collective from the Z rich clinies (top) and a patient collective with secondary hyperparathyreoidism from the St.
Gall clinic (bottom).
It should be pointed out that the function Z3 is valid only for hypercalcaemic patients. If normocalcaemic patients are to be separated from hyperparathyreoid- ism patients (an illogical problem!) it would be neces- ssary to construct a new discriminating function using another learning group.
Addendum
I) Denotations Collective number
of points points index centre A
B n
m ... A
n
. . . B „ SA
SB II) Algorithms
A point is false with respect to a straight line, if it is not on the side of the centre of its collective
Fg = number of false points with respect to the straight line g
Fmin = minimum of Fg
1 calculate SA, SB 2 let ΡΠ^ == m + n 3 i: = l
4 j : = l
5 detennine the straight line g = (Ai5 Bj) 6 if g does not dissect (SASB), go to 9 7 detennine Fg
8 if pg < F^ st re g and let Ρ^η: = Fg 9 j: = j + l
10 if j < m, go to 5 11 i: = i + l 12 ifi < n, goto 4
13 rotate the optimal straight line g = (Ab Bj) by an adequate angle about the center of Ai9 Bj
14 list the optimal straight lines
References
1. Lachenbruch, P. A. (1975) Discriminant analysis. Hafner Press, New York.
2. Solberg, H. E. (1975) Discriminant analysis in clinical chemistry. Scand. J. Lab. Clin. Invest. 55, 705-712.
3. Anderson, T. W. (1958) An introduction to multivariate statistical analysis. John Wiley New York.
4. El s, G. & Goldberg, D. M. (1979) Discriminant function analysis applied to laboratory tests in patients with hepato- biliary disease. Comp. Biomed. Res. Jf2, 483 — 501.
5. Flury, B. & Riedwyl, H. (1983) Angewandte multivariate Statistik. G. Fischer Verlag, Stuttgart.
6. Durbridge, T. C. (1984) Applying descriptive discriminant analysis s a visual aid for physicians interpreting biochenii- cal test results. Clin, Biochem. 17, 321 — 326.
7. Michaelis, J. (1972) Zur Anwendung der Diskriminanzana- lyse f r die medizinische Diagnopf'ik. Habil. Schrift, Mainz.
J. Clin. Chem. Clin. Biochem. / Vol. 24,1986 / No. 8
Keller and Keller: A distribution-free, multivariate discriminating method 609 8. Hermans, J., van Zomeren, B., Raatgever, J. W., Sterk,
P. J. & Habbema, J. B. F. (1981) Use of posterior probabili- ties to evaluate methods of discriminant analysis. Meth.
Inform. Med. 20, 207-212.
9. Goldschmidt, H. M. J. & Leyten, J. F. (1985) Medicome- trics — a new, promising discipline. In: Computing in Clinical Laboratories (Trendelenburg, Chr., ed.) Proc. 5 Internat. Conference, Stuttgart (FRG) June 1985.
10. Fisher, R. A. (1936) The use of multiple measurements in taxonomic problems, Annals of Eugenics VII, pari II, pp.
179-188.
11. Birkenfeld, W. (1978) One Step towards a nonparametric discriminant analysis. In: COMPSTADT 1978. Proceedings in computational statistics. 3rd Symposium held in Leiden 1978. Physica Verlag, Wien, pp. 162-169.
12. Hansert, E., Federkiel, H. & Stamm, D. (1984) A new procedure for discriminating between two patient popula- tions using multivariate decision limits: Application in the detection, and exclusion of alcoholism based on clinical laboratory fmdings. J. Clin. Chem. Clin. Biochem. 22, 791-810.
13. Armitage, P. (1971) Statistical methods in medical research.
Blackwell Scientific Publ., Oxford (reprint 1980).
14. Riesen, W. F., Mordasini, R. & Keller, H. (1983) Chemial relevance of apolipoproteins. Proc. Intern. Sympos.: New aspects on lipoprotein metabolism, Heidelberg 1983.
15. Riesen, W. F., Mordasini, R. & Keller, H. (1985) Zur klinischen Bedeutung der Apolipoproteine. Lab. Med. P, 339-344. '
16. Fräser, P., Healthy, M., Rose, N. & Watson, L. (1971) Discriminant functions in differential diagnosis of hypercal- cemia. Lancet //, 1314-1319.
17. Fräser, R, Healthy, M., Rose, N. & Watson, L. (1976) Further experience with discriminant functions in different- ial diagnosis of hypercalcemia. Postgrad. Med. J. 52, 254-257.
18. Transbol, J., Jorgensen, F. S., Hornum, J. & Keiding, N.
(1977) Hypercalcaemia discrimination index: A multivari- ate analysis of parathyroid function in 107 hypercalcaemic patients. Acta Endocrinol. 86, 768-783.
19. Transbol, J. (1977) On the diagnosis of so-called normocal- caemic hyperparathyreoidism. Acta. Med. Scand. 202, 481-487.
20. LoCascio, V. H., Vallaperta, P, Adami, S., Cominacini, L., Galvanini, G., Bianchi, L, Ferrari, J. & Scuro, L. A. (1978) Discriminant analysis in differential diagnosis of hypercal- caemia. Clin. Endocrinol. 8f 349-356.
21. Lafferty, F. W. (1981) Primary hyperparathyreoidism.
Arch. Intern. Med. 141, 1761-1766.
%
Professor Dr. Dr. H. Keller Institut für Klinische Chemie und Hämatologie des Kantons CH-9000 St. Gallen
J. Clin. Chem. Clin. Biochem, / Vol. 24,1986 / No. 8