www.solid-earth.net/6/1169/2015/
doi:10.5194/se-6-1169-2015
© Author(s) 2015. CC Attribution 3.0 License.
Density structure and geometry of the Costa Rican subduction zone from 3-D gravity modeling and local earthquake data
O. H. Lücke1and I. G. Arroyo2
1University of Costa Rica, National Seismological Network, 214–2060 San Pedro, Costa Rica
2Helmholtz Centre for Ocean Research Kiel (GEOMAR), Wischhofstr. 1–3, 24148 Kiel, Germany
Correspondence to: O. H. Lücke (oscar.luckecastro@ucr.ac.cr)
Received: 8 June 2015 – Published in Solid Earth Discuss.: 14 July 2015
Revised: 29 September 2015 – Accepted: 7 October 2015 – Published: 29 October 2015
Abstract. The eastern part of the oceanic Cocos Plate presents a heterogeneous crustal structure due to diverse ori- gins and ages as well as plate-hot spot interactions which originated the Cocos Ridge, a structure that converges with the Caribbean Plate in southeastern Costa Rica. The complex structure of the oceanic plate directly influences the dynam- ics and geometry of the subduction zone along the Middle American Trench. In this paper an integrated interpretation of the slab geometry in Costa Rica is presented based on 3- D density modeling of combined satellite and surface grav- ity data, constrained by available geophysical and geologi- cal data and seismological information obtained from local networks. The results show the continuation of steep sub- duction geometry from the Nicaraguan margin into north- western Costa Rica, followed by a moderate dipping slab under the Central Cordillera toward the end of the Central American Volcanic Arc. Contrary to commonly assumed, to the southeast end of the volcanic arc, our preferred model shows a steep, coherent slab that extends up to the landward projection of the Panama Fracture Zone. Overall, a gradual change in the depth of the intraplate seismicity is observed, reaching 220 km in the northwestern part, and becoming pro- gressively shallower toward the southeast, where it reaches a maximum depth of 75 km. The changes in the terminal depth of the observed seismicity correlate with the increased den- sity in the modeled slab. The absence of intermediate depth (> 75 km) intraplate seismicity in the southeastern section and the higher densities for the subducted slab in this area, support a model in which dehydration reactions in the sub- ducted slab cease at a shallower depth, originating an anhy- drous and thus aseismic slab.
1 Introduction
The southeastern end of the Middle American convergent margin is characterized by the segmentation of the subduct- ing oceanic lithosphere and a heterogeneous crustal base- ment on the overriding plate. The oceanic Cocos Plate is composed of crustal segments generated at two different spreading centers and affected by hot spot interaction (Barck- hausen et al., 2001). This diverse morpho-tectonic environ- ment on the oceanic plate causes heterogeneities that carry over to the subduction zone and affect the manner in which plate interaction occurs. Differences in the response of the lithosphere upon arrival to the trench are recognizable, start- ing from the structure of the outer rise, the morphology of the margin and the characteristics of the subduction zone (von Huene et al., 2000). This paper focuses on the subduc- tion zone, geometry the density distribution of the subduct- ing slab under Costa Rica, and on the relationship between the density structure and the seismicity distribution. The 3- D density modeling based on interpretation of the satellite- derived gravity data is constrained by seismological informa- tion from local networks. This joint interpretation of seismo- logical and potential field data allows for an integrated anal- ysis of slab geometry and its interaction with the overriding plate. Determining the slab structure is a major task in the study of subduction zones, which provides a platform to gain a better understanding of subduction processes. Further stud- ies, such as thermal and stress modeling, geochemical and petrological models, and seismic hazard assessments, would benefit from detailed knowledge of the slab and overriding plate configuration.
2 Tectonic setting
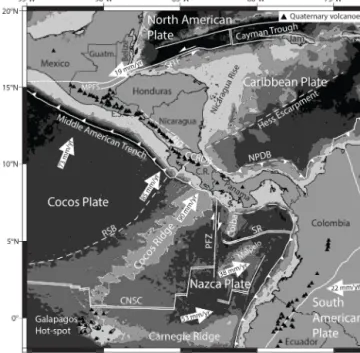
The Central American Isthmus is located in the western edge of the Caribbean Plate (Fig. 1), a predominantly convergent margin defined mainly by the subduction of the oceanic Co- cos Plate along the Middle American Trench (MAT). Costa Rica is located in the eastern portion of the isthmus, where subduction of the Cocos Plate along the MAT is bound by the Panama Fracture Zone (PFZ) – a right-lateral shear zone, acting as a transform boundary between the Cocos and the Nazca Plates. The overall structure of the southeastern part of the Cocos Plate is highly heterogeneous due to the mul- tiple origins of the highly segmented crust (Fig. 1). Seg- ments of oceanic lithosphere created at the East Pacific Rise (EPR) and at the Cocos–Nazca Spreading Center (CNS) are present off the coast of Costa Rica (Barckhausen et al., 2001).
The latter shows direct influence on the Galapagos Hot Spot, adding to the heterogeneous nature of the plate and result- ing in three different morphotectonic domains recognized by von Huene et al. (2000): a northwestern section with smooth relief, which contrasts with a central seamount province out- lining a rough–smooth boundary, and a southeastern domain characterized by the Cocos Ridge. These morphotectonic do- mains correlate with significant changes in Moho depth for the Cocos Plate from 8 to 10 km for the EPR section (Sal- larès et al., 2001), to 10 to 12 km for the seamount province (Walther, 2003; von Huene et al., 2000) and a maximum of 18.5 km for the crust of the Cocos Ridge (Sallarès et al., 2003).
The arrival of the Cocos Ridge to the trench and its ef- fects on the subduction zone are still controversial subjects.
Arrival time estimations range from 5–1 Ma, but the latest re- searches place the event at the early Pleistocene (Vannucchi et al., 2013) or late Pliocene (Morell et al., 2014). Hypothe- sis about the tectonic style include collision (LaFemina et al., 2009), flat subduction (Kolarsky et al., 1995), and steep angle subduction (Arroyo et al., 2003; Dzierma et al., 2011). Shal- low or flat subduction is still commonly referred to explain forearc shortening, regional uplift, and Pleistocene decrease and termination of volcanic activity in southeastern Costa Rica (e.g., Fisher et al., 2004; Sitchler et al., 2007). However, tectonic reconstructions (MacMillan et al., 2004; Lonsdale, 2005) and recent results from local ocean drilling (Vannuc- chi et al., 2013) require further tectonic events –besides the arrival of the Cocos Ridge to the trench – to explain the evo- lution of this region.
Convergence rates are variable for the different domains with 85 mm yr−1 for the northwestern EPR section and 90 mm yr−1 for the Cocos Ridge domain (DeMets et al., 1994). Furthermore, oblique subduction takes place along the seamount province, with a 10◦counterclockwise difference in convergence direction relative to a trench normal vector (DeMets, 2001).
Subduction related volcanism occurs along the Central American Volcanic Arc (CAVA), which begins at latitude
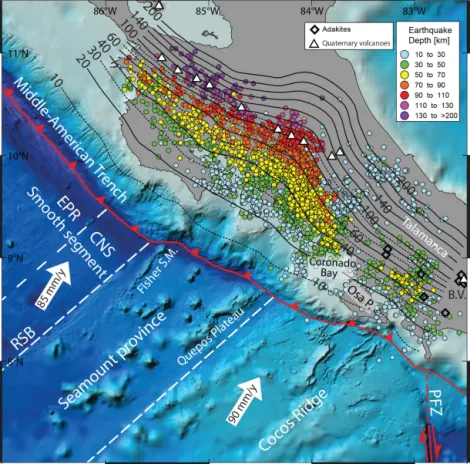
Figure 1. Tectonic setting of the Central American Isthmus. White lines show plate boundaries and major tectonic structures. Location of Quaternary volcanoes (black triangles) modified from Siebert and Simkin (2002). White arrows show direction and rate of plate motions relative to the Caribbean Plate (fixed) according to DeMets et al. (1994, 2010) and DeMets (2001). Plate boundaries modi- fied from Coffin et al. (1998) and Lonsdale (2005). Black lines de- pict the coastline and international borders. C.R.: Costa Rica; E.S.:
El Salvador; Guatm.: Guatemala; Jam.: Jamaica; CCRDB: Central Costa Rica Deformed Belt; MPFS: Motagua–Polochic Fault Sys- tem; ND: Nicaragua Depression; NPDB: North Panamá Deformed Belt; PFZ: Panamá Fracture Zone; RSB: rough–smooth boundary modified from Hey (1977); SITF: Swan Islands Fault; SR: Sandra Rift (de Boer et al., 1988). White contour represents the−2000 m bathymetric level outlining the Cocos Ridge, bathymetric data from global multi-resolution topography by Ryan et al. (2009).
15◦N and continues 1100 km parallel to the MAT, ending at the Irazu–Turrialba volcanic complex in central Costa Rica (Fig. 1). At this point, the CAVA is interrupted by a 190 km gap in the Quaternary volcanism in the Talamanca region.
This gap ends at the Baru volcano, the only major Quater- nary volcanic vent located in the eastern edge of the isthmus.
Seismic tomography studies have been carried out in Nicaragua and northwestern Costa Rica by (Syracuse et al., 2008; DeShon et al., 2006), in central Costa Rica by (Arroyo et al., 2009; Dinc et al., 2010); likewise, a comprehensive study of the Costa Rican subduction zone was performed by Husen et al. (2003b). A previous work on the geometry of the subduction zone based on earthquake hypocenters was published by Protti et al. (1994), who describe a segmenta- tion of the subducting slab in northwestern Costa Rica and interpret a change in its dipping angle as a tear or sharp con- tortion. Moreover, those authors propose a termination of the
deep intraslab seismicity in southeastern Costa Rica and in- terpret it as a shallow underthrusting of the Cocos Ridge.
Like Protti et al. (1994), Husen et al. (2003b) also observe a gradual decrease in the maximum depth of the intraslab seis- micity from northern to southern Costa Rica, but they did not find evidence of a slab tear. More recently, Dzierma et al. (2011) modeled a steeply dipping slab to a depth of ap- proximately 70 to 100 km based on receiver function analysis for the northwestern part of the Talamanca region. Further- more, local earthquake data from a temporal network show evidence of a steep slab down to∼70 km in southern Costa Rica (Arroyo, 2001; Arroyo et al., 2003).
Eastward from the PFZ, the boundary between the Caribbean and the Nazca plates in southern Panama is marked by a segment of the trench which, according to Lons- dale and Klitgord (1978), has transitioned since the Late Miocene to a strike-slip boundary after a period of 18 to 20 Ma. of subduction. However, de Boer et al. (1988) pro- pose a reactivation of the subduction 3.4 to 5.3 Ma. ago, and consider the existence of a recent low angle subduction.
The Caribbean coast of Costa Rica appears segmented into a northwestern section extending to the Hess Escarpment and the slope of the Nicaragua Rise, and a southeastern section defined by the North Panama Deformed Belt. According to Marshall et al. (2000), this fold-and-thrust belt is linked with the MAT through the Central Costa Rica Deformed Belt, a diffuse fault zone outlining the western boundary of the Panama Microplate.
3 Data
3.1 Seismological data
Recent seismological studies (DeShon et al., 2003, 2006; Ar- royo et al., 2009) have been used to constrain the slab geom- etry of the gravity model down to depths of∼40–50 km. In order to constrain the deepest parts of the model, earthquakes from four different data bases were used or relocated in this study, as will be described in Sect. 5.1: the catalogue from Husen et al. (2003a); the catalogue from the National Seis- mological Network (RSN in Spanish); the catalogue from the Arenal and Miravalles Seismological and Volcanological Observatory (OSIVAM in Spanish); and the Boruca network catalogue.
The earthquake catalogue from Husen et al. (2003a) con- sists of nearly 4000 events recorded in the period 1984–1997 by the two permanent networks in Costa Rica, RSN and the Costa Rican Volcanological and Seismological Observatory at the National University of Costa Rica (OVSICORI-UNA in Spanish). Those authors used the data to derive a tomo- graphic model of the whole country.
The RSN records seismic activity since the early 1980s, mainly with short-period, vertical-component stations, up to 2010 (Fig. 2), when new broadband equipment was acquired.
This study contemplates the period 2004 back to 1991, the year when digital recording started. During that interval, good station coverage was achieved only for central Costa Rica. Because of this, two additional local catalogues were examined in order to add to the amount of well-constrained seismicity toward the northwest and southeast. In northwest Costa Rica, the RSN operates the permanent network from Arenal and Miravalles Seismological and Volcanological Ob- servatory (OSIVAM) since 1994 (Fig. 2). Originally intended to monitor the seismic activity around the Arenal and Mi- ravalles volcanoes, the network has expanded in the last decade with two more permanent subnetworks around the Tenorio and Rincon de la Vieja volcanoes and several tempo- rary projects (Fig. 2). The network configuration has varied accordingly over time. At present, the subnetworks consist of four to eight, three-component, short-period stations each, and one broadband station at the Tenorio Volcano. Other tem- porary stations have been placed at different times in the Nicoya Peninsula area and toward the border with Nicaragua.
The catalogue from OSIVAM used in this study covers from October 2006 until December 2010, a period when all four permanent subnetworks were recording simultaneously, and includes readings from 44 stations (Fig. 2).
The temporary Boruca network was operated by RSN in southeastern Costa Rica between May 1998 and November 2001 (Arroyo, 2001). This network consisted of two vertical- component and five three-component stations, all equipped with short-period seismometers. Readings from five short- period stations from Panama were added to the data set, im- proving the coverage eastward (Fig. 2). Earthquakes deeper than 40 km recorded by RSN in southeastern Costa Rica dur- ing 2008–2013 were added to this catalogue, taking advan- tage of new permanent and temporary stations installed since 2008 (Fig. 2).
3.2 Gravity data
The EGM2008 combined geopotential model (Pavlis et al., 2012) was used as the source of gravity data for the 3-D density model, and was obtained through the International Center for Global Earth Models (ICGEMs, available at http:
//icgem.gfz-potsdam.de/ICGEM/ICGEM.html, 2014). With a maximum spatial resolution of approximately 10 km, this geopotential model combines data from the GRACE satel- lite mission, as well as offshore satellite altimetry data and onshore surface stations data (where available), which are reduced to a 50×50 grid. To this date, the latest combined geopotential model available is the EIGEN-6C (Shako et al., 2014), which additionally includes data from the LAGEOS and GOCE satellite missions. However, for purposes of con- sistency with regional lithospheric density modeling carried out for Central America (Lücke, 2014), and to resolve the shorter wavelengths obtained from a higher degree, the local density model was based on EGM2008.
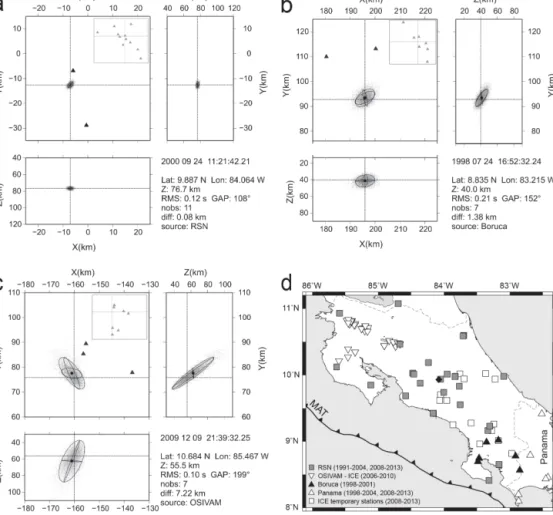
Figure 2. Density scatter plots of representative earthquakes for each quality class: (a), (b), and (c) used in this study (see text) and seismic stations map (d). In the map, squares represent RSN stations, inverted triangles OSIVAM stations and black triangles Boruca stations (see text for network descriptions). The black dented line marks the MAT axis. Scatter plots: plan view inx–ydirection and cross sections in x–zandy–zdirections are shown. The intersection of the dashed lines marks the maximum likelihood hypocenter locations. Black circles denote expectation hypocenter locations. Projection of the 68 % confidence ellipsoid is shown by black lines. The insets include all the seismological stations (triangles) used to locate the earthquakes (intersection of bold lines). Nobs: number of observations, diff: difference between maximum likelihood and expectation hypocenter locations.
In order to assess which individual data set was adequate for the density modeling, different anomalies were calculated and compared with surface station data. A detailed analysis of a data subset for Costa Rica was carried out by Köther et al. (2012). To provide a data set consistent with previ- ous solid Earth modeling (Lücke et al., 2010; Lücke, 2014), in this study, the Bouguer anomaly was calculated from the gravity disturbance. The gravity disturbance is calculated for a given point on the Earth’s surface; for the satellite-derived gravity disturbance data used for this study, the downward continuation takes place between the orbit and the surface of the Earth. Further discussion on the use of gravity anoma- lies and disturbances in solid Earth modeling has been pre- sented by Li and Götze (2001). Onshore, the effect of the Bouguer plate was subtracted from the value of the gravity disturbance, using the orthometric height at the topographic
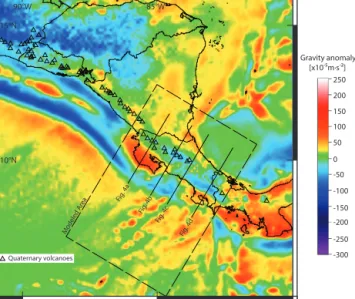
level as station elevation, which results in Bouguer anomaly values. For offshore data, values equivalent to the free air anomaly were obtained for stations located on the ocean sur- face. Figure 3 shows a compilation of the onshore Bouguer anomaly and the offshore free-air anomaly for the study area.
4 Methods
4.1 Earthquake relocation
The 3-DP wave velocity model from Husen et al. (2003a) and the minimum 1-D model for Costa Rica from Quintero and Kissling (2001), were used to relocate RSN, Boruca, and OSIVAM databases with the non-linear probabilistic ap- proach (Tarantola and Valette, 1982; Moser et al., 1992) im- plemented in the software package NonLinLoc (Lomax et
Gravity anomaly [x10-5m·s-2]
250 200 150 100 50 0 -50 -100 -150 -200 -250 -300 Fig. 4a
Fig. 4b Fig. 4c
Fig. 4d Modeled A
rea
Quaternary volcanoes
90°W 85°W 15°N
10°N
Figure 3. Gravity field data for the Central American isthmus and surrounding areas. Onshore Bouguer anomaly and offshore free- air anomaly calculated for this study from gravity disturbance data from EGM2008 (Pavlis et al., 2012). Location of the cross sections shown in Fig. 4 and the area of the local scale density model for Costa Rica are indicated in black. Location of Quaternary volcanoes (triangles) modified from Siebert and Simkin (2002). International borders and coastline are shown as black lines.
al., 2000). The approach relies on the use of normalized and unnormalized probability density functions to convey the available knowledge about the values of parameters. When the density functions – given the a priori information on the model parameters and on the observations– are indepen- dent and the theoretical relationship can be understood as a conditional density function, a complete, probabilistic so- lution can be expressed as an a posteriori density function (PDF) (Tarantola and Valette, 1982). The final hypocenter locations are given by their maximum likelihood value, i.e., the minimum misfit point of the complete PDF. Further de- tails are given by Tarantola and Valette (1982) and Moser et al. (1992).
The PDF solution includes location uncertainties due to the spatial relation between the network and the event mea- surement error in the observed arrival times, and errors in the calculation of theoretical travel times. Because error es- timates are included through covariance matrices and the so- lution is fully nonlinear, location uncertainties may assume irregular and multimodal shapes. In such cases, traditional error ellipsoids fail to represent the location error (Husen and Smith, 2004). NonLinLoc also provides traditional Gaussian estimates, like the expectation hypocenter location and the 68 % confidence ellipsoid (Lomax et al., 2000).
4.2 Gravity modeling
The density model was prepared by means of 3-D interactive forward modeling of gravity data using the IGMAS+soft- ware (Schmidt et al., 2010). With this software, parallel cross sections are constructed and can be modified interactively.
Between these cross sections, the 3-D structure is triangu- lated to form polyhedra of constant density, which represent the structure of the subsurface. The calculation of the effect on the gravity field from each polyhedron is carried out by the algorithm of Götze (1976), and Götze and Lahmeyer (1988).
The calculated gravity field is then compared with the mea- sured gravity data to achieve the best fit. Available geophys- ical data were incorporated as constraints to the model and visualized in three dimensions to aid the interactive model- ing. Recently, a regional model of Central America (Lücke, 2014) was achieved using 47 cross sections constructed from the Yucatan Peninsula to eastern Panama. This model is de- scribed in Sect. 5.2. From the regional density model, a sub- set was defined and further detailed by taking into account the constraining seismological data prepared for this research and the previously available geophysical data (see Sect. 4.2.1 for more details). For this area, 24 cross sections were con- sidered and modeled in detail with emphasis on the subduct- ing slab and the integration with the seismological results for Costa Rica.
In this study, the lithospheric density distribution was modeled in three dimensions for Costa Rica, to a depth of 200 km. Previous investigations by Tassara et al. (2006) achieved a 3-D lithospheric density model for the South American subduction zone through a similar method, from which the slab geometry and the density distribution were modeled to a depth of 400 km.
4.3 Geophysical constraints on geometry and structure In addition to the relocated earthquake hypocenters, geo- physical constraints on the geometry of the plate interface, the lithospheric segmentation and its physical properties, were previously included in the process of forward den- sity modeling. Wide angle seismic and seismic reflection cross-sections by Ye et al. (1996), Stavenhagen et al. (1998), Sallarès et al. (2001), von Huene et al. (2000), Ranero et al. (2003), Walther (2003), and Sallarès et al. (2003) pro- vide constraints on the geometry of the plate interface and the structure of the subducting and overriding plates. Local earthquake seismic tomographies by Husen et al. (2003a), DeShon et al. (2006), Syracuse et al. (2008), and Arroyo et al. (2009) provide 3-D constraints on the physical proper- ties of the subduction system. Receiver functions by Dzierma et al. (2010, 2011), respectively provide insights into the structure of the overriding plate and the geometry of the plate interface for the northwestern end of the Talamanca Range. Additionally, magneto-telluric surveys by Brasse et al. (2009) and Worzewski et al. (2010) provide information
on the electrical properties of the lithosphere for northwest- ern Costa Rica and the fluid cycle of the subduction system.
5 Results 5.1 Seismology
Analysis of probabilistic earthquake relocation uncertainties in 3-D velocity models (Husen et al., 2003a; Husen and Smith, 2004) show that, in general, hypocenter locations with less than six P wave observations are poorly constrained, even with a good azimuthal distribution of stations (coverage gap < 180◦). In addition, well constrained focal depths need at least one station located within a distance similar to the focal depth, regardless of the total number of observations.
These criteria were used in this study to select the data sets from the initial seismic catalogues. In total, 1145 events were selected, controlled, and relocated.
The RSN, OSIVAM, and Boruca data sets were relocated and classified into four quality classes using NonLinLoc.
The 3-DP wave velocity model of Costa Rica from Husen et al. (2003a) was used for the first two data sets. How- ever, the relocation of the Boruca data set with that veloc- ity model was hindered because several Boruca–Panama sta- tions are located out of its borders (Fig. 2). Instead, the min- imum 1-DP wave model for Costa Rica from Quintero and Kissling (2001) was used to relocate the events from south- eastern Costa Rica. This 1-D model was chosen because it served as an initial model for the tomography by Husen et al. (2003a). In all three cases, only P wave readings were considered.
The Oct-Tree importance sampling algorithm included in NonLinLoc was used to achieve an accurate, efficient and complete mapping of the earthquake location PDF in the 3-D space. The Oct-Tree method uses recursive subdivision and sampling of cells to generate a cascade of sampled cells. The density of sampled cells follows the PDF values of the cell center, leading to a higher density of cells in the areas of higher PDF (A. Lomax and A. Curtis, October-tree impor- tance sampling algorithm, available at http://alomax.free.fr/
nlloc/, 2015).
Large differences between the maximum likelihood and the expectation hypocenter locations can result from an ill- conditioned location problem (Lomax et al., 2000). Husen and Smith (2004) found that a difference greater than 0.5 km between both hypocenter estimations cause large uncertain- ties of several kilometers in epicenter and focal depth. Nu- merous scatter plots were investigated in order to confirm this observation for the data sets relocated in this work. Fur- ther following Husen and Smith (2004), the average of the three axes of the 68 % confidence ellipsoid was taken into account to refine location quality. Figure 2 shows example scatter plots for each quality class used in this study. The re-
location uncertainties for the tomography earthquake data set are analysed directly by Husen et al. (2003a).
Earthquakes in class D have an rms larger than 0.5 s and were not used. Events with location quality A, with well-defined PDFs, have differences between maximum- likelihood and expectation hypocenters of 0.5 km and lower, and maximum location uncertainties of 4 km. Differences above 0.5 km but under 3 km between both hypocenter es- timations, and average uncertainties lower than 4 km define quality B. Their epicenters and focal depths are still relatively well defined. Earthquakes with a maximum rms of 0.5 s and differences in hypocenter estimations higher than 3 km are classified as C. They show large location uncertainties, of which the confidence ellipsoid is a poor approximation. From all the relocated data sets, 65 % of the events have quality A, 16 % quality B, and 19 % quality C.
5.2 Regional scale slab geometry as a reference density model
The geometry of the Central American subduction zone was determined on a regional scale to serve as a reference model for the Costa Rican subset. In order to constrain the regional geometry of the subduction zone, hypocenters from the cata- logue of the Central American Seismic Center (CASC) were taken into account. The CASC catalogue includes earth- quakes with magnitudes above 3 and recorded by at least two national networks. The events selected for this study have a minimum of 8 readings, a coverage gap of less than 250◦, a maximum rms of 0.5 s and Gaussian uncertainties lower than 10 km in depth. Additionally, earthquake hypocenters from the catalogue of the National Earthquake Information Center of the United States Geological Survey were considered to constrain the regional slab structure for depths greater than 110 km, which were not resolved by the CASC network.
The regional scale model is intended to provide the 3-D general framework for the detailed interpretation of the Costa Rican subduction segment presented here. This is necessary in order to eliminate edge effects in the 3-D modeling by ex- tending the model outside of the area of interest up to a point in which the effect of the edges of the model is no longer significant for the modeled gravity in this area of interest.
The regional scale model considers the segmentation of the Central American crustal basement and the regional Moho structure for the Caribbean Plate published by Lücke (2014).
The geometry obtained from the regional model shows a uni- formly dipping slab for the segment between 91 and 86◦W.
The subduction angle steepens for the southern Nicaragua segment and carries over to northwestern Costa Rica. The largest heterogeneities in the geometry of the subduction zone are observed in the segment located eastward of the 86◦W longitude and will be described in detail in the next section.
5.3 Detailed density model for the Costa Rican subduction zone
Using the regional density model of Central America (Lücke, 2014) as reference, a subset with enhanced detail was mod- eled for Costa Rica considering the better quality and avail- ability of geophysical constraints. Off the coast of Costa Rica, the Cocos Plate was modeled with a density of 2.80 Mg m−3for the crust, 3.30 Mg m−3for the upper man- tle and 3.34 Mg m−3 for the asthenospheric mantle. Den- sity changes in the subducting slab were also modeled as an increase in density due to dehydration of the mantle and crust. The density of the crust of the subducting slab was constrained by petrological modeling by Bousquet et al. (2005), taking into account the lithostatic pressure on the plate interface and the temperature from thermal mod- eling by Peacock et al. (2005). A homogenous upper man- tle with a density of 3.32 and a 3.34 Mg m−3asthenospheric mantle, were modeled for the overriding plate, setting the lithosphere-asthenosphere boundary at a depth between 75 and 85 km. The crustal basement for the Caribbean Plate in Costa Rica was divided into a southeastern block with a den- sity of 2.90 Mg m−3considering an overall basaltic composi- tion of the basement related to the Caribbean Large Igneous Province (Hoernle et al., 2004), and a northwestern block with a density of 3.00 Mg m−3 for serpentinized ultramafic material related to the Mesquito Composite Oceanic Terrane (Baumgartner et al., 2008). Densities in the upper crust of the Caribbean Plate are variable and were modeled depend- ing on local structures, such as predominant fore- and back- arc sedimentary basins (2.40–2.55 Mg m−3), volcanic infill along the arc (2.60–2.70 Mg m−3) and dioritoid intrusions in southeastern Costa Rica (2.75 Mg m−3). The initial density of the crustal units of the Caribbean Plate was constrained byVpvalues and the correlation with local geology and re- gional tectonic models. Lücke (2014) discusses in detail the constraints of the densities used for the 3-D model.
5.4 Local integrated interpretation of slab geometry for Costa Rica
In order to achieve a 3-D interpretation of the geometry of the subducting slab, the earthquake hypocenter results were integrated into the density model. By means of 3-D visu- alization and projection of results onto 2-D cross sections (Fig. 4), the density model was modified interactively to achieve the best fit with the measured gravity data by con- sidering the structure outlined by the seismicity. The joint in- terpretation allowed constraining the overall geometry of the density model, while simultaneously accounting for a more precise determination of the plate interface.
The results of this joint interpretation are shown in Figs. 4, 5, and 6. Considerable changes in slab dip as well as in the density distribution of the subducted oceanic crust are observed. The Cocos Plate segmentation observed off the
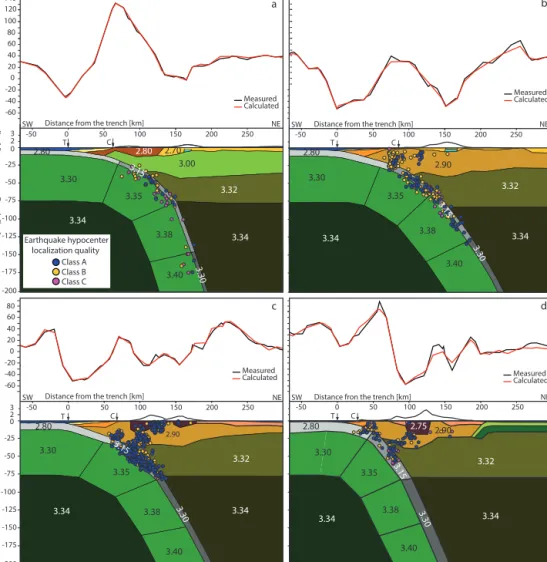
coast of Costa Rica (von Huene et al., 2000) carries over to the structure of the subducted slab. The northwestern section of the Cocos Plate (originated from the EPR and CNS) was modeled with a crustal thickness of 6–8 km and subducts at a 14◦angle to a depth of 30 km from which the slab dip steep- ens to a 44◦angle to a depth of 80 km and finally 71◦to the terminal depth of the model at 200 km (Fig. 4a). For cen- tral Costa Rica, the slab dip transitions from a 15◦angle for the section between the trench and a depth of 30 km, 40◦to a depth of 80 km, and a relatively shallow angle of 58◦to a depth of 200 km for the final section (Fig. 4b). This shallower section of the slab extends to the southwest, toward the end of the Quaternary Volcanic Arc, and corresponds to the sub- duction of the seamount province located between the Fisher Seamount and the Quepos Plateau on the oceanic plate.
At the southeastern end of the Quaternary Volcanic Arc, the dip angle of the slab beneath 80 km deepens from 40 to 60◦ (Fig. 4c). When observed as plotted depth contours (Fig. 5), this change in slab dip takes place 20 km to the northwest of the NE–SW axis formed by the Irazu and Tur- rialba volcanoes. It also coincides with the location of a fea- ture in the gravity field, which separates this volcanic com- plex from the three other stratovolcanoes that constitute the Central Cordillera of Costa Rica. This segmentation of the local Bouguer gravity low has been described by Lücke et al. (2010) for central Costa Rica, based on a local database compiled from surface gravity measurements. Southwest of this alignment, toward the Talamanca region, the earthquake hypocenters outline a steeply subducting slab with a 50◦an- gle, to a depth of 70 km. This structure is consistent with gravity modeling performed for this investigation. The den- sity model considers a continuous slab structure with a 64◦ angle for the final section, to a depth of 200 km (Fig. 4d).
The geometry observed for the sections depicted in Fig. 4c and d is also on par with local earthquake seismic tomog- raphy results by Dinc et al. (2010), and receiver functions results published by Dzierma et al. (2011). Constraints by the latter publication extend approximately 50 km southeast of the termination of the volcanic arc in Costa Rica, partially covering the volcanic gap of Talamanca.
Intraslab seismicity in the southeastern part of Costa Rica is interrupted by a 55 km long gap in the onshore area ad- jacent to the Coronado Bay (Fig. 5), and then resumes to the northeast of the Osa Peninsula (Arroyo, 2001). In this southeasternmost section of the MAT, the seismicity reaches 70 km in depth (Fig. 4d), and outlines a subducting slab con- sistent with the geometry observed westward of the seismic gap in the Coronado Bay region (Arroyo et al., 2003). In spite of the presence of such a gap, the gravity field does not show segmentation that could be related to major changes in the subduction geometry. Overall, the results of the density modeling suggest the existence of a continuous slab structure along the trench and in depth.
The vertical extent of the Wadati–Benioff zone seismic- ity correlates with the section of the subducted oceanic crust
3.00
3.32
3.34 3.34
2.80 2.70
3.40 3.30
3.35
3.38
3.30 0 2.80
-50
-100
-150 -25
-75
-125 23
-175 -200
Distance from the trench [km]
SW NE
T 50C
-50 100 150 200 250
Measured Calculated
Depth [km]Gravity anomaly [x10-5m·s-2]
0
2.90
3.32
3.34 3.34 2.80
3.15
3.40 3.30
3.35
3.38 Distance from the trench [km]
SW NE
T 50 C
-50 100 150 200 250
3.30 0
2.90
3.32
3.34 3.34
2.80
3.40 3.30
3.35
3.38 Distance from the trench [km]
SW NE
T 50C
-50 100 150 200 250
3.30 [km] 5xDepth [km]Gravity anomaly [x10-5m·s-2]
0
2.90
3.32
3.34 3.34 2.80
3.40 3.30
3.35
3.38 Distance fron the trench [km]
SW NE
T C 50
-50 100 150 200 250
3.30 0
2.75 a
0 -20 -40 -60 60 40 20 100 80 120 140
0
-50
-100
-150 -25
-75
-125 2
-175 -200 3 0 -20 -40 -60 60 40 20 80
Measured Calculated
Measured Calculated Measured
Calculated
[km] 5x
b
c d
3.15
3.15
3.15
3.15 Class A
Class C Class B Earthquake hypocenter localization quality
Figure 4. Vertical cross sections from the local scale 3-D density model and relation to the integrated earthquake hypocenter locations for this study. The upper panels show the fit between the measured (black) and calculated (red) gravity anomaly. Circles show the earthquake hypocenters color coded for classes: A (blue), B (yellow) C (magenta). The modeled density distribution of the subducted oceanic crust is depicted in grey tones: 2.80 Mg m−3(light grey), 3.15 Mg m−3(medium grey), 3.30 Mg m−3(dark grey). Location of the cross-sections is shown in Fig. 3. Letters “T” and “C” depict the trench and coastline respectively.
with a density of 3.15 Mg m−3. This part of the slab rep- resents the zone in which dehydration reactions occur. The deepest part of the modeled subducted crust was assigned a density of 3.30 Mg m−3to account for an anhydrous slab.
The downdip extension of the 3.15 Mg m−3zone is variable.
At the southeastern part of Costa Rica, the edge of this zone correlates with the lithosphere-asthenosphere boundary mod- eled between 70 and 80 km. However, in the northwestern part of Costa Rica, the 3.15 Mg m−3extends to a depth be- tween 130 and 160 km.
6 Discussion
The origin of the Wadati–Benioff seismicity has been a subject of discussion since its discovery, because at depths
greater than ∼30 km, the pressure should prevent brittle or frictional processes. It is commonly believed that the intermediate-depth seismicity is enabled by slab dehydration (Kirby et al., 1996; Hacker et al., 2003). As the slab sinks, metamorphic reactions liberate fluids from hydrous phases.
Dehydration increases pore pressure, thus reducing normal stress enough to bring the system into the brittle regime.
Yet, the exact relationship between dehydration and earth- quake nucleation is still not well understood. Earthquakes could be generated by dehydration embrittlement, creating new faults (Zhang et al., 2004) or reactivating pre-existing weak zones (Peacock, 2001), depending on where hydration occurred (Ranero et al., 2005).
Hydration of the downgoing slab seems to take place mainly near the trench, where water percolation and min- eral alteration occur at extensional bend faulting in the crust
Figure 5. Slab depth contours for Costa Rica from the integrated interpretation of seismological and density modeling results. White arrows indicate direction and rate of plate motion from DeMets (2001) and DeMets et al. (1994). Earthquake depths are indicated in the inset.
Tectonic features on the oceanic plate after von Huene et al. (2000) and Barckhausen et al. (2001). The red dented line represents the axis of the Middle American Trench. EPR: East Pacific Rise, CNS: Cocos–Nazca Spreading Centre, PFZ: Panama Fracture Zone. RSB: Rough Smooth Boundary. B.V.: Baru Volcano. Bathymetric data from global multi-resolution topography by Ryan et al. (2009). Open diamond symbols show the location of adakite samples from Hoernle et al. (2008) and Gazel et al. (2011).
and in the upper few kilometers of the mantle (Kirby et al., 1996), or even deeper, 15–30 km into the mantle (Peacock, 2001; Ranero et al., 2003). This bend faulting has been im- aged off the coast of Middle America by high-resolution seafloor mapping, near-vertical reflection lines, and outer- rise seismicity (Hinz et al., 1996; von Huene et al., 2000;
Ranero et al., 2005; Grevemeyer et al., 2007; Lefeldt and Grevemeyer, 2007). Ranero et al. (2005) propose a model in which seismicity starts between 60–80 km depth, when de- hydration of the oceanic crust reactivates the upper segment of bend-faults, causing concentration of earthquakes on the upper part of the slab. Deeper than∼100 km, eclogitization is completed; here or slightly deeper, dehydration of the slab mantle occurs, reactivating bend-faults and generating seis- micity within the upper slab mantle. The authors point out that this model may not be applicable to subduction of young lithosphere and broad aseismic ridges.
Tomographic studies (Arroyo et al., 2009; DeShon et al., 2006; Husen et al., 2003a) indicate the existence of a low- velocity hydrous oceanic crust in the northwestern and cen-
tral Costa Rica subducting plate. The petrologic modeling from Husen et al. (2003a) shows a good correlation between the predicted locations of hydrous minerals in the oceanic crust and the hypocenters of intermediate-depth earthquakes, further supporting the hypothesis of the latter being enabled by dehydration.
In the following, the potential relationship between slab hydration at the outer rise, the vertical and lateral changes in the slab density model, and the terminal depth of the intraslab seismicity along the Costa Rican margin will be discussed. In addition, an alternative scenario in which a slab detachment is simulated beneath southeastern Costa Rica is analysed in Sect. 6.2.
6.1 Continuous slab model for Costa Rica
In northwestern Costa Rica, the geometry of the subducting slab is consistent with the trench-normal subduction of the 24 to 25 Ma. oceanic crust generated at the EPR (Barckhausen et al., 2001). This section presents a steeply subducting slab (Fig. 4a) with a geometry similar to that observed for the
2.90
3.32
3.34 2.80
3.30
3.35 Distance fron the trench [km]
SW NE
T C
50
-50 0 100 150 200 250
2.75
Measured Calculated
3.15 [km] 5xDepth [km]Gravity anomaly [x10-5m·s-2]
0
-50
-100 -25
-75
-125 2
-200 3 0 -20 -40 -60 60 40 20 80
Class A Class C Class B Earthquake hypocenter localization quality
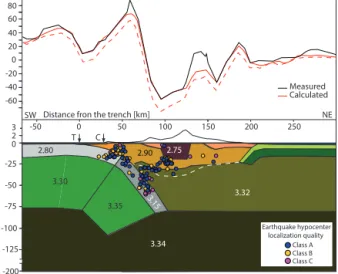
Figure 6. Cross section of the alternative density model consid- ering a slab detachment at 80 km for the Cocos ridge. The upper box shows the fit between the measured (black) and calculated (red) gravity anomalies, the red stippled line shows the calculated grav- ity anomaly for the alternate slab detachment model with the Moho structure from Lücke (2014). The lower box shows the alternative model assuming a slab detachment at a depth of 70 to 80 km under the Talamanca region. White stippled line represents the location of the Moho from Lücke (2014) constrained by receiver function results from Dzierma et al. (2010). Blue dots show the location of earthquake hypocenters obtained for this study.
Nicaraguan section of the MAT (Syracuse et al., 2008). Be- tween the northwestern part of the volcanic arc and the cen- tral region of Costa Rica, a change in slab dip is observed.
For the central part, results show slab dip angles between 40 and 50◦compatible with images from previous local earth- quake tomographies by Arroyo et al. (2009) and Husen et al. (2003a). This section of the slab corresponds to the sub- duction of the seamount province of the Cocos Plate (von Huene et al., 2000). The northwestern and central regions are separated by a transition zone in which the slab dip beneath 40 km decreases from 75 to 45◦(Fig. 5). A previous study from Protti et al. (1994) introduces a sharp contortion of the slab to accommodate this change in the subduction angle. In the model presented here, however, the change in dip is ob- served but is achieved through a transition zone, by consider- ing oblique subduction of the seamount section. For this re- gion, the trend of the slab contours changes from trench par- allel for the northwestern region, to a 17◦offset from trench parallel for the transition zone. This change in the strike of the depth contours is consistent with the section of the mar- gin where oblique subduction occurs, located to the southeast of the rough–smooth boundary (Fig. 5).
Southeast of the Central Cordillera of Costa Rica mountain range, seismicity within a steep slab is observed to a depth of approximately 75 km, extending southwest to the Coronado Bay. The presence of a steeply subducting slab for this re-
gion is supported by seismic tomography results from Dinc et al. (2010) to a depth of 40 km and receiver functions re- sults by Dzierma et al. (2011), where a steep slab is imaged to a depth of 100 km.
The seismicity relocated in southeastern Costa Rica shows a subducting slab dipping at a 50◦angle for the area between the Osa Peninsula and Talamanca to a depth of ∼70 km (Figs. 4d and 5). These results, along with the receiver func- tions and seismic tomography data immediately to the north- west, were included as constraints into the density model.
Regarding the slab geometry, the results from the 3-D density modeling agree with the seismological observations. Further- more, the density model shows no large scale lateral segmen- tation of the subducting oceanic lithosphere for the area in which a gap in the seismicity is observed (inland of the Coro- nado Bay, Fig. 5). This suggests that a continuous subducting slab is present beneath the margin from central Costa Rica to the Panama Fracture Zone.
Considering an estimated arrival of the Cocos Ridge at the trench during the late Miocene (von Huene et al., 2000), and assuming even a conservative convergence of half the current rate (estimated by DeMets et al. (2010) at∼90 mm yr−1), it is likely that a large segment (in the order of few hundreds of kilometers) of the current subducted slab is modified by the presence of the ridge. Estimates of a younger age for the arrival of the ridge place the event earlier than 3 Ma. (Morell et al., 2014; Vannucchi et al., 2013). A late Pliocene, or early Pleistocene arrival of the ridge would still account for the presence of a modified slab at depths exceeding 200 km.
Evidence of a relatively steep slab directly beneath south- eastern Costa Rica is presented for the first time with this study. This result is surprising to some extent, but might be interpreted in the light of recent numerical models (Mason et al., 2010) and analogue experiments (Martinod et al., 2013) on aseismic ridge subduction. They show that effects ob- served inboard of subducting ridges, such as diminution of the slab dip, indentation of the overriding plate, inhibition of arc volcanism, rapid forearc uplift, and back arc defor- mation, appear only progressively. At the beginning of ridge subduction, the ridge is pulled downwards by the dense slab, and∼300 km of ridge subduction perpendicular to the trench are required to observe a modification of the slab dip (Mar- tinod et al., 2013). As previously hypothesized by Dzierma et al. (2011), the southeastern segment of the Costa Rica sub- duction zone may be presently undergoing a reconfiguration towards shallow ridge subduction.
Lateral changes in the density structure of the slab are limited to the section of the subducted oceanic crust with a density of 3.15 Mg m−3(Fig. 4). Taking into account the maximum depth of the seismicity, this 3-D polyhedron was modeled to represent the zone in which dehydration reac- tions occur, contrasting with a 3.30 Mg m−3zone for an an- hydrous slab. From the joint seismological-density model- ing and interpretation, an overall trend is observed in which the maximum depth for the dehydrating oceanic crust de-
creases toward the southeast, starting at 160 km in the north- west, following with 125 km for the central region and reach- ing a depth of 75 km for southeastern Costa Rica. This trend may be related to the extent of hydration of the upper mantle in the subducting oceanic plate in the form of serpentiniza- tion. Petrological models by Husen et al. (2003a) place the boundary in which the subducted crust transforms to anhy- drous eclogite at 100 km for southeastern Costa Rica and at 130 km for northwestern Costa Rica, thus showing a similar trend. The depth of the 3.15–3.30 Mg m−3boundary in the subducted crust of the density model shows a good correla- tion between the termination of the seismicity and the depth (Fig. 4).
Within the conceptual model from Ranero et al. (2005), the degree of bend faulting occurring in the outer rise would directly influence the characteristics of the intraslab seis- micity by determining both the extent of hydration through serpentinization of the upper mantle, and the segmentation of the slab by means of fragile deformation. In this sense, the Costa-Rican subduction zone provides a wide spectrum of environments with different degrees of bending-related faulting. The smooth segment in which the oceanic plate presents pervasive, trench-parallel, bending-related faulting, subducts off Central America and northwestern Costa Rica (Hinz et al., 1996; von Huene et al., 2000; Ranero et al., 2003a; Grevemeyer et al., 2007; Lefeldt and Grevemeyer, 2007). In the Central Pacific (seamount) segment, however, the thicker oceanic crust promotes a smaller outer rise and less-developed faulting (von Huene et al., 2000), while the Cocos Ridge section in the southeast virtually lacks bending- related faulting (Ranero et al., 2003a). Moreover, Rüpke et al. (2002) show considerable differences in serpentinization of the upper mantle for the Cocos Plate at its smooth segment in comparison with the seamount province. In Nicaragua, the subducting oceanic plate generated at the EPR shares charac- teristics with the oceanic plate off the coast of northwestern Costa Rica in terms of origin, composition, age and thick- ness (Barckhausen et al., 2001; von Huene et al., 2000).
Also, the tectonic fabric observed in bathymetric data for Nicaragua indicates the same magnitude of normal faulting of the outer rise described off the coast of Costa Rica by Ranero et al. (2003a). For this section of the Cocos Plate, Rüpke et al. (2002) estimate a 10 km thick serpentinized mantle layer with a 5.5 wt % of water; whereas for central Costa Rica, a 5 km thick 2 wt % H2O layer is estimated.
This strong contrast in the serpentinization of the up- per mantle via bend-faulting on the outer-rise, indicates that the hydrated mantle may reach greater depths in northwest- ern Costa Rica, thus accounting for the greatest depth of the 3.15 Mg m−3 zone, where intraplate seismicity nucle- ates. Off the coast of southeastern Costa Rica, the bending- related faulting is absent and the structure of the oceanic plate is heavily influenced by the Cocos Ridge, which features a thickened crust with maximum Moho depths of 18.5 km (Walther, 2003; Sallarès et al., 2003). The anomalous thick-
ness of the Cocos Ridge and the nearly absence of bending- related faulting near the trench may hinder the process of mantle serpentinization by the interaction with seawater in the outer rise. The graben on the ridge crest is bounded by trench orthogonal normal faults, filled with as much as 1 km of sediments, that predate the arrival of the ridge to the trench and most likely do not reach deep into the mantle (von Huene et al., 2000; Ranero et al., 2003a). It is suggested here, that the shallow depth to which intraslab seismicity is observed northwest of the Osa Peninsula may be related to a lower per- centage of chemically bound water in the slab due to the lack of mantle serpentinization achieved through bending-related faults that is observed to the northwest. Hence, the initial state of hydration of the upper mantle beneath the Cocos Ridge is considerably reduced, and the eclogitization depth for the slab under Talamanca may be anomalously shallow.
6.2 Alternative model
Southeastern Costa Rica is arguably the less well-understood region of the study area. It presents highly complex tecton- ics, which include the presence of the Cocos Ridge, an ex- posed forearc, the gap in the Quaternary volcanic activity, the uplifted Talamanca Range, and the outcrop of adakites.
A prior model of the slab geometry by Protti et al. (1994), based solely on earthquake hypocenters, does not report in- traslab seismicity eastward of the end of the Quaternary Vol- canic Arc in Costa Rica. This apparent lack of deep seis- micity, together with the presence of the gap in Quaternary volcanism and an OIB-type geochemical signature for the volcanic rocks in the area (Hoernle et al., 2008), has led to several interpretations for the source of the adakites found in southeastern Costa Rica and western Panama (Fig. 5) (de Boer et al., 1991; Drummond et al., 1995). The hypothesis imply the melting of the slab edge by interaction with hot mantle through either a slab window (Johnston and Thorkel- son, 1997; Abratis and Wörner, 2001) or a slab detach- ment (Gazel et al., 2011). These models contrast with the receiver function results from Dzierma et al. (2011) show- ing a steeply subducting slab beneath the northern edge of the Talamanca Range. By testing several alternative tectonic scenarios against their receiver functions results, the authors conclude that a slab break-off at a depth shallower than 70 km is not plausible. However, Dzierma et al. (2011) admit that deeper than 70 km, scattered signals may contaminate the receiver functions producing results similar to those from a steeply subducting slab.
As pointed out before, the seismological data presented here shows the termination of possible slab-related seismic- ity at a depth of approximately 70 km for the area located inland of the Osa Peninsula (Fig. 4d). The hypocenters show the presence of a steeply subducting slab at such depth and have been used to constrain the geometry of the 3-D den- sity model. However, in the primary density model, the con- tinuity of the slab to depths greater than∼70 km has been
modeled without seismological constraints. Considering the non-uniqueness of gravity modeling, as well as the inher- ent ambiguity of all the methods, the data uncertainty, the limited depth and extent of slab-related seismicity, the possi- ble effects of scattering on the receiver function results from Dzierma et al. (2011), and the presence of the OIB signa- ture in volcanic rocks of the Quaternary arc, an alternative model to the continuous slab was generated. In this model, the asthenosphere (with a density of 3.34 Mg m−3)replaces a segment of the subducting slab, as shown in Fig. 6.
The absence of a downgoing slab deeper than 80 km causes a misfit of 10–20×10−5m s−2between the measured and the calculated gravity. In order to achieve a proper fit, the lower crust material of the overriding plate (2.90 Mg m−3) must be replaced by lithospheric mantle material with a higher density (3.32 Mg m−3), thus requiring a considerably shallower Moho at km 28 (Fig. 6). Isostatic compensation along the Talamanca Range (which has the highest elevations of the southeastern Central American Isthmus) reduces the possibility of a shallow Moho. According to the Airy-type isostasy modeling of the Moho depth carried out by Dzierma et al. (2010), in the presence of mass load from the Tala- manca Range, the Moho reaches depths greater than 40 km.
Receiver function results from Dzierma et al. (2010) show a Moho at 35 km for areas of intermediate topography and be- comes deeper, though less constrained, below the areas with the highest topographic elevations. Furthermore, regional 3- D density modeling by Lücke (2014) shows Moho depths be- tween 32 and 36 km for the Talamanca Range in Costa Rica and Panama.
Those inconsistencies further support the preferred model of this study, featuring the presence of a continuous slab with a relatively steep angle in southeastern Costa Rica, as de- scribed in Sect. 6.1. In such a scenario, the melting may hap- pen through interaction with the mantle at the downdip pro- jection of the Panama Fracture Zone, where the lithospheric segmentation caused by the Cocos–Nazca boundary may al- low the subducted oceanic crust to come in contact with the mantle. The presence of the westernmost adakite outcrops might be explained by the migration of the triple junction toward the southeast proposed by DeMets (2001). Accord- ing to Gazel et al. (2011), this is on par with a 35 mm yr−1 migration in the adakites as evidenced by the age progres- sion established by means of40AR/39Ar dating. The study of Bindeman et al. (2005) mentions the Panamanian adakites in relation to the Panama Fracture Zone. For adakites in gen- eral, Bindeman et al. (2005) discuss the possibility that their origin may not necessarily be the melting of the slab and they propose two alternative interpretations for adakite petrogene- sis through melting processes in the overriding plate. One al- ternative mechanism may be the remelting of basalts or mafic cumulates near the base of the crust, while another less likely scenario is the high pressure crystallization differentiation of wedge derived calc-alkaline hydrous basaltic magmas. A re- cent study by Hidalgo and Rooney (2014) concludes that the
Baru Volcano, located in Panama close to the border with Costa Rica (Fig. 5), is adakitic and that its petrogenesis is more consistent with flux induced mantle melting than with melting of the subducting crust. This further questions the need of direct contact of the edge of the subducted oceanic crust with the mantle via a slab window or detachment in order to explain the adakites.
7 Conclusions
The gravity modeling and local earthquake relocation results were successfully interpreted in a joint model showing the 3-D structure of the slab beneath Costa Rica. The depth of the intraslab seismicity varies from∼220 km for the north- western part of Costa Rica, to 140 km for the central part and 70 to 75 km for the southeastern region. The depth reached by the intermediate density segment (3.15 Mg m−3) of the subducted oceanic crust varies laterally along the Costa Ri- can section of the convergent margin. The progressively shal- lower depth at which the change from 3.15 to 3.30 Mg m−3 occurs toward the southeastern segment of the Costa Rican subduction zone may be related to the initial state of hydra- tion of the lithosphere.
The two plausible models for the southeastern Costa Ri- can subduction zone derived from the joint gravity and seis- mological interpretation are the following: (a) a steeply sub- ducting slab, which becomes aseismic at a depth of approx- imately 75 km, due to less mantle hydration through serpen- tinization at the Cocos Ridge; and (b), a slab detachment oc- curring at a depth of 70 to 80 km and a shallow Moho un- derneath Talamanca. A significantly better fit between mea- sured and calculated gravity values, together with previously constrained Moho depths and the inferred presence of a slab structure at the northern edge of the Talamanca Range inter- preted from receiver functions (Dzierma et al., 2011), sug- gests that the presence of a continuous slab is more likely.
Acknowledgements. The authors would like to thank the National Seismological Network (RSN) and S. Husen for allowing the use of their earthquake catalogues for Costa Rica. W. Taylor, from Instituto Costarricense de Electricidad (ICE), who generously shared the OSIVAM catalogue, and C. Redondo for providing the CASC data. R. von Huene and S. Martínez-Loriente provided thoughtful comments and suggestions that greatly improved the manuscript. G. Alvarado, G. Soto and I. Grevemeyer contributed valuable discussions and encouraged the present study. O. Lücke thankfully acknowledges the support of the German Academic Exchange Service (DAAD) as well as the University of Costa Rica (UCR), and the Special Priority Program 1257 “Mass Transport and Mass Distribution in the Earth System” of the German Research Foundation (DFG).
Edited by: V. Sallares
References
Abratis, M. and Wörner, G.: Ridge collision, slab-window formation, and the flux of Pacific asthenosphere into the Caribbean realm, Geology, 29, 127–130, doi:10.1130/0091- 7613(2001)029<0127:RCSWFA>2.0.CO;2, 2001.
Arroyo, I. G.: Sismicidad y Neotectónica en la región de influen- cia del Proyecto Boruca: hacia una mejor definición sismogénica del sureste de Costa Rica, Licenciate Thesis, University of Costa Rica, San José, Costa Rica, 162 pp., 2001.
Arroyo, I., Alvarado, G. E., and Flueh, E. R.: Local seismicity at the Cocos Ridge – Osa Peninsula subduction Zone, Costa Rica, AGU Fall Meeting, 8–12 December 2003, San Francisco, USA, S52F–0174, 2003.
Arroyo, I. G., Husen, S., Flueh, E. R., Gossler, J., Kissling, E., and Alvarado, G. E.: ThreedimensionalP wave velocity struc- ture on the shallow part of the Central Costa Rican Pacific mar- gin from local earthquake tomography using off- and onshore networks, Geophys. J. Int., 179, 827–849, doi:10.1111/j.1365- 246X.2009.04342.x, 2009.
Barckhausen, U., Ranero, C. R., von Huene, R., Cande, S. C., and Roeser, H. A.: Revised tectonic boundaries in the Cocos Plate off Costa Rica: implications for the segmentation of the conver- gent margin and for plate tectonic models, J. Geophys. Res., 106, 19207–19229, 2001.
Baumgartner, P., Kennet, F., Bandini, A., Girault, F., and Cruz, D.: Upper Triassic to Cretaceous radiolaria from Nicaragua and northern Costa Rica – the Mesquito composite oceanic terrane, Ofioliti, 33, 1–19, 2008.
Bindeman, I. N., Eiler, J. M., Yogodzinski, G. M., Tatsumi, Y., Stern, C. R., Grove, T. L., Portnyagin, M., Hoernle, K., and Danyushevsky, L. V.: Oxygen isotope evidence for slab melting in modern and acient subduction zones, Earth Planet. Sc. Lett., 235, 480–496, doi:10.1016/j.epsl.2005.04.014, 2005.
Bousquet, R., Goffé, B., deCapitani, C., Chopin, C., Le Pichon, X., and Henry, P.: Comment on “Subduction factory: 1. Theoreti- cal mineralogy, densities, seismic wave speeds, and H2O con- tents” by Bradley, R. Hacker, Geoffrey, A. Abers, and Simon, M.
Peacock, J. Geophys. Res., 110, 3, doi:10.1029/2004JB003450, 2005.
Brasse, H., G. Kapinos, L. Mütschard, G. E. Alvarado, T.
Worzewski, and Jegen, M.: Deep electrical resistivity structure of northwestern Costa Rica, Geophys. Res. Lett., 36, L02310, doi:10.1029/2008gl036397, 2009.
Coffin, M. F., Gahaga, L. M., and Lawyer, L. A.: Present-day Plate Boundary Digital Data Compilation, Technical Report no. 174, 5 pp., University of Texas Institute for Geophysics, Austin Texas USA, 1998.
de Boer, J. Z., Defant, M. J., Stewart, R. H., Restrepo, J. F., Clark, L. F., and Ramirez, A. H.: Quaternary calc-alkaline volcanism in western Panama: regional variation and implication for the plate tectonic framework, J. S. Am. Earth Sci., 1, 275–293, 1988.
de Boer, J. Z., Defant, M. J., Stewart, R. H., and Bellon, H.: Ev- idence for active subduction below western Panama, Geology, 24, 649–652, 1991.
DeMets, C.: A new estimate for present-day Cocos-Caribbean plate motion: implications for slip along the Central Amer- ican volcanic arc, Geophys. Res. Lett., 28, 4043–4046, doi:10.1029/2001GL013518, 2001.
DeMets, C., Gordon, R. G., Argus, D. F., and Stein, S.: Effect of recent revisions to the geomagnetic reversal time scale on esti- mates of current plate motions, Geophys. Res. Lett., 21, 2191–
2194, doi:10.1029/94gl02118, 1994.
DeMets, C., Gordon, R. G., and Argus, D. F.: Geologically current plate motions, Geophys. J. Int., 181, 1–80, doi:10.1111/j.1365- 246X.2009.04491.x, 2010.
DeShon, H. R., Schwartz, S. Y., Bilek, S. L., Dorman, L. M., Gonza- lez, V., Protti, J. M., Flueh, E. R., and Dixon, T. H.: Seismogenic zone structure of the southern Middle America Trench, Costa Rica, J. Geophys. Res., 108, 2491, doi:10.1029/2002JB002294, 2003.
DeShon, H. R., Schwartz, S. Y., Newman, A. V., González, V., Protti, M., Dorman, L. R. M., Dixon, T. H., Sampson, D. E., and Flueh, E. R.: Seismogenic zone structure beneath the Nicoya Peninsula, Costa Rica, from three-dimensional local earthquake P- and S-wave tomography, Geophys. J. Int., 164, 109–124, doi:10.1111/j.1365-246X.2005.02809.x, 2006.
Dinc, A. N., Koulakov, I., Thorwart, M., Rabbel, W., Flueh, E., Arroyo, I. G., Taylor, W., and Alvarado, G. E.: Local earthquake tomography of Central Costa Rica: transition from seamount to ridge subduction, Geophys. J. Int., 183, 286–302, doi:10.1111/j.1365-246X.2010.04717.x, 2010.
Drummond, M. S., Bordelon, M., de Boer, J. Z., Defant, M. J., Bel- lon, H., and Feigenson, M. D.: Igneous petrogenesis and tectonic setting of plutonic and volcanic rocks of the Cordillera de Tala- manca, Costa Rica-Panama, Central American arc, Am. J. Sci., 295, 875–919, 1995.
Dzierma, Y., Thorwart, M. M., Rabbel, W., Flueh, E. R., Alvarado, G. E., and Mora, M. M.: Imaging crustal structure in south central Costa Rica with receiver functions, Geochem. Geophy. Geosy., 11, Q08S26, doi:10.1029/2009GC002936, 2010.
Dzierma, Y., Rabbel, W., Thorwart, M. M., Flueh, E. R., Mora, M.
M., and Alvarado, G. E.: The steeply subducting edge of the Co- cos Ridge: evidence from receiver functions beneath the northern Talamanca Range, south-central Costa Rica, Geochem. Geophy.
Geosy., 12, Q04S30, doi:10.1029/2010GC003477, 2011.
Fisher, D. M., Gardner, T. W., Sak, P. B., Sanchez, J. D., Murphy, K., and Vannucchi, P.: Active thrusting in the inner forearc of an erosive convergent margin, Pacific coast, Costa Rica, Tectonics, 23, TC2007, doi:10.1029/2002tc001464, 2004.
Gazel, E., Hoernle, K., Carr, M. J., Herzberg, C., Saginor, I., van den Bogaard, P., Hauff, F., Feigenson, M., and Swisher III, C.: Plume-subduction interaction in southern Central Amer- ica: mantle upwelling and slab melting, Lithos, 121, 117–134, doi:10.1016/j.lithos.2010.10.008, 2011.
Götze, H. J.: Ein numerisches Verfahren zur Berechnung der gravimetrischen und magnetischen Feldgrößen für dreidimen- sionale Modellkörper, PhD Thesis, TU Clausthal, Clausthal, Ger- many, 1976.
Götze, H. J. and Lahmeyer, B.: Application of three-dimensional interactive modeling in gravity and magnetics, Geophysics, 53, 1096–1108, 1988.
Grevemeyer, I., Ranero, C. R., Flueh, E. R., Kläschen, D., and Bialas, J.: Passive and active seismological study of bending-related faulting and mantle serpentinization at the Mid- dle America trench, Earth Planet. Sc. Lett., 258, 528–542, doi:10.1016/j.epsl.2007.04.013, 2007.