WORKING PAPER 5/2003
Universität Innsbruck
Zentrum für Verwaltungsmanagement Universitätsstr. 15
A – 6020 Innsbruck, Austria Tel.++43 (0)512 507-7601
Internet: www.verwaltungsmanagement.at
Justice and Policing in Australia
Measurement of Police Performance
Mag. Dirk Steller (BCom., Ass. Dip.)
A. Univ. Prof. Mag. Dr. Kurt Promberger
Table of Contents
___________________________________________________________________________
Executive Summary ... 5
PART 1 - Justice and Policing in Australia... 6
1. The Australian Political System... 6
1.1 Overview ... 6
1.2 Ministerial Responsibility for Police Services... 7
2. The Justice System in Australia – A general overview ... 7
3. Government Expenditure on Justice ... 9
4. Police Services in Australia ... 11
4.1 Expenditure on Policing ... 11
4.1.1 Expenditure by key service delivery area 12 4.1.2 Staffing 13 5. National Performance Indicators for Police Services ... 15
5.1 General Framework for Performance Measurement ... 15
5.2 Indicators Relevant to all SDAs ... 16
5.2.1 Satisfaction with police services 17 5.2.2 Perceptions of police integrity 17 5.2.3 Complaints 17 5.2.4 Access and Equity 18 5.3 Indicators for Community Safety and Support ... 18
5.3.1 Perceptions of Safety 19 5.3.2 Perceptions of Crime Problem 20 5.3.3 Recorded Crimes and Crime Victimisation – Recorded crimes against the person 20 5.3.4 Recorded Crimes and Crime Victimisation – Recorded property crimes 21 5.4 Indicators for Crime Investigation... 21
5.4.1 Outcomes of investigations – crimes against the person 22 5.4.2 Outcomes of investigations – property crime 22 5.5 Indicators for Road Safety and Traffic Management ... 23
5.5.1 Use of Seat Belts 23 5.5.2 Driving Under the Influence 23 5.5.3 Degree of Speeding 24 5.5.4 Road Deaths 24 5.5.5 Land Transport Hospitalisations 25 5.5.6 Perceptions of Road Safety Problems 25 5.5.7 Efficiency 25 5.6 Indicators for Services to the Judicial Process... 25
5.6.1 Deaths in Custody 27 5.6.2 Outcomes of Court Cases 27 5.6.3 Juvenile Diversions 27 5.7 Indicators for Other Services ... 27
Conclusion... 28
___________________________________________________________________________
PART 2 - Australian Federal Police (Case Study - Outcome & Output Structure)... 29
1. Structure and Responsibilities of the Australian Federal Police (AFP) ... 29
2 Management Reforms... 31
2.1 Outcome and Output Framework ... 31
2.2 AFP Outcome and Output Structure... 32
2.2.1 Performance Measurement in Relation to Outcome 1 32 2.2.2 Performance Measurement in Relation to Outcome 2 38 Conclusion... 47
List of Figures
___________________________________________________________________________ Figure 1.1 – The Australian Criminal Justice System ... 8Figure 1.2 – Real recurrent expenditure (less revenue from own sources) per person on police services (2001-02 dollars) a, b, c, d, e, f... 12
Figure 1.3 – Recurrent expenditure (less revenue from own sources) on police services, by service delivery area, 2001-02 a, b, c... 13
Figure 1.4 – General Performance Framework for the Police Services Sector ... 16
Figure 1.5 – Performance Indicators for Community Safety and Support ... 19
Figure 1.6 – Performance Indicators for Crime Investigation... 22
Figure 1.7 – Performance Indicators for Road Safety and Traffic Management ... 24
Figure 1.8 – Performance Indicators for Services to the Judicial Process ... 26
Figure 2.1 – Organisational Structure of the AFP ... 30
Figure 2.1 - Outcome and Output Structure of the Australian Federal Police... 33
List of Tables
___________________________________________________________________________
Table 1.1 – Real recurrent expenditure (less revenue from own sources) on justice by all
Australian governments (2001-02 dollars) a, b, c... 9
Table 1.2 – Recurrent expenditure (less revenue from own sources) on justice, per person, 2001-02 a, b, c, d... 10
Table 1.3 – Police staff by sworn/unsworn status (staff members per 100 000 people)a... 14
Table 1.4 – Police staff by operational status (per cent) a, b... 15
Table 1.4 – Real Expenditure per person on ‘other services’... 28
Table 2.1 - Output Objectives and Performance Measurement in Relation to Outcome 1 ... 35
Table 2.2 - Performance Information for Outcome 1 ... 37
Table 2.3 - Output Objectives and Performance Measurement in Relation to Outcome 2 ... 39
Table 2.3.1 – ACT Police Outcome 1 ... 39
Table 2.3.2 – ACT Police Outcome 2 ... 40
Table 2.3.3 – ACT Police Outcome 3 ... 42
Table 2.3.4 – ACT Police Outcome 4 ... 43
Table 2.3.5 – ACT Police Outcome 5 ... 44
Table 2.3.6 – ACT Police Outcome 6 ... 46
___________________________________________________________________________
Executive Summary
The Australian criminal justice system comprises organisations at both the State/Territory and Commonwealth levels. The Commonwealth and each of the eight States and Territories have independent criminal justice systems. Legislative responsibilities in Australia are assigned by the Constitution. One of the Constitution’s main principles is that the Commonwealth only has legislative power in areas specifically detailed in the Constitution. All other powers remain with the States and Territories. Given this, it is the statute and common law of the States and Territories that primarily govern the day to day lives of most Australians.
The State and Territory police forces are the principle means through which policing services are provided. In addition, the Australian Federal Police (AFP) provides policing services in relation to transnational crime, protection of VIPs and other cross jurisdictional operations.
The AFP is also responsible for the community policing role in the Australian Capital Territory (ACT), which is provided under a ‘Purchase Agreement’ between the ACT Government and the AFP.
The Report on Government Services 2003, published by the Steering Committee for the Review of Commonwealth/State Service Delivery, has identified five Service Delivery Areas (SDAs) for policing services. They are: (1) community safety and support; (2) crime
investigation; (3) road safety and traffic management; (4) services to the judicial process; and (5) other services. Performance measures have been developed for each of the SDAs, in order to provide a basis for a national comparison of police service delivery.
The indicators included in the 2003 report reflect performance in both effectiveness and efficiency. The information used in the indicators is sourced both from data provided by the State and Territory Governments and responses to the National Survey of Community Satisfaction with Police Services.
Also of interest is the combining of the budgetary and performance measurement functions in the AFP. As with all Commonwealth agencies, the AFP has recently introduced an Accrual Outcome and Output based Budgeting (AOOB) framework. AOOB is a form of program budgeting that attempts to place the entire budget mechanism in an internal market or purchaser/provider setting. In doing so the budget process becomes one where the government purchases products from departments in market type transactions and departments recognise government funding as business revenue.
The AOOB framework requires that agencies, in conjunction with their Ministers and other stakeholders, establish one or more desired outcomes, and associated outputs, for the budget year. The cost of these outcomes and outputs are calculated by the agency and the outcome and output prices become the basis for government funding. Each outcome and output must also have appropriate performance measures to allow for analysis in the Annual Report.
In the 2001-2002 year, the AFP had two outcomes. Outcome 1, ‘the investigation and
prevention of crime against the Commonwealth and protection of Commonwealth interests in Australia and overseas’, has three associated outputs. Outcome 2, ‘policing activity creates a safe and secure environment in the ACT’, is provided under a Purchase Agreement with the ACT Government. The Purchase Agreement identifies six outcomes for policing services in the ACT with associated performance measures and performance targets.
PART 1 - Justice and Policing in Australia
1. The Australian Political System 1.1 Overview
Australia is a federation comprising six states and two federal territories. The parliamentary and governmental systems of the federal government, and each of the State and Territory governments, are based on the British Westminster model.
In 1901 the Commonwealth of Australia Constitution Act (Australian Constitution) provided for the conversion of the then six self-governing British colonies into the states of New South Wales, Victoria, Queensland, South Australia, Western Australia, and Tasmania and
established the Commonwealth Parliament of Australia as the overarching legislative body.
The legislative power of the federal Parliament is, under the Australian Constitution, confined to matters of overseas and interstate trade and commerce, taxation, broadcasting, telephonic and postal services, defence, trading and financial corporations and external affairs.
Although the areas in which the federal Parliament can legislate are significantly limited by the Constitution, its power in relation to taxation matters means that it collects approximately 70 per cent of total revenue. In addition, the Constitution allows the federal government to grant money it has raised to the states (and to other bodies and individuals) and to impose specific conditions on how these grants may be used. This has provided the federal government with the ability to exercise influence in areas not covered by its constitutional mandate.
The federal Parliament consists of two houses, the House of Representatives (or lower house) and the Senate (or upper house). A government is usually formed by the party or coalition that holds the most seats in the House of Representatives. The leader of this party or coalition will then, in the normal course of events, be appointed as the Prime Minister and take on the formal role of the leader of government. In addition to the Prime Minister, Portfolio
Ministers are also appointed and together they make up the Cabinet.
The responsibilities of the Commonwealth Government are divided into groupings called
‘portfolios’. Each portfolio is made up of one or more departments and agencies which are responsible for the delivery of government services.
Normal practice is for the Prime Minister to appoint persons from his/her political party as Portfolio Ministers, who then take on responsibility for implementation of the government’s policies in their portfolio. Most major policy matters are discussed and decided upon in Cabinet meetings.
The political process in State and Territory parliaments operates, in principle, similarly to that in the Commonwealth.
___________________________________________________________________________
1.2 Ministerial Responsibility for Police Services
The responsibilities for policing services are differently split depending on the administrative arrangements that are in place in each of the State, Territory and Commonwealth
Governments.
In general, responsibility for policing services usually falls under the umbrella of either the Justice Portfolio or the Attorney General’s Portfolio. In some cases Police Services represent a separate portfolio. Given that portfolios are able to have more than one responsible
minister, there is often a minister who is responsible specifically for police services. The minister for police is also often responsible for emergency services.
2. The Justice System in Australia – A general overview
The Australian criminal justice system is made up of institutions, agencies, departments and personnel at both State/Territory and Commonwealth levels. These organisations are responsible for dealing with the justice aspects of crime, and related issues and processes.
Two systems of criminal justice exist in Australia:
1. the federal criminal justice system, based on offences against Commonwealth laws;
and
2. the State criminal justice system, based on offences against State laws.1 Criminal law in Australia is administered through:
• federal police agencies;
• State and Territory police agencies;
• the National Crime Authority;
• the Courts; and
• State and Territory corrective or penal services (there is no independent federal corrective service).2
Legislative responsibilities in Australia are divided up between the State/Territory and Commonwealth through the Constitution. One of the main principles governing the division of legislative powers in Australia is that all powers not specifically vested in the
Commonwealth are the responsibility of State and Territory governments. Given this, it is the statute law and the common law of the States an Territories that primarily govern the day-to- day lives of most Australians.
As described above, the eight States and Territories all have the power to enact criminal law and the Commonwealth has the power to enact laws in relation to its responsibilities under the Constitution. Therefore, in effect, there are nine different systems of criminal law in
existence in Australia.
1 Australian Bureau of Statistics, Crime and Justice, Year Book Australia 2002, Commonwealth of Australia.
2 Australian Bureau of Statistics, Crime and Justice, Year Book Australia 2002, Commonwealth of Australia.
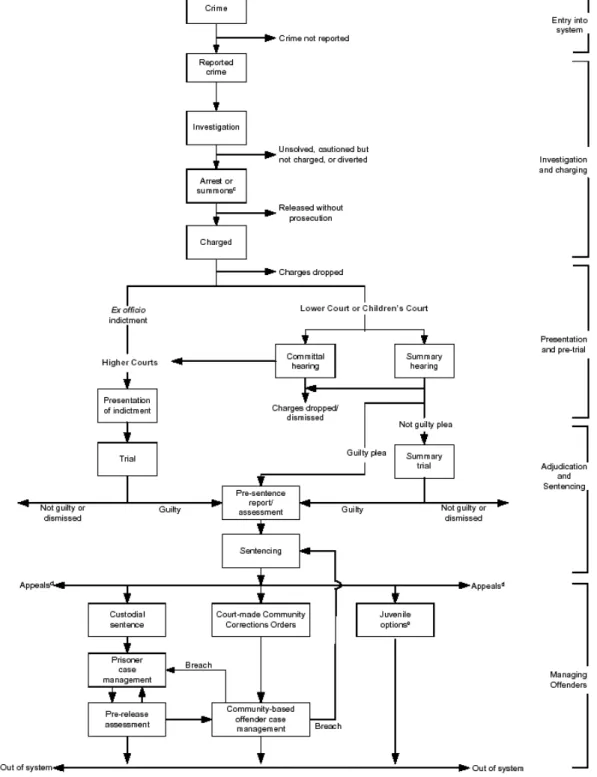
The Australian criminal justice system consists of various agencies that operate within a process in which criminal incidents and offenders move through a number of stages. Figure 1.1 provides an overview of the different stages in the process.
Figure 1.1 – The Australian Criminal Justice System
___________________________________________________________________________
3. Government Expenditure on Justice
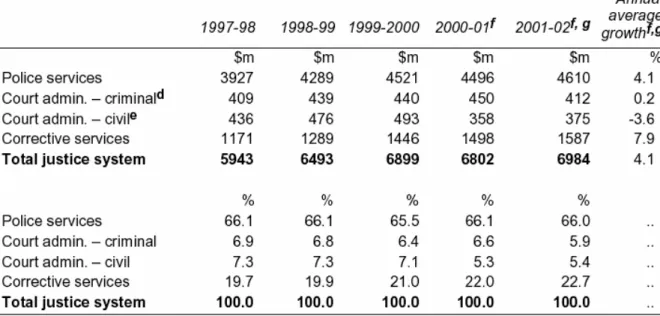
The total recurrent expenditure, less revenue from own sources, on the justice system in Australia was almost $7.0 billion in 2001-02 (see table 1.1).
Police services accounted for approximately $4.6 billion in 2001-02, corrective services for around $1.6 billion and criminal courts administration for $412 million. Expenditure on civil justice (including Federal Court, Federal Magistrates Service and family courts) was
approximately $375 million.3
Table 1.1 – Real recurrent expenditure (less revenue from own sources) on justice by all Australian governments (2001-02 dollars) a, b, c
Recurrent expenditure, less revenue from own sources, between the period 1997-98 and 2001-02 grew fastest in real terms for corrective services (at an annual average rate of 7.9 per cent). A decrease was experienced in the area of civil courts administration (annual average
3 Productivity Commission, Report on Government Services 2003, Commonwealth of Australia, p C.2.
of 3.6 per cent). However, due to changes in the collection of data over this period care should be taken in interpreting this data.
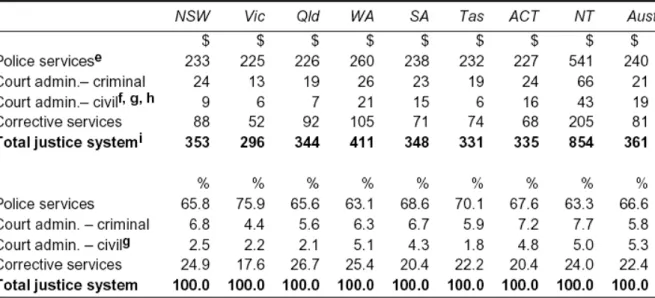
Also of interest, is the recurrent expenditure on a per person basis. Recurrent expenditure, less revenue from own sources, on the Australian justice system in 2001-02 was $361 per person (see table 1.2).
Table 1.2 – Recurrent expenditure (less revenue from own sources) on justice, per person, 2001-02 a, b, c, d
Per person expenditure on civil and criminal justice in 2001-02 was highest in the Northern Territory ($854) and lowest in Victoria ($296). Per person expenditure on police services were also highest in the Northern Territory ($541) and lowest in Victoria ($225).
___________________________________________________________________________
4. Police Services in Australia
The State and Territory police services are the principal means through which the achievement of a safe and secure environment for the community, the investigation of
offences and provision of services to the judicial process, and the provision of road safety and traffic management.
Police are involved in a wide range of activities aimed at reducing the incidence and effect of criminal activity. The police forces are also involved in the provision of services such as assisting emergency services, mediating family and neighbourhood disputes, delivering messages regarding death or serious illness and advising on general policing services.4
The responsibilities for policing lie with the relevant State and Territory governments, except in the Australian Capital Territory (ACT), where the Australian Federal Police (AFP)
provides a community policing service. This community policing service is provided under the means of a purchaser/provider arrangement between the ACT government and the AFP (see Chapter 4 for further details).
The State and Territory police services are autonomous, but there is significant cooperation between the police services, particularly in the areas of forensic sciences and policing research.
4.1 Expenditure on Policing
Policing services in Australia are funded almost solely from State and Territory budgets, plus some limited specific purpose grants from the Commonwealth. As detailed above, real recurrent expenditure, less revenue from own sources, on police services was approximately
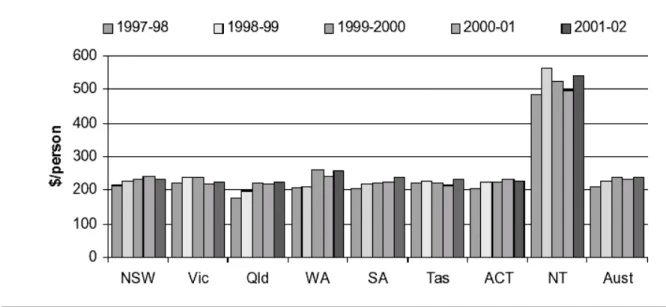
$4.6 billion (or $240 per person) in the 2001-02 year.
4 Productivity Commission, Report on Government Services 2003, Commonwealth of Australia, ch 5, p 2.
Figure 1.2 – Real recurrent expenditure (less revenue from own sources) per person on police services (2001-02 dollars) a, b, c, d, e, f
On a per person basis, real recurrent expenditure, less revenue from own sources, is fairly consistent across Australia, except in the Northern Territory where policing expenditure is nearly double the national average. Figure 1.2 details per person policing expenditure for the period 1997-98 to 2001-02.
4.1.1 Expenditure by key service delivery area
The Steering Committee for the Review of Commonwealth/State Service Delivery, in its Report on Government Services 2003, disaggregated police services into four Service
Delivery Areas (SDAs), and a fifth area called ‘other services’ to account for expenditure not included in the SDAs.
The SDAs defined by the Committee are:
• Community safety and support;
• Crime investigation;
• Road safety and traffic management;
• Services to the judicial process; and
___________________________________________________________________________
• Other services.5
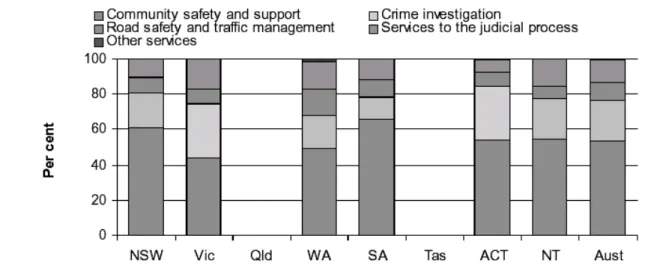
Figure 1.3 – Recurrent expenditure (less revenue from own sources) on police services, by service delivery area, 2001-02 a, b, c
The SDA consuming the largest amount of expenditure in 2001-02 was community safety and support, accounting for 53.6 per cent of expenditure. Crime investigation consumed the second largest portion of expenditure, accounting for 22.9 per cent nationally.
4.1.2 Staffing
The staffing structure in Australian police forces is split into two major categories; (1) Sworn police officers, who have police powers, including the power to arrest, summons, caution, detain, fingerprint and search; and (2) non-sworn officers, who are civilian employees
undertaking duties that do not require police powers, for example, administrative work, crime scene analysis and intelligence analysis.
In recent years there has been a trend towards increasing the numbers of non-sworn officers into the police force. There are three main objectives of this ‘civilianisation’ of police services. They are:
• to reduce costs;
• to better manage the increasing need for specialist skills; and
• to reduce the involvement of sworn police officers in duties that do not require police powers.6
5 Productivity Commission, Report on Government Services 2003, Commonwealth of Australia, ch 5, p 4.
6 Productivity Commission, Report on Government Services 2003, Commonwealth of Australia, ch 5, p 10.
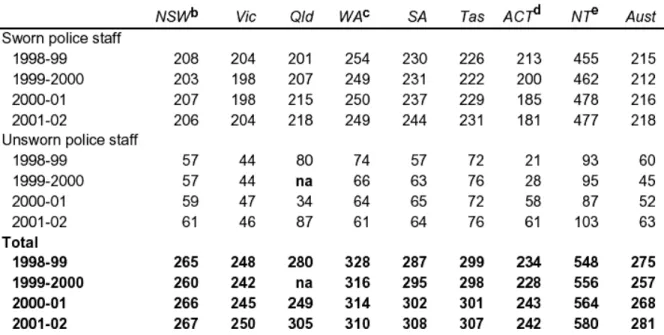
Table 1.3 – Police staff by sworn/unsworn status (staff members per 100 000 people)a
In 2001-02 the total police staffing in Australia was 55 108 (or 281 staff per 100 000 people).
This comprised 218 sworn police officers and 63 non-sworn employees per 100 000 people.
Significant variations can be seen across Australian jurisdictions, for example, in the Northern Territory total staff per 100 000 people was 580 compared to 242 staff per 100 000 people in the ACT. See table 1.3 for further details.
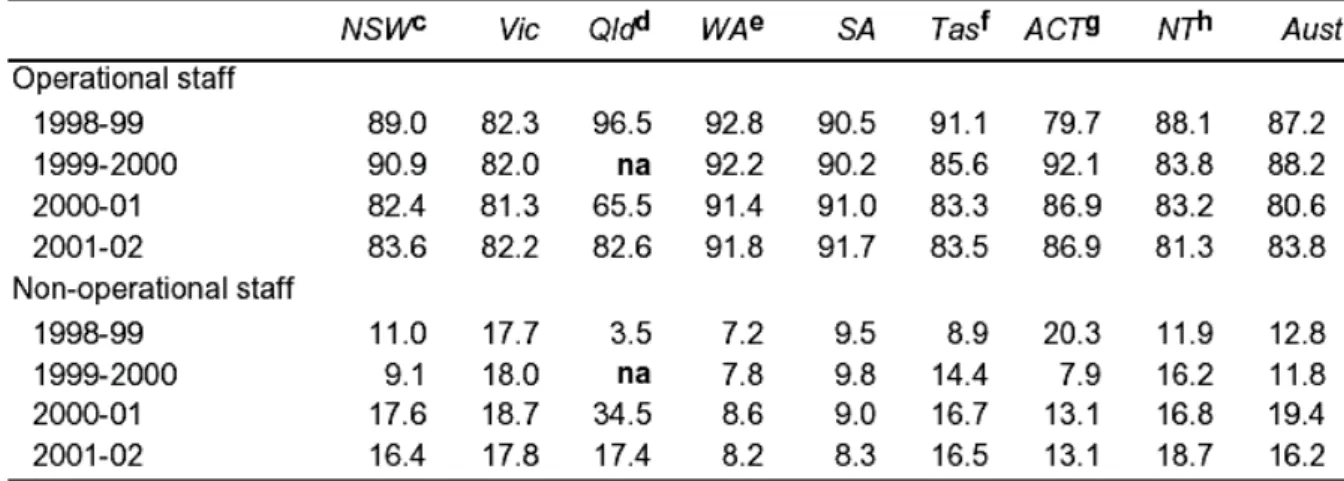
For analysis purposes, it is also useful to look at police staffing levels based on operational status. Police staff have been separated into two categories; (1) operational staff, who are any persons (sworn or unsworn) who deliver or support a police or police related service directly to an external customer (i.e. members of the public, other government departments, courts and the government); and (2) non-operational staff, who are any persons not meeting the criteria for classification as operational staff, including functional support staff, such as finance staff and personnel services staff.7 Table 1.4 provides a breakdown of police staff by operational status.
___________________________________________________________________________
Table 1.4 – Police staff by operational status (per cent) a, b
5. National Performance Indicators for Police Services
The Steering Committee for the Review of Commonwealth/State Service Delivery, in its Report on Government Services 2003, developed a general approach for the measurement of performance on a national basis. Each State and Territory police force manages its own set of performance indicators for internal decision making and reporting purposes. The
performance measurement framework described below has been developed to allow a direct comparison between the various police forces.
5.1 General Framework for Performance Measurement
The performance measurement framework developed by the Steering Committee for the Review of Commonwealth/State Service Delivery, in its Report on Government Services 2003, is built around the four Service Delivery Areas (SDAs) and an additional area ‘other services’ for those activities not directly attributable to one of the SDAs (as identified in Section 4.1.1).
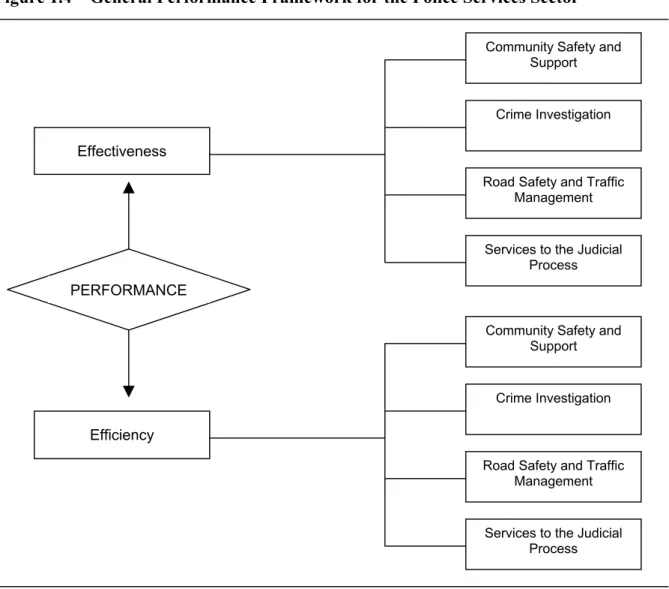
Figure 1.4 provides an overview of the performance measurement framework and particularly, the desire of the Steering Committee to measure both effectiveness and
efficiency of service delivery in each of the SDAs. In reality, it has not been possible for the Steering Committee to develop directly comparable or complete indicators for all of the SDAs. The majority of indicators are focused on the effectiveness of police services and are measured through the National Survey of Community Satisfaction with Policing.
Figure 1.4 – General Performance Framework for the Police Services Sector
Source: Productivity Commission, Report on Government Services 2003, Commonwealth of Australia, ch 5, p 15.
5.2 Indicators Relevant to all SDAs
In addition to the performance indicators specific to each of the SDAs, the Steering Committee identified five areas relevant to all SDAs These are:
1. satisfaction with police services;
2. perceptions of police integrity;
3. complaints;
4. access and equity – indigenous staff; and 5. access and equity – staffing by gender.8
Areas 1 and 2 are measured through the use the National Survey of Community Satisfaction with Policing and areas 3, 4 and 5 are measured through data collected and supplied by the individual police forces.
Effectiveness
Efficiency
Community Safety and Support
PERFORMANCE
Crime Investigation
Road Safety and Traffic Management
Services to the Judicial Process
Community Safety and Support
Crime Investigation
Road Safety and Traffic Management
Services to the Judicial Process
___________________________________________________________________________
5.2.1 Satisfaction with police services
In order to measure the community’s satisfaction with police services people are asked “how satisfied are you in general with the services provided by the police?” and “how satisfied were you with the service you received during your most recent contact with police?”.
Satisfaction with police services is measured by two indicators. They are:
1. percentage of people aged 18 years and over who were ‘satisfied’ or ‘very satisfied’
with police services; and
2. percentage of people aged 18 years and over who were ‘satisfied’ or ‘very satisfied’
with police in their most recent contact.9
The results of the 2001-02 survey indicated that 69 per cent of respondents were satisfied or very satisfied with police services and 80.2 per cent of respondents were satisfied or very satisfied with police in their most recent contact.
5.2.2 Perceptions of police integrity
A further area measured through the use of the National Survey of Community Satisfaction with Policing is perceptions of police integrity.
Public perceptions of police integrity are measured by three indicators. They are:
1. percentage of people aged 18 years and over who ‘agreed’ or ‘strongly agreed’ that police treat people fairly and equally;
2. percentage of people aged 18 years and over who ‘agreed’ or ‘strongly agreed’ that police perform the job professionally; and
3. percentage of people aged 18 years and over who ‘agreed’ or ‘strongly agreed’ that most police are honest.10
The 2001-02 survey indicated that 65.0 per cent of respondents ‘agreed’ or ‘strongly agreed’
that police treat people fairly and equally, 70 per cent of respondents ‘agreed’ or ‘strongly agreed’ that police perform the job professionally and 74.4 per cent of respondents ‘agreed’ or
‘strongly agreed’ that most police are honest.
5.2.3 Complaints
In recent years Australian police forces have encouraged the implementation of customer service codes that encourage openness and accountability. In line with this trend, police forces record all complaints against police officers, which provides useful information in relation to various aspects of police service delivery.
9 Productivity Commission, Report on Government Services 2003, Commonwealth of Australia, ch 5, p 17.
10 Productivity Commission, Report on Government Services 2003, Commonwealth of Australia, ch 5, p 19, 21, 22.
Indicators in relation to complaints against police are detailed in two forms. They are:
1. complaints against police officers per 100 000 people; and 2. complaints against police officers per 100 sworn police staff.11 5.2.4 Access and Equity
A further area that can be used as an indicator of the organisational culture within Australian police forces is the number of indigenous staff members and female staff members.
Indigenous staffing is most relevant in central and northern Australia where the indigenous community has the largest density.
Indigenous Staffing
Indigenous staffing has one indicator and represents the number of indigenous staff as a proportion of working age indigenous Australians.
1. indigenous staff (sworn and unsworn) as a proportion of the indigenous population aged between 20-64 years of age.12
Staffing by Gender
Staffing by gender has two indicators. They are:
1. female staff (sworn and unsworn) as a proportion of total staff; and 2. female staff (sworn and unsworn) per 100 staff.13
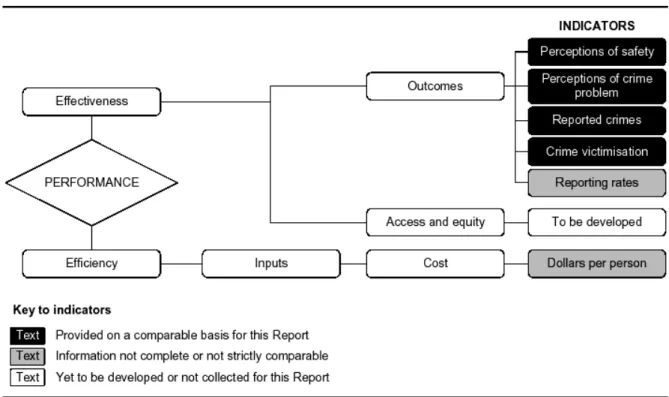
5.3 Indicators for Community Safety and Support
The service delivery area of ‘community safety and support’ is focused on preserving public order and promoting a safer community through a range of activities, including:
• responding to calls for assistance;
• responding to, managing and coordinating major incidents and emergencies; and
• undertaking crime prevention activities and community support programs.
As described in section 5.1, the Steering Committee has established performance indicators for both effectiveness and efficiency in relation to the SDA ‘community safety and support’.
Figure 1.5 provides and overview of the performance indicator structure.
The effectiveness indicators have been split into two groups, (1) indicators of outcomes; and (2) indicators of access and equity. However, the access and equity indicators are yet to be developed.
The indicators in relation to outcomes have two main information sources. The information for indicator groups (1) perceptions of safety and (2) perceptions of crime problem is sourced
11 Productivity Commission, Report on Government Services 2003, Commonwealth of Australia, ch 5, p 23.
12 Productivity Commission, Report on Government Services 2003, Commonwealth of Australia, ch 5, p 25.
___________________________________________________________________________
through the Nations Survey of Community Satisfaction with Policing (NSCSP). The
information for the indicator groups (3) reported crimes and (4) crime victimisation is sourced through data collected and supplied by the police forces. A fifth indicator group ‘reporting rates’ is intended to provide data on the level of crime reporting (i.e. an indication of the amount of crimes, in selected offence categories, that are not reported to police). This information is collected and supplied by the Australian Bureau of Statistics (ABS).
In relation to efficiency indicators, the Steering Committee has chosen to report the efficiency of the community safety and support SDA on a dollars per person basis.
Figure 1.5 – Performance Indicators for Community Safety and Support
Source: Productivity Commission, Report on Government Services 2003, Commonwealth of Australia, ch 5, p 27.
5.3.1 Perceptions of Safety
The indicator group ‘perceptions of safety’ has been reported through four indicators derived from responses to questions in the NSCSP. The indicators are:
• the proportion of people who felt ‘safe’ or ‘very safe’ at home alone during the day;
• the proportion of people who felt ‘safe’ or ‘very safe’ at home after dark;
• the proportion of people who felt ‘safe’ or ‘very safe’ walking of jogging locally after dark; and
• the proportion of people who felt ‘safe’ or ‘very safe’ on public transport after dark.14
14 Productivity Commission, Report on Government Services 2003, Commonwealth of Australia, ch 5, p 28, 29, 30.
5.3.2 Perceptions of Crime Problem
The indicator group ‘perceptions of crime problem’ has also been derived from responses to questions in the NSCSP. In order to identify community perceptions to various types of criminal activity, the NSCSP identified ten crime areas, they are:
1. housebreaking;
2. drugs;
3. vehicle theft;
4. driver behaviour;
5. physical assault;
6. graffiti/vandalism;
7. louts/gangs;
8. sexual assault;
9. family violence; and 10. drunken behaviour.15
There are two indicators reported on, in relation to these types of criminal activity. They are:
• the proportion of people aged 18 and over who consider the identified issues to be either a ‘major problem’ or ‘somewhat of a problem’ in the State or Territory; and
• the proportion of people aged 18 and over who consider the identified issues to be either a ‘major problem’ or ‘somewhat of a problem’ in the neighbourhood and general community.16
5.3.3 Recorded Crimes and Crime Victimisation – Recorded crimes against the person The indicator group ‘record crimes and crime victimisation – recorded crimes against the person’ has three indicators, which are reported on a victims per 100 000 people basis.
The indicators are:
• recorded victims of murder (per 100 000 people);
• recorded victims of assault (per 100 000 people); and
• recorded victims of armed robbery (per 100 000 people).17
15 Productivity Commission, Report on Government Services 2003, Commonwealth of Australia, ch 5, p 32.
16 Productivity Commission, Report on Government Services 2003, Commonwealth of Australia, ch 5, p 32.
___________________________________________________________________________
5.3.4 Recorded Crimes and Crime Victimisation – Recorded property crimes
The indicator group ‘record crimes and crime victimisation – recorded property crimes’ has two indicators, which are reported on a victims per 100 000 people basis.
The indicators are:
• recorded victims of unlawful entry with intent (per 100 000 people); and
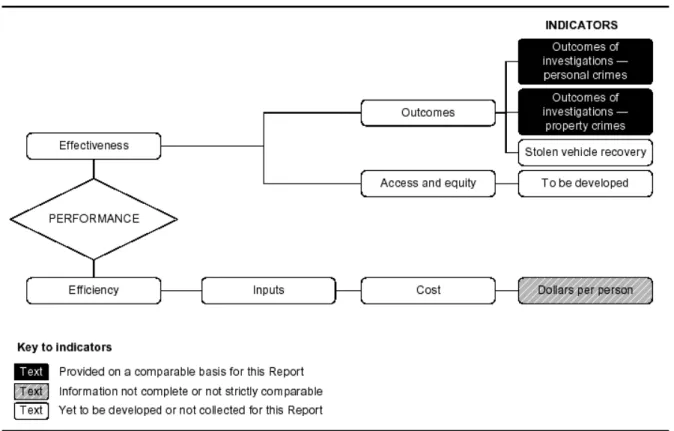
• recorded victims of motor vehicle theft (per 100 000 people).18 5.4 Indicators for Crime Investigation
The service delivery area of crime investigation is focused on the activities of police in investigating crime and identifying and apprehending suspects, including:
• gathering intelligence on suspects and locations to assist with investigations; and
• collecting and securing evidence in relation to both the offence and the suspect.
As with the performance indicators for other SDAs, the indicators for ‘crime investigation’
have bee split into those relating to effectiveness and those relating to efficiency. Figure 1.6 provides an overview of the performance indicator structure for the SDA crime investigation.
There are three effectiveness indicators, in relation to outcomes, for ‘crime investigation’, (1) outcomes of investigations - personal crimes; (2) outcomes of investigations - property crimes; and (3) stolen vehicle recovery. However, indicator (3) has not yet been reported.
The fourth effectiveness indicator, which is in relation to access and equity, is also yet to be developed.
There is one efficiency indicator for the SDA ‘crime investigation’ and details the cost of providing crime investigation on a dollars per person basis.
18 Productivity Commission, Report on Government Services 2003, Commonwealth of Australia, ch 5, p 34, 35.
Figure 1.6 – Performance Indicators for Crime Investigation
Source: Productivity Commission, Report on Government Services 2003, Commonwealth of Australia, ch 5, p 38.
5.4.1 Outcomes of investigations – crimes against the person
The performance indicator group ‘outcomes of investigations – crimes against the person’
there have been two indicators developed. The crimes of murder, assault and armed robbery are separately identified.
The two indicators are:
• the proportion of investigations finalised within 30 days; and
• the proportion of finalised investigations leading to the offender being proceeded against.19
5.4.2 Outcomes of investigations – property crime
The performance indicator group ‘outcomes of investigations – property crime’ there have been two indicators developed. The crimes of unlawful entry with intent, motor vehicle theft and other theft are separately identified.
___________________________________________________________________________
The indicators are:
• the proportion of investigations finalised within 30 days; and
• the proportion of finalised investigations leading to the offender being proceeded against.20
5.5 Indicators for Road Safety and Traffic Management
The SDA ‘road safety and traffic management’ focuses on maximising road safety through operations in the areas of reducing the incidence of traffic offences and through attendance at, and investigation of, road traffic accidents and incidents. Typical duties include:
• monitoring road user behaviour, including speed and alcohol related traffic operations;
• undertaking general traffic management functions;
• attending and investigating road traffic accidents and incidents; and
• improving public education and awareness of traffic and road safety issues.
Performance indicators for the SDA ‘road safety and traffic management’ have been split into those relating to effectiveness and those relating to efficiency. Figure1.7 provides an
overview of the performance indicator structure for the SDA ‘road safety and traffic management.
There are six effectiveness indicators, in relation to outcomes, (1) use of seat belts; (2) driving under the influence; (3) degree of speeding; (4) road deaths; (5) land transport
hospitalisations; and (6) perceptions of road safety problems. Indicators (1), (2), (3) and (6) are based on responses from the NSCSP and indicators (4) and (5) are based on actual data supplied by the various police forces.
The seventh effectiveness indicator, which is in relation to access and equity, is yet to be developed.
In relation to indicators of efficiency, three measures have been identified, (1) dollars per person; (2) dollars per registered vehicle; and (3) dollars per fatal or serious injury collision.
5.5.1 Use of Seat Belts
The performance indicator ‘use of seatbelts’ is measured through responses to the NSCSP.
The indicator used is: ‘people who had driven in the last 12 months and ‘never’ travel in a car without wearing a seat belt, drivers aged 18 years and over’. Reported as per cent of
respondents.
5.5.2 Driving Under the Influence
The performance indicator ‘driving under the influence’ is measured through responses to the NSCSP.
20 Productivity Commission, Report on Government Services 2003, Commonwealth of Australia, ch 5, p 40.
The indicator used is: ‘people who had driven in the last 12 months who indicated that they had ‘never’ driven while possibly over 0.05 blood alcohol level, drivers aged 18 years and over’.21
Figure 1.7 – Performance Indicators for Road Safety and Traffic Management
Source: Productivity Commission, Report on Government Services 2003, Commonwealth of Australia, ch 5, p 43.
5.5.3 Degree of Speeding
The performance indicator ‘degree of speeding’ is measured through responses to the NSCSP.
The indicator used is: ‘people who indicated that they had driven in the last 12 months more than 10km/h above the speed limit ‘sometimes’ or more often, drivers aged 18 years and over’.22
5.5.4 Road Deaths
The performance indicator group ‘road deaths’ is measured through the supply of actual data from the various police forces.
21 Productivity Commission, Report on Government Services 2003, Commonwealth of Australia, ch 5, p 45.
___________________________________________________________________________
The indicators reported are:
• total deaths on Australian roads; and
• road deaths per 100 000 registered vehicles.23 5.5.5 Land Transport Hospitalisations
The performance indicator group ‘road transport hospitalisations’ is measured through the supply of actual data from the various police forces.
The indicators reported are:
• total road transport hospitalisations; and
• road transport hospitalisations per 100 000 registered vehicles.24 5.5.6 Perceptions of Road Safety Problems
The performance indicator group ‘perceptions of road safety problems’ is based on data collected through the NSCSP.
The indicator reported is: ‘the proportion of people aged 18 years and over who felt the speeding cars or dangerous, noisy driving was a ‘major problem’ or ‘somewhat of a problem’
in their neighbourhood’.25 5.5.7 Efficiency
The efficiency of services provided in relation to the SDA ‘road safety and traffic management’ is measured through the use of three specific indicators. They are:
• dollars per person;
• dollars per registered vehicle; and
• cost per fatal or serious injury or collision.26
The indicator ‘cost per fatal or serious injury or collision’ is calculated by taking the cost of the SDA ‘road safety and traffic management’ and dividing this by the number of fatal or serious injuries or collisions, where the number of fatal or serious injuries or collisions is defined as the number of road deaths plus the number of road transport hospitalisations.
5.6 Indicators for Services to the Judicial Process
The SDA ‘services to the judicial process’ centres around the role of police in providing support to the judicial process, including the provision of safe custody for alleged offenders and fair and equitable treatment of both victims and alleged offenders. The activities involved in the provision of this SDA include:
23 Productivity Commission, Report on Government Services 2003, Commonwealth of Australia, ch 5, p 45.
24 Productivity Commission, Report on Government Services 2003, Commonwealth of Australia, ch 5, p 46.
25 Productivity Commission, Report on Government Services 2003, Commonwealth of Australia, ch 5, p 48.
26 Productivity Commission, Report on Government Services 2003, Commonwealth of Australia, ch 5, p 48.
• preparing briefs;
• presenting evidence in court; and
• conducting court and prisoner security.
The performance indicators in relation to the SDA ‘services to the judicial process’ have been split between those relating to effectiveness and those relating to efficiency. Figure 1.8 provides an overview of the performance indicator structure for the SDA ‘services to the judicial process’.
Figure 1.8 – Performance Indicators for Services to the Judicial Process
Source: Productivity Commission, Report on Government Services 2003, Commonwealth of Australia, ch 5, p 51.
The effectiveness indicators have been divided into two groups those relating to outcomes and those relating to access and equity. There are four outcome indicators, (1) deaths in custody;
(2) proportion of lower court cases resulting in a guilty plea; (3) proportion of higher court cases resulting in a guilty finding; and (4) proportion of diversions (juvenile cases). In relation to access and equity, the number of indigenous deaths in custody is used as the indicator.
In terms of efficiency, there are three indicators, (1) dollars per person for judicial services;
(2) dollars per person for custodial care; and (3) costs awarded against the police criminal actions. However, indicator (2) ‘dollars per person for custodial care’ has not yet been reported.
___________________________________________________________________________
5.6.1 Deaths in Custody
The performance indicator group ‘deaths in custody’ is based on information collected directly from the Australian Institute of Criminology. It provides information for both the outcome indicator ‘deaths in custody’ and the access and equity indicator ‘indigenous deaths in custody’.27
5.6.2 Outcomes of Court Cases
Given the police’s role in the judicial process, a guilty plea or conviction can be used to some degree as a measure of success. There have been two indicators developed in relation to outcomes of court cases, (1) proportion of lower court cases resulting in a guilty plea and (2) proportion of higher court cases resulting in a guilty finding.28 However, a number of state authorities are not yet able to provide complete or comparable data for these indicators.
5.6.3 Juvenile Diversions
When offenders are apprehended by police, there are a number of options available. For example, police may charge the offender, and the case will proceed to the courts, or they may use their discretion and divert the offender to another, more rehabilitative process.
The term ‘diverted’ is used when offenders are forwarded to programs such as community conference, diversionary conference, formal cautioning by police, family conferences and other diversionary programs (i.e. drug assessment/treatment). Offenders who would not have normally been forwarded to the courts are not included in the figures.
The indicator reported is: ‘juvenile diversions as a proportion of juvenile offenders’.29 5.7 Indicators for Other Services
As described earlier in this report, there are certain police functions that can not be directly accredited to one of the four operational SDAs, these costs are picked up under the SDA
‘other services’. Performance of the ‘other services’ SDA is measured on a real expenditure per person basis (see Table 1.4.
27 Productivity Commission, Report on Government Services 2003, Commonwealth of Australia, ch 5, p 50.
28 Productivity Commission, Report on Government Services 2003, Commonwealth of Australia, ch 5, p 52.
29 Productivity Commission, Report on Government Services 2003, Commonwealth of Australia, ch 5, p 54.
Table 1.4 – Real Expenditure per person on ‘other services’
Conclusion
The criminal justice system in Australia is made up of organisations at the State/Territory and Commonwealth levels. Each of the States and Territories have their own criminal justice systems, in addition to that at the federal level. Australia’s Constitution defines the division of powers between the States/Territories and the Commonwealth. The Constitution has been drafted in such a manner as to allocate limited powers to the Federal or Commonwealth Parliament, leaving the majority of power to legislate with the States and Territories. For this reason, it is the laws of the States and Territories that primarily govern the day to day lives of most Australians.
Each State and Territory has its own police force, except for the Australian Capital Territory (ACT) which purchases policing services from the Australian Federal Police (AFP). The AFP is responsible for issues such as transnational crime, protection of VIPs and other cross
jurisdictional operations.
Each of the various police forces have individual performance measurement and performance management frameworks. However, performance indicators for police services, on a
nationally comparable basis, have been developed by the Steering Committee for the Review of Commonwealth/State Service Delivery. The 2003 Report on Government Services splits police services into five Service Delivery Areas (SDAs). Each of the SDAs have been allocated various performance indicators that relate to both effectiveness and efficiency. The indicators are derived from information collected directly from the State and Territory
Governments and from the National Survey of Community Satisfaction with Police Services.
The use of community satisfaction surveys to gauge police performance is aimed at assessing if the police programs and policies are having the desired effect in the community.
___________________________________________________________________________
PART 2 - Australian Federal Police
(Case Study - Outcome & Output Structure)
1. Structure and Responsibilities of the Australian Federal Police (AFP) The Australian Federal Police (AFP) is a Commonwealth agency that focuses on investigating crimes against Commonwealth laws, in addition the AFP provides a community policing role in the Australian Capital Territory (ACT) and Australia’s external territories.
Ministerial responsibility for the AFP lies within the Attorney General’s Department.
The main areas in which the AFP investigates and enforces laws are, terrorism, drug trafficking, fraud against Government revenue and expenditure, money laundering, people smuggling, high tech crime and other politically sensitive matters including corruption.
Witness protection and personal protection of Very Important Persons (VIPs) are also services provided by the AFP.30
The Australian National Central Bureau (NCB) for the International Criminal Police
Organisation, Interpol is operated by the AFP. The NCB is supported by all Australian police forces and provides a direct link with the 179 member countries of Interpol.
The AFP works in partnership with state and territory police services, government agencies and international law enforcement agencies. It has a total of 3 050 employees with offices located in all Australian capital cities and smaller offices in Cairns, Coffs Harbour, the Gold Coast, Newcastle and Townsville. The AFP also has resident agents in Broome, Port Headland and Thursday Island, and staff providing policing services in Australia’s external territories. Further, the AFP has representatives in 23 countries operating as liaison officers or on peacekeeping/peace monitoring missions.
The overarching framework of functions assigned to the AFP are defined in section 8 of the Australian Federal Police Act 1979. Commonwealth government priorities for law
enforcement are regulated by section 37 of the AFP Act, which allows the relevant
Government Minister to issue the AFP Commissioner with written directions in relation to general policy for the performance of the functions of the AFP.
The organisational structure of the AFP is directly aligned with the Commonwealth’s outcomes and outputs budgeting and reporting framework, which was implemented in all commonwealth agencies in 1999-2000.
Figure 2.1 provides and overview of the AFP’s organisational structure.
30 Australian Federal Police, Australian Federal Police Annual Report 2001-2002, Commonwealth of Australia, p 7.
Figure 2.1 – Organisational Structure of the AFP
Source: Australian Federal Police, AFP Annual Report 2001-2002, Commonwealth of Australia, p 10, 11
Commissioner
Office of the Commissioner
Director Media &
Public Relations
Deputy Commissioner Outcome 1
Office of the Deputy
Commissioner Director Outcome
Service Delivery
General Manager International
General Manager Protective
Security
General Manager Eastern Operations
General Manager Southern Operations
General Manager Northern Operations General Manager
National
General Manager Western Operations
Director Investigations &
Tech. Services
Director International
Operations
Director
Operations Director
Operations Director
Operations Director
Operations Director
Operations
Director MOSC
Director Intelligence Coordination
Director Operations
Support
Director Operations
Support
Director Operations
Support
Director Operations
Support
Director Operations
Support
Director Operations
Support
Director Australian Bomb
Data Centre
Chief Operating Officer Corporate & Enabling
Services
Coordinator Internal Audit
Chief Police Officer ACT Policing
General Manager Policy &
Commercial
General Manager People & Finance
Director Professional
Standards
Deputy Chief Police Officer ACT Policing
Commander Operations ACT Policing
Director Services ACT Policing Director
Policy
Director Legal
Director Forensic Services
Director Information Technology
Director Commercial
Support
Director Information Management
Director People Strategies
Chief Financial Officer
Director Learning &
Development
Director Workplace
Relations
___________________________________________________________________________
2 Management Reforms
As with all other Australian Commonwealth agencies, the AFP has been very active in various areas of management reform. In line with the principles of New Public Management (NPM), many reform projects, aimed at introducing private sector management practices to the public sector, have been introduced into the Australian Commonwealth Public Service.
One of the most innovative projects has been the switch to Accrual Outcome and Output based Budgeting (AOOB). The following section provides details of the AOOB structure in the Australian Federal Police.
2.1 Outcome and Output Framework
AOOB is a specific form of performance budgeting that is conceptually related to program budgeting. However, AOOB goes much further than program budgeting in that it attempts to place the entire budget mechanism in an internal market or purchaser/provider setting. In doing so the budget process becomes one where the government purchases products from departments in market type transactions and departments recognise government funding as business revenue.31
The main aim of the AOOB system of budgeting is to create a situation in which departments operate as quasi independent business with their financial results, and other indicators, being used for performance measurement.
The linking of performance measurement to budget estimates is also a major change from the traditional cash based budgeting systems. Under AOOB, outcomes (what the government wants to achieve) and outputs (how the government will achieve its desired outcomes) are detailed in the budget. Each outcome and its underlying outputs are allocated a price, which the government pays to the relevant agency for the delivery of that outcome or output.
Simultaneously, appropriate performance indicators for each outcome and output are developed in order to determine the extent to which the outcomes and outputs have been achieved. Agencies are required to disclose the extent to which they have succeeded in achieving their outcomes and outputs, by reporting against their performance indicators in an annual report. For this reason is AOOB much more than purely a budgetary system it serves as an integrated budgetary and performance management system aimed at promoting
continuous improvements in the efficiency and effectiveness of government programs.
Australia is not the first country to apply the principles of AOOB. Similar internal market budgeting frameworks have been implemented in the New Zealand Government and in Great Britain. One of the first public organisations to implement internal market based relationships was the British National Health System.32
However, Australia is one of the few countries to have a fully implemented outcome based budget process with associated performance measurement and management arrangements.
31 Robinson M., Financial Control in Australian Government Budgeting, Public Budgeting & Finance, Spring 2002, p81.
32 Robinson M., Financial Control in Australian Government Budgeting, Public Budgeting & Finance, Spring 2002, p81.
2.2 AFP Outcome and Output Structure
In the 2001 – 2002 financial year (the most recent completed reporting cycle), the AFP had a two outcome structure. Outcome 1, ‘the investigation and prevention of crime against the Commonwealth and protection of Commonwealth interests in Australia and overseas’, relates to the AFP’s Commonwealth funded role. Outcome 2, ‘policing activity creates a safe and secure environment in the ACT’, relates to the AFP’s community policing function in the Australian Capital Territory (ACT), which is funded under a ‘Purchase Agreement’ between the ACT Government and the AFP.
Outcome 1 has three output classes, output class 1.1 ‘investigation services, output class 1.2
‘protection services’ and output class 1.3 ‘international services’.33
For Commonwealth budget purposes, outcome 2 only has one output class ‘services to the ACT Government’, which has a zero dollar impact on Commonwealth appropriations. The services provided in relation to outcome 2 are defined and managed through the use of a
‘purchase agreement’. The ‘purchase agreement’ is, in effect, a contract between the ACT Minister for Police and Emergency Services and the Chief Police Officer for the ACT that details the services the ACT Government wishes to purchase from the AFP and what price the ACT Government is prepared to pay for those services. The ‘purchase agreement’ defines six outcomes in relation to AFP community policing services in the ACT.34
Figure 2.2 provides an overview of the outcome and output structure, for the financial year 2001-2002, for the AFP.
The outcome structure of the AFP is defined in the AFP Portfolio Budget Statements (PBS), which are prepared by each Commonwealth agency as part of the overall budget process. The PBS provides Parliament with the necessary information about the agency’s desired outcomes and outcome and output prices, in order to allow a legal Appropriation of monies, from the Consolidated Revenue Fund. The performance measures to be used for each outcome and output are also contained in the PBS.
Following the completion of each reporting period, agencies must prepare an Annual Report in which an analysis of actual performance, as compared to expected performance, is made.
2.2.1 Performance Measurement in Relation to Outcome 1
As detailed above, outcome 1 is divided into three output classes (1.1) ‘investigation services’; (1.2) ‘protection services’; and (1.3) ‘international services’.
Output 1.1 – Investigation Services
The output class ‘investigation services’ relates to the AFP’s role in providing a flexible, reactive investigative service across a large range of Commonwealth law enforcement interests. Some of the main areas covered by output 1.1 are illicit drugs, economic crime, protection of Australian systems and institutions, people smuggling and environmental crime.
33 Australian Federal Police, AFP Portfolio Budget Statements 2001-2002, Commonwealth of Australia, p 203.
34 ACT Minister for Police and Emergency Services, Purchase Agreement between the ACT Minister for Police
___________________________________________________________________________
Figure 2.1 - Outcome and Output Structure of the Australian Federal Police
AUSTRALIAN FEDERAL POLICE
Total price of outputs $386.802m Departmental outcome appropriation $296.289m
Outcome 1: The investigation and prevention of crime against the Commonwealth and protection of
Commonwealth interests in Australia and overseas Total price $312.802 Departmental output approp $296.289
Outcome 2: Policing activity creates a safe and secure environment in the ACT
Total price $74.723m
Departmental output approp $Nil
Output 1.1: Investigation Services
Total price $229.202m Departmental output approp $216.783m
Output 1.2: Protection Services
Total price $30.000m
Departmental output approp $28.541m
Output 1.1: International Services
Total price $229.202m Departmental output approp $216.783m
Outcome 1: The level of public order and community confidence is maximised through
the implementation of effective crime prevention and response strategies Cost of Outcome $40.760m Output 2.1: Services to the ACT Government (Purchase Agreement with ACT Government)
Total price $74.723m
Departmental output approp $nill
Outcome 2: The incidence and impact of crime are minimised through effective
investigations
Cost of Outcome $22.035m
Outcome 3: Road safety is maximised in the ACT
Cost of Outcome $5.648m
Outcome 4: The adverse impact of public emergencies/disasters and risk associated
with major events is minimised Cost of Outcome $3.015m
Outcome 5: Prosecution and Judicial processes are effectively supported Cost of Outcome $3.265m
Outcome 6: Information needs of clients are satisfied
Cost of Outcome $1,177m
In relation to ‘investigation services’, there have been three performance measures developed.
They are:
1. Disruptive effect of the AFP investigations on the criminal environment.
2. Client satisfaction with AFP investigations.
3. The level of financial performance of the AFP in delivering cost-effective results.35 Each of the above measures have underlying actual indicators to provide performance information in relation to output 1.1.
For further details about the objectives, performance measures and actual indicators in relation to output 1.1 see Table 2.1.
Output 1.2 – Protection Services
The output class ‘protection services’ relates to the AFP’s role in providing safety and security to those persons identified as being at risk by the Commonwealth Government.
These people include very important persons, federal parliamentarians, internationally protected persons and Judges of the Family Court of Australia. Other services provided by the AFP in relation to this output include the administration of the National Witness
Protection Program, security planning for special events and provision of intelligence to other agencies through the National Bomb Data Centre.
There have been three performance measures developed for ‘protection services’.
They are:
1. Prevention of avoidable incidents.
2. Client satisfaction with AFP investigations.
3. The level of financial performance of the AFP in delivering cost-effective results.36 Each of the above measures have underlying actual indicators to provide performance information in relation to output 1.2.
For further details about the objectives, performance measures and actual indicators in relation to output 1.2 see Table 2.1.
Output 1.3 – International Services
The output class ‘international services’ centres around the AFP’s efforts to curb transnational crime. To meet the objectives of this output the AFP has established collaboration
arrangements with various overseas law enforcement agencies. The AFP’s provision of the Interpol National Central Bureau, on behalf of all Australian State and Territory police services, is also allocated to output class 1.3.
35 Australian Federal Police, AFP Portfolio Budget Statements 2001-2002, Commonwealth of Australia, p 214.