Short-term effects of the global economic and financial crisis on households in three developing countries
The cases of El Salvador, Tajikistan and Cambodia
Esther Gehrke
Bonn 2012
The Deutsche Nationalbibliothek lists this publication in the Deutsche Nationalbibliografie; detailed bibliographic data is available in the Internet at http://dnb.d-nb.de.
ISBN 978-3-88985-554-1
Esther Gehrke, Researcher at German Development Institute / Deutsches Institut für Entwicklungs- politik (DIE)
E-Mail: esther.gehrke@die-gdi.de
© Deutsches Institut für Entwicklungspolitik gGmbH Tulpenfeld 6, 53113 Bonn
+49 (0)228 94927-0 +49 (0)228 94927-130 E-Mail: die@die-gdi.de www.die-gdi.de
I would like to thank Markus Loewe for his continuous guidance and advice. I am also grateful to Tilman Altenburg and Peter Wolff for their invaluable comments and sugges- tions. Any remaining errors are my own. Funding from the Federal Ministry for Economic Cooperation and Development (BMZ) is gratefully acknowledged. I am grateful to the World Bank, the Dirección General de Estadística y Censos (El Salvador) and the Cambo- dia Institute of Statistics for permission to use their data.
ADB Asian Development Bank
CSES Cambodia Socio-Economic Survey CIS Commonwealth of Independent States DAC Development Assistance Committee EAP East Asia and Pacific
ECA Europe and Central Asia
EHPM Encuesta de Hogares de Propósitos Múltiples FDI Foreign direct investment
GDP Gross domestic product GNI Gross national income
IDS Institute of Development Studies, University of Sussex ILO International Labour Organization
IMF International Monetary Fund LAC Latin America and Caribbean’
LCU Local currency units LIC Low income country
LMIC Lower middle income country
LSMS Living Standards Measurement Survey MENA Middle East and North Africa
NA North America
ODA Official Development Assistance OLS Ordinary Least Squares
PATI Programa de Apoyo Temporal al Ingreso PPP Purchasing power parities
SSA sub-Saharan Africa
UNDP United Nations Development Programme
WFP World Food Programme
Abbreviations
Executive summary 1
1 Introduction 3
2 Short-term effects of the economic and financial crisis on developing
countries 4
2.1 Transmission channels of the global economic and financial crisis 4
2.1.1 The wealth channel 6
2.1.2 The investment channel 6
2.1.3 The trade channel 9
2.1.4 The transfer channel 9
2.2 Policy response 10
2.3 Determinants of the short-term macroeconomic effects 11
2.3.1 Methodological approach 11
2.3.2 Regression results for all countries 12
2.3.3 Regression results for low and lower middle income countries 17 3 Short-term effects of the economic and financial crisis on households in
El Salvador, Tajikistan and Cambodia 18
3.1 Methodological approach 19
3.2 El Salvador 21
3.2.1 Macroeconomic effects and policy responses 21
3.2.2 Microeconomic effects 22
3.3 Tajikistan 29
3.3.1 Macroeconomic effects and policy responses 30
3.3.2 Microeconomic effects 31
3.4 Cambodia 38
3.4.1 Macroeconomic effects and policy responses 38
3.4.2 Microeconomic effects 39
4 Conclusions 46
Bibliography 49
Annexes
Annex I Robustness Checks
Annex II Variable definitions and sources for Chapter 2 Annex III Variable definitions for Chapter 3
Figure 2 GDP per capita growth by country per-capita income level 5 Figure 3 Net foreign assets (% of GDP) by country per-capita income level 7
Figure 4 Net foreign assets (% of GDP) by region 7
Figure 5 Net private financial flows by region (in US$ billions) 8
Figure 6 Export and import growth in 2009 by region 9
Figure 7 Remittances inflows by region (in current US$ billions) 10 Figure 8 Scatterplot Change in GDP per Capita growth – Exports to US and
Western Europe 15
Figure 9 Scatterplot Change in GDP per capita growth – Government debt 16
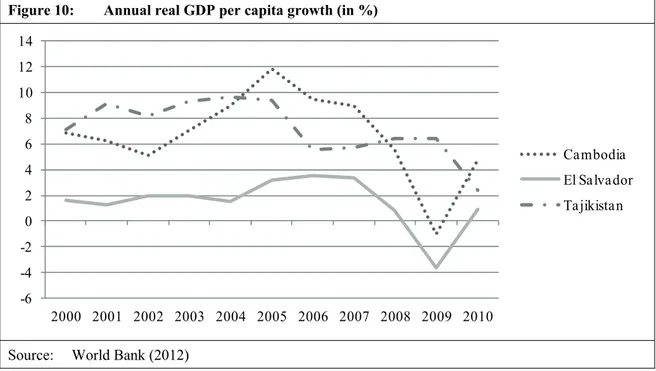
Figure 10 Annual real GDP per capita growth (in %) 19
Figure 11 General government revenue and expenditure in El Salvador 21 Figure 12 Income composition of the lowest income decile in El Salvador 25 Figure 13 Income composition of the highest income decile in El Salvador 26 Figure 14 General government revenue and expenditure in Tajikistan 31 Figure 15 Income composition of the lowest income decile in Tajikistan 34 Figure 16 Income composition of the highest income decile in Tajikistan 34 Figure 17 General government revenue and expenditure in Cambodia 39 Figure 18 Income composition for the lowest income decile in Cambodia 42 Figure 19 Income composition for the highest income decile in Cambodia 42 Tables
Table 1 Regression results for all countries 13
Table 2 Regression results for LMIC & LIC 17
Table 3 Change in monthly per capita income by income deciles in El Salvador 23 Table 4 Change in monthly per capita income from labour by income decile in
El Salvador 23
Table 5 Change in monthly per capita income from remittances by income dec-
ile in El Salvador 24
Table 6 Change in monthly per capita income from social assistance by income
decile in El Salvador 25
Table 7 Change in monthly per capita income by socio-demographic
characteristics in El Salvador 27
Table 8 Change in monthly income per capita by socio-demographic character- istics of the poorest 30% of the population in El Salvador 29 Table 9 Change in monthly per capita income by income deciles in Tajikistan 32 Table 10 Change in monthly per capita income from labour by income deciles in
Tajikistan 32 Table 11 Change in monthly per capita income from social assistance by income
deciles in Tajikistan 33
Table 12 Change in monthly per capita income by socio-demographic character-
istics in Tajikistan 35
Table 14 Change in monthly per capita income from labour by socio-
demographic characteristics for the poorest 30% of the population in
Tajikistan 37 Table 15 Change in monthly per capita income by income deciles in Cambodia 40
Table 16 Change in monthly per capita income from labour by income deciles in
Cambodia 41 Table 17 Change in monthly per capita income from social assistance by income
deciles in Cambodia 41
Table 18 Change in monthly per capita income by socio-demographic character-
istics in Cambodia 43
Table 19 Change in monthly per capita income by socio-demographic character- istics for the poorest 30% of the population in Tajikistan 45
Executive summary
The global economic and financial crisis erupted in late 2008 while many developing countries were still suffering from the effects of the fuel and food price crisis of 2007, raising fears that the latest crisis would exacerbate the effects of the fuel and food crisis, and lead to significant increases in poverty and higher rates of unemployment worldwide.
Soon after the financial crisis hit, a lot was published about the degree to which it was affecting developing countries and their populations.
Three years after the peak of the global economic and financial crisis, our understanding of its microeconomic effects in developing countries remains limited. Literature on its macroeconomic effects generally concludes that developing countries were able to over- come the economic shock fairly quickly and that there are only a few signs of serious last- ing effects. But some authors, who have assessed the micro-level effects of the crisis on vulnerable groups in developing countries, discovered considerable losses of income and warn of second-round effects in developing countries with lasting consequences for gen- eral wellbeing. Both the existing micro- and the macroeconomic approaches have draw- backs that seriously limit our understanding of the microeconomic effects of the global crisis in developing countries.
This paper presents new evidence regarding the short-term microeconomic effects of the global economic and financial crisis in selected developing countries. It is divided into two main parts. The first part re-examines evidence about the channels of transmission of the global crisis and its immediate macroeconomic effects on developing countries. It also pro- vides quantitative evidence about the relevance of each channel in transmitting the crisis worldwide and in particular, to developing countries. The second part of the paper analyses short-term effects of the crisis on households in three developing countries: El Salvador, Taji- kistan and Cambodia. It provides evidence that is nationally representative showing which population groups were most affected by the crisis and the comparative effectiveness of na- tional response strategies in protecting households from its adverse consequences. The paper concludes with suggestions about designing social protection schemes that could cushion the micro-level effects of economic crises in developing countries.
The economic and financial crisis affected countries (other than the United States) through four transmission channels: the wealth channel, the investment channel, the trade channel and the transfer channel. At the macroeconomic level, the trade and investment channels were most responsible for severe output losses. The crisis was transmitted in sequences: to begin with, the subprime crisis led to the worldwide depreciation of financial assets. De- spite the fact, that many countries suffered significant reductions in asset holdings, the wealth channel does not seem to have caused major long-term damage to economic growth. But then, the collapse of Lehman Brothers brought about the abrupt end to inter- bank lending, a dramatic increase in the cost of finance and the sudden interruption of global investment flows. The investment channel had serious repercussions on economic performance and growth prospects planet-wide. The ensuing financial collapse triggered a deep recession in the US and Europe and to a drastic decline in global aggregate demand and world trade volumes. The trade channel seriously affected exporting countries all over the world, directly affecting economic output and leading to income contractions. Finally, the recession in high-income countries caused remittances to developing countries to de- crease. Because only a few developing countries are highly dependent on remittances, cross-country evidence suggests that the transfer channel was not very relevant. Yet re- duced transfers severely affect welfare in economies that are dependent on remittances.
This paper makes the case that countercyclical policies were crucial in determining the extent to which the crisis affected individual countries. In contrast to previous economic crises, many governments embarked on countercyclical policies as soon as the global eco- nomic and financial crisis erupted. Our empirical analysis suggests that this most recent economic and financial crisis was less severe than expected and that most countries recov- ered relatively quickly because their fiscal positions had improved before the crisis – meaning that extensive countercyclical fiscal and monetary policies were affordable.
The crisis nevertheless affected many countries – developed and developing. We have ana- lysed El Salvador, Tajikistan and Cambodia in order to assess the microeconomic effects of the crisis in those developing countries that experienced income contractions or growth revi- sions in 2009. Evidence from these countries suggests that the crisis primarily affected house- holds through the labour market and through decreased inflows of remittances.
Job losses and wage reductions were observed in all three countries. Job losses in the formal sector appear to have increased pressure on the informal sector, causing incomes to drop and conditions in the labour market to worsen. In El Salvador, Tajikistan and Cambodia, entrepre- neurs suffered the greatest income contractions. Informal entrepreneurs were also affected, but to different degrees in each country. In terms of socio-demographic background, households with lower educational backgrounds were more severely affected than more highly educated households, at least in Tajikistan and El Salvador. The impact of the labour market on the poorest households varied considerably between the countries. In countries where the poor mainly live off agricultural production, the poorest deciles fared relatively well. But in El Sal- vador, where income from labour contributes as much as 50% to household income in the lowest income decile, the poor suffered a lot.
In economies that are dependent on remittances, the transfer channel plays a large role at the micro-level. Households with migrating household members evidenced income reduc- tions in all three countries despite variations in their share of the population, as well as in the amount of the drop in remittances. The reductions were greatest in El Salvador and Tajikistan and least in Cambodia.
During the crisis, changes in social spending significantly affected household incomes in Tajikistan and El Salvador, but not in Cambodia. The poorest deciles in Tajikistan faced reductions in income from social assistance despite government attempts to shield the most vulnerable groups. In El Salvador, in contrast, the poorest households most benefited from increased social spending. In Cambodia, social spending remained negligible during the crisis.
This paper concludes that scaling up existing cash transfer schemes might be the most feasi- ble option for most low and middle income countries in order to protect their populations from the adverse consequences of economic shocks. In times of crisis, cash transfer pro- grammes –including public works – can be extended to increase benefits per capita or to reach more of those vulnerable to the effects of a crisis. However, if there are no pre- existing transfer schemes, it is difficult to target additional social spending to those most in need. Building up cash transfer schemes ad-hoc is more difficult than expanding existing ones. Nonetheless, some countries have been successful in building new transfer schemes during crises. In such cases, a careful assessment about the kinds of programmes that are feasible in light of each country’s financial and institutional capacities is indispensable.
1 Introduction
The global economic and financial crisis of 2008–2009 erupted while many developing countries were still suffering from the effects of the fuel and food price crisis of 2007, causing fears that the latest crisis would exacerbate the effects of earlier crisis and lead to considerable increases in poverty and greater rates of unemployment rates worldwide. The relatively modest impact that the economic and financial crisis had on the economic per- formance of many developing countries gave lie to this fear and with early signs of recov- ery, many observers concluded that the economic and financial crisis was felt less strongly there than in the developed world. Today, however, three years after the crisis peaked, we still do not know much about the microeconomic effects of the global economic and fi- nancial crisis on developing countries.
Early assessments of the effects of the global economic and financial crisis on developing countries were mostly published by the International Monetary Fund (IMF) and the World Bank – soon after the crisis had peaked. Several studies suggested that the impact of the crisis on developing countries was less harsh than expected (IMF 2009; World Bank 2009; World Bank / IMF 2010). Additional insights into the macroeconomic effects of the crisis were pro- vided, among others, by Rose and Spiegel (2009), Berg et al. (2010) and Berkmen et al.
(2012), who analysed the factors that determine the degree to which various countries were affected. Both strands of literature help us understand the transmission channels of the crisis.
They also indicate the specificities of this particular crisis in comparison with previous crises.
But although these studies provide highly relevant insights into the macroeconomic effects of the crisis on developing countries, its micro-level effects remain unclear. The lack of adequate and timely available data for microeconomic impact assessments inspired some authors to conduct simulation studies (e.g. Ravallion 2009; Friedman / Shady 2009), while others ex- perimented with rapid qualitative assessments. Conducted by the Institute of Development Studies (IDS), Asian Development Bank (ADB), International Labour Organization (ILO), World Bank (WB), United Nations Development Programme (UNDP) and World Food Pro- gramme (WFP), such assessments aimed at providing timely evidence about the impact of the crisis on firms and households in selected countries and sectors (i.a. WFP 2009; Bauer / Thant 2010; Heltberg / Hossain / Reva 2012). In contrast to the macro-literature, many of these stud- ies found significant effects of the crisis in developing countries, providing evidence that members of more vulnerable groups, such as workers with lower educational backgrounds, informal-sector employees and own-account workers suffered the most during the crisis.
However, the representativeness of these findings is weak, since only some countries and sec- tors were included and because many of the survey sites and sectors were specifically selected because of their vulnerability to the effects of the crisis. It is therefore not possible to derive generalisable results from these findings. Quantitative and nationally representative studies have been provided in only a few cases (McCulloch / Grover 2010; Kroeger / Meier 2012).
This paper furnishes new evidence about the short-term microeconomic effects of the global economic and financial crisis. It is divided into two main parts. The first part – Chapter 2 – reassesses the evidence regarding transmission channels and the immediate macroeconomic effects of the global crisis. It also provides quantitative evidence about each channel’s rele- vance in transmitting the crisis – worldwide, and to developing countries in particular. This part is necessary in order to understand the mechanisms through which countries were af- fected by the crisis and their effects on the populations of developing countries. The second main part of this paper – Chapter 3 – analyses the short-term effects of the crisis on house-
holds in El Salvador, Tajikistan and Cambodia. It provides nationally representative evi- dence from three developing countries that were affected by the crisis, although to different degrees and through different channels. The paper thus shows which population groups were most affected by the recent crisis and the effectiveness of national response strategies in protecting households from the global crisis. Chapter 4 concludes with tentative thoughts about how social protection schemes could be designed to cushion some microeconomic effects of economic crises in developing countries.
2 Short-term effects of the economic and financial crisis on developing countries
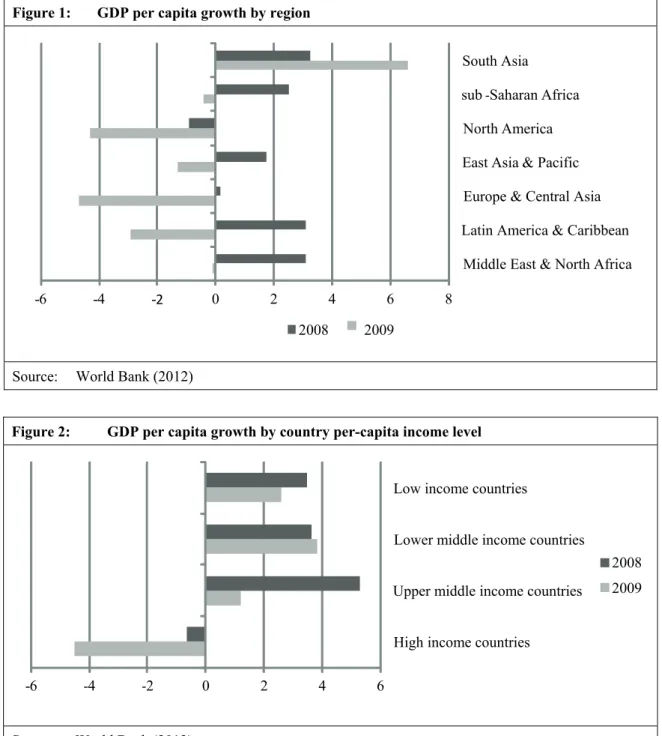
The global economic and financial crisis led to gross domestic product (GDP) contractions in most of the world. In 2009, at the peak of the crisis, GDP per capita growth became negative in every region except for South Asia (as shown in Figure 1). The global eco- nomic and financial crisis most severely impacted Europe and Central Asia, North Amer- ica, Latin America and Caribbean, and East Asia and Pacific.
High income countries were the first to suffer the consequences of the breakdown of the financial markets in the United States. They also faced the deepest overall impact, with average GDP per capita growth rates around -4.5% in 2009 (Figure 2). But al- though the growth rate of GDP per capita remained positive for the group of low and middle income countries as a whole, it did slow down markedly and turned negative for some of them. The effect of the crisis on developing countries is particularly im- portant because even small corrections to the growth prospects of developing countries can threaten progress in poverty reduction and make it more difficult to reach the Mil- lennium Development Goals.
The rest of this chapter provides more detailed evidence about how the economic and fi- nancial crisis was transmitted from its epicentre to the rest of the world, and the relevance of these effects to developing countries. Section 2.1 explains the channels that were re- sponsible for transmitting the crisis worldwide, and to developing countries in particular.
Section 2.2 describes different policy responses that served to partly offset the effects of the crisis and Section 2.3 quantitatively assesses the factors that determine the short-term macroeconomic effects of the global crisis.
2.1 Transmission channels of the global economic and financial crisis
Although the subprime crisis started in the United States, its repercussions were felt world- wide. The collapse of Lehman Brothers in autumn 2008 transformed the financial crisis into a global economic crisis, which was transmitted to the rest of the world through four main channels: the wealth channel, the investment channel, the trade channel and the transfer chan- nel. The trade and the investment channels were most responsible for high output losses at the macroeconomic level. The transfer channel also played an important role in the global trans- mission of the crisis, but because only a few countries are highly dependent on inflows of re- mittances, its effect is more visible at the micro- than the macro-level.
The crisis was transmitted in sequences. First, the subprime crisis led to the worldwide depreciation of financial assets, what is referred to as the wealth channel. The collapse of Lehman Brothers was followed by an interruption in global interbank lending and the abrupt end to investment flows: the investment channel. The financial collapse led to deep reces- sions in the US and Europe, and to drastic declines in global aggregate demand and trade volumes. This trade channel affected exporting countries all over the world. Finally, the transfer channel refers to the drop in public and private transfers to developing countries caused by decreasing public revenues and rising unemployment in high income countries.
Sections 2.1.1 to 2.1.4 show how each of these four channels helped transmit the crisis to developing countries.
Figure 1: GDP per capita growth by region
Source: World Bank (2012)
Figure 2: GDP per capita growth by country per-capita income level
Source: World Bank (2012)
- 6 -4 -2 0 2 4 6
High income countries
Upper middle income countries Lower middle income countries Low income countries
2008 2009
- 6 - 4 -2 0 2 4 6 8
Middle East & North Africa Latin America & Caribbean Europe & Central Asia East Asia & Pacific North America
sub-Saharan Africa
South Asia
2008 2009
2.1.1 The wealth channel
Although the wealth channel caused the worldwide depreciation and destruction of finan- cial assets that were highly exposed to US assets backed by sub-prime mortgages, it did not contribute significantly to the transmission of the economic and financial crisis (Lane / Milesi-Ferretti 2010). In contrast to expectations at the start of the financial crisis, in most developing countries only some assets were destroyed.
A country’s economic structure determines the degree to which the destruction of assets might result in lower rates of growth. This is especially true if investments are financed from assets holdings and if the destruction of assets is accompanied by lower rates of sub- sequent investment. The severity of this effect depends on the initial endowment of finan- cial assets, which means that it should be most felt in rich countries. High income coun- tries have the highest average share of net foreign assets in GDP; in low- and middle- income countries the share is rather modest (Figure 3). The highest shares of foreign assets in GDP can be found in the Europe and Central Asia (ECA), East Asia and Pacific (EAP) and Middle East and North Africa (MENA) regions (Figure 4).
To assess the relevance of this channel, we compared the share of net foreign assets in GDP over time and across regions and country groups1 and found no significant reduc- tion in the share of net foreign assets in GDP from 2007 to 2009. While this share dropped slightly from 2007 to 2008 in most regions, and – except for high income OECD countries – for all income levels as well, in 2009 it recovered and in many cases, surpassed 2007 levels.
The decrease in net foreign assets did not seem dependent on the initial endowment: some regions and groups of countries saw almost no change in their percentage of net foreign assets of GDP while others experienced change independent of the initial level. The de- preciation of foreign assets seems to have been greatest for reporting economies in the Middle East and North Africa, and in East Asia and Pacific, as well as for high income non-OECD countries – but these were not the regions and country groups that suffered the deepest growth contractions during the financial crisis.
In contrast to our expectations, 2009 brought a remarkable increase in the percentage of net foreign assets in GDP in certain regions and in high income countries. This could be explained by the fact that if the absolute values remain constant, a decrease in GDP auto- matically increases the share of net foreign assets in GDP. This is plausible given the con- tractions in GDP in Latin America and Caribbean (LAC), EAP, ECA and North America (NA), but it does not appear to be the only explanation. It seems as if markets were able to recover relatively quickly from the destruction of assets. For example, countries in the MENA region were able to accumulate foreign assets even in 2008 and 2009 because of the persistently high fuel prices.
2.1.2 The investment channel
The investment channel significantly contributed to the international transmission of the financial crisis, causing deep impacts on developing and developed economies. As a consequence of the Lehman Brothers’ crash in 2008, interbank lending collapsed entirely,
1 We used the share of net foreign assets in GDP as an indicator for the destruction of financial assets because it was the only indicator available at the aggregate level. In addition, most financial assets were depreciated in the US; for all other countries, the effect would have been most evident on foreign, as opposed to total, assets. This measure is imprecise because it changes with fluctuations of the GDP.
Figure 3: Net foreign assets (% of GDP) by country per-capita income level
Source: World Bank (2012)
Figure 4: Net foreign assets (% of GDP) by region
Source: World Bank (2012)
leading to the worldwide interruption of investment flows. Countries with high foreign investment inflows prior to the onset of the crisis were especially susceptible.
An interruption of financial flows seriously affects economic growth because capital be- comes more expensive. Higher borrowing costs and tighter credit rationing usually lead to lower investment rates and lower future economic growth. Drastic changes – such as those observed during the global economic and financial crisis – immediately affect output lev- els because the transition from high to low capital-output ratios leads to discontinuities in the production process and to output losses.
0 10 20 30 40 50 60
East Asia & Pacific Europe & Central Asia Latin America & Caribbean Middle East & North Africa North America South Asia Sub-Saharan Africa
2007 2008 2009
0 10 20 30 40 50 60 70
High income countries: nonOECD High income countries: OECD Upper middle income countries Lower middle income countries Low income countries
2007 2008 2009
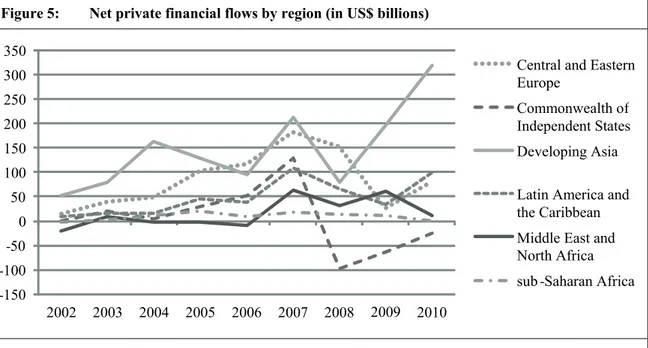
The sharp drop in financial flows in 2007 and 2008 affected almost all developing regions.
Only the Commonwealth of Independent States (CIS) suffered net outflows of private fi- nance (Figure 5). Other regions that experienced pronounced contractions were Develop- ing Asia and Central and Eastern Europe. Although there were huge variations, contrac- tions for the whole group of developing and emerging economies were modest compared to those in high income countries, where in 2009, net private financial inflows fell on av- erage by 90.6% (World Bank 2012). Between 2008 and 2009, net inflows to all high in- come countries fell by a total of US$ 630 billion. A clear overlap is observed of the re- gions and country groups affected by the financial effects and those that suffered income contractions at the peak of the crisis.
Not only the share of foreign liabilities in GDP, also the composition of financial flows and their stability determined whether or not this channel affected a particular country.
The huge differences between high, middle and low income countries can be explained partly by poorer countries’ limited integration in international financial markets2, and also by the higher share of more stable Foreign direct investment (FDI) in total liabilities in middle income, as compared with high income countries3. As shown in Figure 5, the fi- nancial crisis was preceded by a period of above-average growth of international invest- ment flows, which may have been of questionable sustainability even before the crisis.
The composition of pre-crisis investment flows is likely to have influenced the severity of the contraction of post-crisis inflows (after 2008).
2 The average foreign liabilities share of GDP is 88.3%, 72.2% and 82.7% for low income, lower middle income and upper middle income countries respectively, and 287.1% for high income countries (IMF 2010a).
3 The average share of FDI in total investment stocks is 42.6% in upper middle income countries and 44.8% in lower middle income countries. In high income countries the share is 20.5% (IMF 2010a).
Figure 5: Net private financial flows by region (in US$ billions)
Notes: Net private financial flows comprise net private direct investments, net private portfolio flows and net other private financial flows. Data are available for developing regions only.
Source: IMF (2011) -150
-100 -50
0 50 100 150 200 250 300 350
2002 2003 2004 2005 2006 2007 2008 2009 2010
Central and Eastern Europe
Commonwealth of Independent States Developing Asia Latin America and the Caribbean Middle East and North Africa sub-Saharan Africa
2.1.3 The trade channel
The interruptions in trade flows were felt in every region and significantly contributed to the international transmission of the economic and financial crisis. Trade flows slowed in late 2008 and collapsed completely in 2009 (Ocampo et al. 2010), that is, the trade chan- nel became significant after the wealth and investment channels.
In Western Europe and the US, recessions led to a sharp decline in the demand for goods and services from all over the world. Export markets in developed and developing coun- tries were affected, with major repercussions on aggregate production and employment in the affected economies.
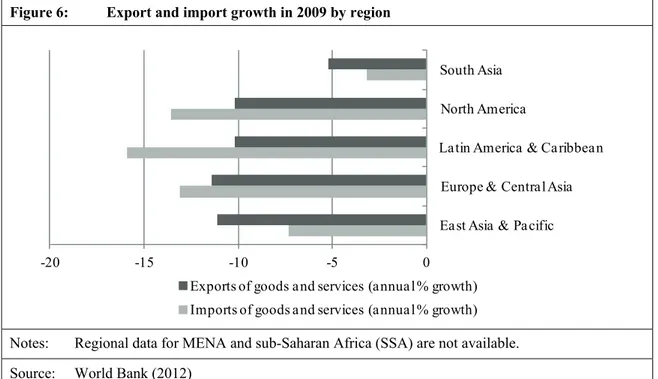
Import and export growth was negative in 2009 for every region of the world (Figure 6), with the value of exports decreasing by more than 10 per cent except in South Asia. Ex- port contractions were most pronounced in Europe and Central Asia, and in East Asia and Pacific, followed by Latin America and Caribbean, and North America. These four re- gions were also the regions with the sharpest growth contractions in 2009.
Figure 6: Export and import growth in 2009 by region
Notes: Regional data for MENA and sub-Saharan Africa (SSA) are not available.
Source: World Bank (2012)
2.1.4 The transfer channel
With a few exceptions, international transfers in the form of official aid and private remit- tances remained more or less stable during the financial crisis. This suggests that the trans- fer channel contributed less than expected to the international transmission of the crisis (e.g. Ocampo et al. 2010). Nonetheless, it is likely that those regions and countries with reduced transfer inflows also experienced lower income growth.
Since the recessions were deepest in high income countries, countries that depend on them for regular flows of remittances or development assistance should have been af- fected (Brach / Loewe 2009). While public transfers mainly affect GDP through gov- ernment spending, reduced private transfers affect household income and consumption.
-20 -15 -10 -5 0
East Asia & Pacific Europe & Central Asia Latin America & Caribbean
North America South Asia
Exports of goods and services (annual % growth) Imports of goods and services (annual % growth)
Both government spending and household consumption directly contribute to GDP, meaning that reductions in international transfers almost always affect economic growth.
Official aid flows remained stable during the crisis, with the Middle East and North Africa the only region that experienced negative growth in Official Development Assistance (ODA) (World Bank 2012). In all other regions, ODA grew throughout the crisis, so it is unlikely that reduced aid flows played a role in transmitting the crisis to developing and emerging economies.
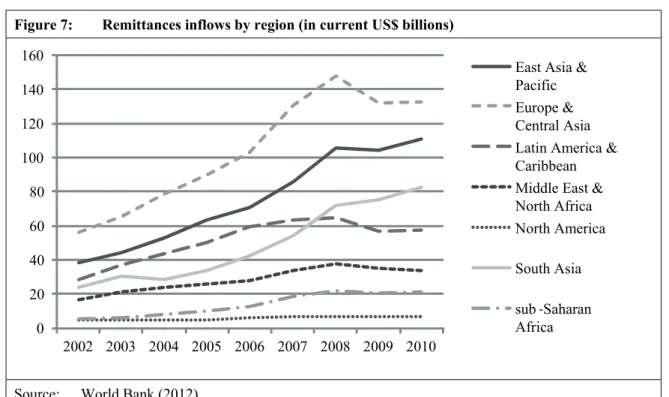
During the crisis, remittances inflows grew steadily in East Asia and Pacific as well as in South Asia, and remained more or less constant in sub-Saharan Africa and the Middle East and North Africa. Inflows of remittances decreased in only two regions – Europe and Cen- tral Asia, and Latin America and Caribbean (Figure 7). However, the fact that in 2009 these two regions posted significant output losses suggests that the drop in remittances inflows may have played a role in the economic performance of some countries and re- gions. In the ECA region, which experienced the strongest decline, remittances fell by as much as 10.8% in 2009 (World Bank 2012).
Figure 7: Remittances inflows by region (in current US$ billions)
Source: World Bank (2012)
2.2 Policy response
Some countries were able to withstand the transmission effects of the crisis because their governments were willing and able to react in good time. This crisis appears to have been less severe than expected, with most countries recovering from it relatively quickly due to the improved fiscal positions of many countries prior to the crisis and thanks to extensive countercyclical policies that were initiated as soon as the crisis erupted (Ocampo et al. 2010; World Bank 2010a). Policy response variously influ- ences the incidence and severity of a crisis.
0 20 40 60 80 100 120 140 160
2002 2003 2004 2005 2006 2007 2008 2009 2010
East Asia &
Pacific Europe &
Central Asia Latin America &
Caribbean Middle East &
North Africa North America South Asia sub -Saharan Africa
First, a country’s exchange rate regime can influence the severity with which an external shock is transmitted to the domestic market. Berkmen et al. (2012) suggest that countries with flexible exchange rates are better equipped to handle external shocks, a finding that was supported by Lane and Milesi-Ferretti (2010).
Second, increased government spending can stimulate internal demand, thereby offsetting the negative effects of trade contractions. In all regions, government spending increased during the crisis (IMF 2011) and in many countries and regions sound economic and fiscal policies were able to dampen its adverse effects (IMF 2010b). However, the timing and scale of government spending growth varied between regions. Governments in Latin America and Caribbean and in Developing Asia began to increase spending in 2007, whereas governments in the Commonwealth of Independent States and the Middle East and North Africa sharply increased spending only in 2009.
Third, initial debt can serve as an indicator for a government’s ability to react to a crisis.
In the years prior to the global financial and economic crisis of 2008, many developing countries had managed to improve their fiscal position and reduce external debt, leading to expectations that these countries would suffer less during the financial crisis. Initial debt levels can also serve as indicators for the sustainability of countercyclical policies.
Data regarding government manœuverability is not available at the aggregate level; the significance of these factors is assessed in the next section.
2.3 Determinants of the short-term macroeconomic effects
This section assesses whether the huge cross-country variation in macroeconomic per- formance observed in 2009 can be explained by the exposure of individual countries to the transmission channels of the global economic and financial crisis. This is tested in a cross- country regression analysis, which shows that three main factors determine the depth to which an economy was affected by the global crisis: the country’s trade structure; its fi- nancial structure; and its willingness and ability to react to the crisis. This indicates the significance of a country’s vulnerability to the two most relevant transmission channels of the global crisis –the investment and the trade channels. However, it also shows that, at least in the short-term, prudent countercyclical fiscal and economic policies were crucial for cushioning the effects of the crisis in developed and developing countries.
Section 2.3.1 describes the empirical approach in more detail; the regression results for all countries – and specifically for low and lower middle income countries – are discussed in sections 2.3.2 and 2.3.3.
2.3.1 Methodological approach
In our empirical analysis, we tested the country characteristics that can be used to predict how strongly an economy was affected by the global economic and financial crisis. We used the difference in GDP per capita growth rates4 – the difference between the growth
4 This value is obtained by subtracting the average growth rate between 1997 and 2007 from the actual growth rate in 2009. This indicator seems to best represent the crisis-induced disruption of general
rate in 2009 and the average of growth rates in the years before the crisis – as a proxy for the severity of the short-term effects of the global crisis. In contrast to existing literature, we took into account not only the variables that can predict a country’s vulnerability to the four transmission channels of the crisis, but also the variables that represent a country’s resilience to the crisis.
Potential explanatory variables were grouped into five categories: proxies for a country’s vulnerability to each of the four transmission channels, plus variables that proxy a coun- try’s resilience. In each category, the two or three variables with the highest explanatory power (the strongest bivariate correlation) were retained.5 The estimation strategy was an Ordinary Least Squares (OLS) model. We conducted cross-sectional regressions with dif- ferent combinations of our explanatory variables in order to identify which variables are robust under different specifications. Our dataset contained 94 to 112 countries, depending on the specified model. The results are presented and discussed in the following section with reference to findings in the literature.
In Section 2.3.3, the regression was restricted to low income and lower middle income countries, in order to test the validity of our results for the subset of poorer countries. This step was also necessary for testing if variables that are not significant in the global context might have predictive power for poorer countries.
2.3.2 Regression results for all countries
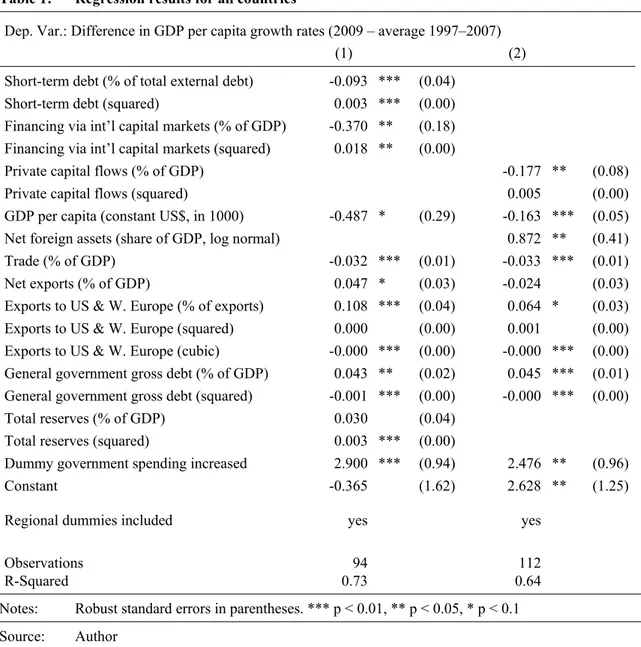
The quantitative analysis reveals that much of the observed global variance in the macro- economic effects of the global economic and financial crisis can be explained by just a few variables. First, dependency on financial flows negatively impacted on macroeco- nomic performance during the financial crisis. The global disruption of international fi- nancial flows hit countries with a large share of volatile investment inflows especially hard. Second, the share of trade in GDP influenced the severity of the crisis impact. Some countries were more affected by the crisis than others because of their respective trade structures and degrees of economic integration into global value chains, which – espe- cially if a country was linked to the crisis epicentres – partly accounts for the considerable regional differences. Countries dependent on exports to the United States and Western Europe were especially affected by the crisis. Third, governmental reactions were of great significance. This section suggests a strong positive connection between changes in gov- ernment spending during the crisis and its effects. The fact that many countries instituted countercyclical policies during the crisis can help explain why in many countries, the ef- fects of the crisis were less severe than expected and the recovery more rapid than pre- dicted.
Two models are reported in Table 1. Our preferred model is the first one, but we also re- port the results of the second model, which serves as a robustness check. In both models, regional dummies were included because they increase the model’s predictive power and growth trends. Just looking at the growth rate would not reveal the differences between countries with long trends of low growth rates and countries that were performing well before the crisis but which suf- fered greatly from its impact. Unfortunately, it remains impossible to abstract from other reasons for the change in output growth.
5 See Annex II for a list of variables, and their definitions and sources.
Table 1: Regression results for all countries
Dep. Var.: Difference in GDP per capita growth rates (2009 – average 1997–2007)
(1) (2) Short-term debt (% of total external debt) -0.093 *** (0.04)
Short-term debt (squared) 0.003 *** (0.00)
Financing via int’l capital markets (% of GDP) -0.370 ** (0.18) Financing via int’l capital markets (squared) 0.018 ** (0.00)
Private capital flows (% of GDP) -0.177 ** (0.08)
Private capital flows (squared) 0.005 (0.00)
GDP per capita (constant US$, in 1000) -0.487 * (0.29) -0.163 *** (0.05) Net foreign assets (share of GDP, log normal) 0.872 ** (0.41)
Trade (% of GDP) -0.032 *** (0.01) -0.033 *** (0.01)
Net exports (% of GDP) 0.047 * (0.03) -0.024 (0.03)
Exports to US & W. Europe (% of exports) 0.108 *** (0.04) 0.064 * (0.03) Exports to US & W. Europe (squared) 0.000 (0.00) 0.001 (0.00) Exports to US & W. Europe (cubic) -0.000 *** (0.00) -0.000 *** (0.00) General government gross debt (% of GDP) 0.043 ** (0.02) 0.045 *** (0.01) General government gross debt (squared) -0.001 *** (0.00) -0.000 *** (0.00)
Total reserves (% of GDP) 0.030 (0.04)
Total reserves (squared) 0.003 *** (0.00)
Dummy government spending increased 2.900 *** (0.94) 2.476 ** (0.96)
Constant -0.365 (1.62) 2.628 ** (1.25)
Regional dummies included yes yes
Observations 94 112
R-Squared 0.73 0.64
Notes: Robust standard errors in parentheses. *** p < 0.01, ** p < 0.05, * p < 0.1 Source: Author
have a positive influence on the normal distribution of the residuals. Furthermore, they only affect the size, not the sign, of our estimates and lead to somewhat more conservative predic- tions. For a comparison of the results with and without regional dummies, see Annex I.
Wealth levels
We were not able to determine the relevance of wealth levels for explaining the differ- ence in GDP per capita growth. We found that GDP per capita levels before the crisis were negatively correlated with our measure for crisis impact. But including the logged share of net foreign assets to GDP revealed its strong positive relationship to our dependent variable. Apparently, the fact that financial assets were destroyed during the crisis was irrelevant to subsequent growth rates. It seems plausible to conclude that countries with high shares of net foreign assets were less vulnerable to the other ef- fects of the crisis and so fared better. The strong negative sign of the GDP level coeffi- cient may result from the fact that the crisis started in the US and Western Europe, where it was felt most acutely.
Financial linkages
Our findings support the hypothesis that the investment channel accounted for a large share of the macroeconomic effects of the crisis. Both the composition of investment flows – measured as the share of short-term debt in the total external debt – and the rele- vance of the economy’s external financing had statistically significant negative coeffi- cients (Table 1). Two different measures for the importance of external financing were tested: first, the share of financing via international capital markets in GDP (the sum of gross bond issuance, bank lending and new equity placements) and second, the share of private capital flows in GDP (net foreign direct investments and portfolio investments).
Both were found to be statistically significant with high negative coefficients. This implies that countries that were particularly dependent on foreign investment inflows prior to the crisis experienced deeper recessions than those that were not. Similar results are reported in Berkmen et al. (2012) and in Lane and Milesi-Ferreti (2010).6
Trade dependency
Statistical evidence also suggests that the degree to which a country was exposed to the trade channel correlates with the difference in 2009 GDP per capita growth. Our analysis revealed that trade dependent economies – especially those with the US and Western Europe as export partners – were harder hit by the global crisis than other countries. Since trade was a major channel for globally transmitting the crisis, it understandably explains part of the incidence and severity of the crisis at the macroeconomic level.
During the crisis, the share of trade in GDP was negatively correlated with economic growth, which indicates that more open economies may be more vulnerable. In contrast, net exports were positively correlated with the difference in GDP growth. However, this effect is only weakly significant and turns negative in the second model.
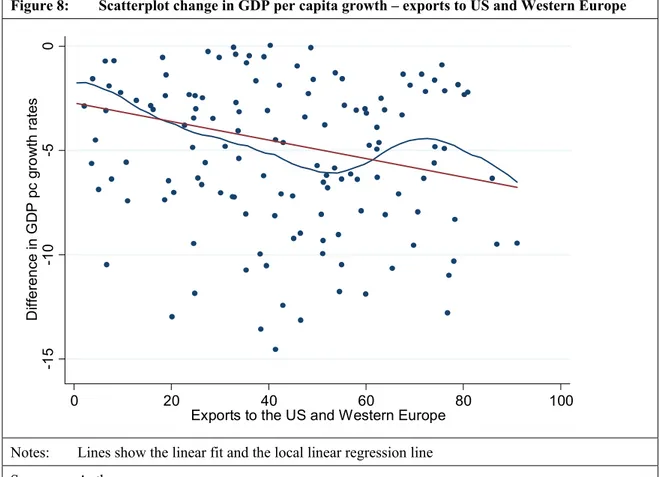
Dependency on the US and Western Europe as export partners (measured by the share of ex- ports to the US and Western Europe in total exports) also seems to have influenced the degree to which an economy was affected by the economic and financial crisis. However, the rela- tionship was not linear, as can be seen in Figure 8, where the lines show the difference be- tween the linear fit as predicted by OLS and a non-parametric fit. The relationship between GDP per capita growth and trade with the US and Western Europe was clearly negative for the lower half of the range and turned positive for countries with a greater share of trade with the US and Western Europe. To better approximate this relation, we included the squared and cubic transformations of this variable in our regression model and found that they, too, are statistically significant. The finding that trade direction is correlated with the dependent vari- able contradicts the results of Rose and Spiegel (2009), who found little evidence that interna- tional financial or real linkages to the crisis epicentre, namely the United States, influenced the macroeconomic impact of the crisis.7
6 Differences in the coefficients can be attributed to the dependent variable used or the countries studied.
While Berkmen et al. and Lane and Milesi-Ferretti analysed only developing and emerging economies, this paper focuses on all the countries. Furthermore, the dependent variable in the model of Berkmen et al. is the amount of growth forecast revisions after the crisis erupted in September 2008.
7 Rose and Spiegel focused on international linkages that could have been responsible for the global spread of the crisis. They used real GDP growth in 2008 combined with changes in stock markets, ex- change rates and country credit ratings as indicators for the incidence of the crisis.
Figure 8: Scatterplot change in GDP per capita growth – exports to US and Western Europe
Notes: Lines show the linear fit and the local linear regression line Source: Author
The sectoral composition of trade does not appear to be correlated with the macroeco- nomic impact of the financial crisis. Lane and Milesi-Ferretti (2010) suggest that countries that rely on exports of durable and investment goods suffered higher export losses during the crisis because these goods are more income elastic. Berkmen et al. (2012) also find that countries that export advanced manufactured goods tended to be harder hit by the cri- sis. This finding is not confirmed by the model applied here: countries with larger shares of manufactured goods in exports were not found to have experienced more severe eco- nomic slowdowns.
International transfers
In contrast to the other channels, little evidence has been found that the transfer channel was significant at the macro-level in the international transmission of the economic and financial crisis. There is no evidence that countries that depend more on private transfers, as measured in the share of remittances in 2007 GDP, experienced lower GDP per capita growth during the crisis than in previous years. There is also no evidence that the share of ODA in income was correlated with the difference in GDP per capita growth during the crisis. This finding is unsurprising, since aid flows did not slow during the crisis. But no positive correlation was found, either.
Because the World Bank increased its lending volumes during the crisis, we also tested whether recipients were less affected by the crisis than non-recipients. But we discovered that lending volumes in 2007 and in 2009, as well as a dummy that took the value one (if lending increased from 2007 to 2009), are not correlated with our dependent variable. This also held for the subsample of low and lower middle income countries (as reported in Sec-
-15-10-50Difference in GDP pc growth rates
0 20 40 60 80 100
Exports to the US and Western Europe
tion 2.3.3). However, the effects of increased World Bank lending may have only been felt after 2009 and could have helped recipient countries recover from the global economic and financial crisis more quickly. This cannot be assessed at this time.
Government intervention
We found some evidence that countries that reacted to the global crisis by adopting countercyclical policies as soon as the crisis erupted were at least partially able to off- set its effects.
Our findings support the hypothesis that countercyclical policies have partly offset the mac- roeconomic effects of the crisis. As can be seen in Table 1, the change in the government spending dummy, which takes the value one if the growth rate of government spending was higher in 2009 than in 2007, is positively correlated with the difference in 2009 GDP per capita growth. Because doubts have been raised about the sustainability of such policies, it would be interesting to see how these countries fared in the years after 2009.
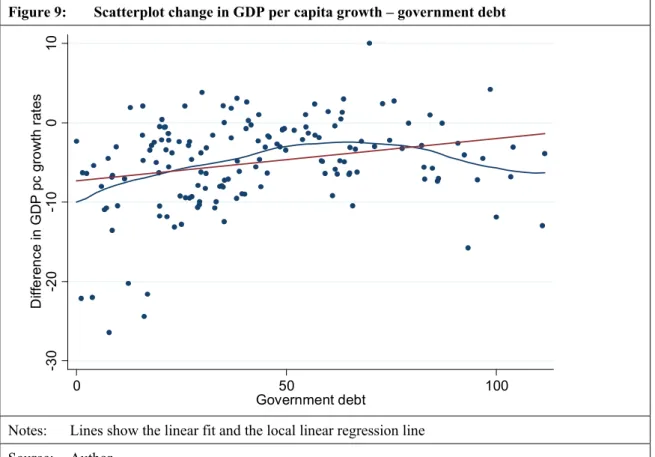
To test the robustness of our finding that countercyclical policies partly offset the effects of the global crisis, we also included variables to represent the ability of governments to react to the crisis: the amount of international reserves relative to GDP and the amount of government debt relative to GDP. Both variables are positively correlated with the dependent variable, which is somewhat surprising since one would expect a negative relationship for government debt. However, a closer view reveals that the relationship between government debt and our dependent variable resembles a negative quadratic function (Figure 9). While government debt and change in GDP per capita growth are positively correlated at lower debt levels, this relation turns negative for debt levels that are higher than about 60% of GDP.
Figure 9: Scatterplot change in GDP per capita growth – government debt
Notes: Lines show the linear fit and the local linear regression line Source: Author
-30-20-10010Difference in GDP pc growth rates
0 50 100
Government debt
The adjustment of exchange rates, in contrast, seems not to have influenced the impact of the economic and financial crisis. No evidence was found that the de jure exchange rate regime or the de facto exchange rate adjustment in 2009 (using the US dollar as the point of reference) influenced the impact of the crisis. This finding contradicts the literature. For example, Berkmen et al. suggested that countries with flexible exchange rates should be better able to handle external shocks (2012). Their findings were supported by Lane and Milesi-Ferretti (2010) – but not by our econometric estimation.
2.3.3 Regression results for low and lower middle income countries
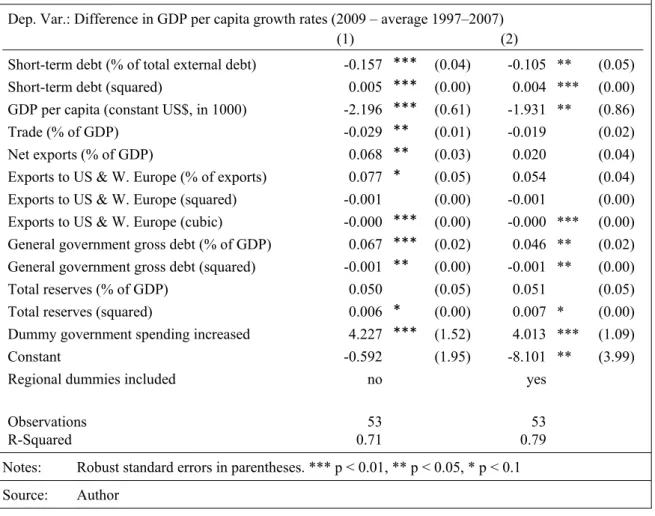
In a second step, we concentrated on the difference between high and upper middle in- come countries on one hand, and low and lower middle income countries on the other – by replicating the regression for the subset of low income and lower middle income coun- tries. The results are reported in Table 2.
Interestingly, the results did not change much when only low and lower middle income countries were considered. Once again, a country’s financial structure and trade depend- ency explain much of the crisis impact. The role of policy response seems to be even more important in low and lower middle income countries.
For the poorer set of countries, the share of short-term debt in total external debt is also strongly and negatively correlated with the crisis impact. But because our financial inte-
Table 2: Regression results for Lower middle income country (LMIC) & Low income country (LIC) Dep. Var.: Difference in GDP per capita growth rates (2009 – average 1997–2007)
(1) (2) Short-term debt (% of total external debt) -0.157 *** (0.04) -0.105 ** (0.05)
Short-term debt (squared) 0.005 *** (0.00) 0.004 *** (0.00)
GDP per capita (constant US$, in 1000) -2.196 *** (0.61) -1.931 ** (0.86)
Trade (% of GDP) -0.029 ** (0.01) -0.019 (0.02)
Net exports (% of GDP) 0.068 ** (0.03) 0.020 (0.04)
Exports to US & W. Europe (% of exports) 0.077 * (0.05) 0.054 (0.04) Exports to US & W. Europe (squared) -0.001 (0.00) -0.001 (0.00) Exports to US & W. Europe (cubic) -0.000 *** (0.00) -0.000 *** (0.00) General government gross debt (% of GDP) 0.067 *** (0.02) 0.046 ** (0.02) General government gross debt (squared) -0.001 ** (0.00) -0.001 ** (0.00)
Total reserves (% of GDP) 0.050 (0.05) 0.051 (0.05)
Total reserves (squared) 0.006 * (0.00) 0.007 * (0.00)
Dummy government spending increased 4.227 *** (1.52) 4.013 *** (1.09)
Constant -0.592 (1.95) -8.101 ** (3.99)
Regional dummies included no yes
Observations 53 53
R-Squared 0.71 0.79
Notes: Robust standard errors in parentheses. *** p < 0.01, ** p < 0.05, * p < 0.1 Source: Author
gration measures were both not statistically significant, they were dropped. Perhaps this is because there is less variance in these variables for poorer countries.
Trade openness is still negatively correlated with the dependent variable, although only as long as regional dummies are not included. Interestingly, a non-linear relationship remains between the share in exports to the US and Western Europe and the difference in 2009 GDP per capita growth relative to the pre-crisis years.
For poorer countries, government intervention seems to be more important than for richer countries. The coefficients of the government spending dummy, as well as those of the government debt and public reserves variables, continue to be statistically significant and become even larger when only low and lower middle income countries are considered.
In the second model, we also included variables that do not influence the total set of coun- tries but might be more relevant for developing countries – such as dependency on remit- tances, aid flows and World Bank loans. These variables are not statistically significant.
We also tested the relevance of export structure for the smaller subset of countries, but did not find any statistical relationship. Therefore, it seems valid to conclude that similar char- acteristics determined the severity of the global crisis in the economies of developing and developed countries.
3 Short-term effects of the economic and financial crisis on households in El Salvador, Tajikistan and Cambodia
In Tajikistan, El Salvador and Cambodia, the crisis affected households mainly through reduced labour income and reduced inflows of remittances, with different effects on for- mal and informal employment. Job losses in the formal sector put additional pressure on the informal sector, and increased informal employment caused general deteriorations in employment conditions and wage reductions in the labour market (UN-DESA 2011; Velde et al. 2009). Disproportional income contractions for entrepreneurs were observed in all three countries. Informal entrepreneurs were also affected, but to different extents in each country. In terms of social characteristics, households with less education were more se- verely affected by the crisis than households with higher education, especially in terms of labour market income. Concurring with existing evidence, we conclude that households of all groups suffered income losses because of the crisis, but that less educated and more vulnerable households seemed to be less able to find alternative employment opportuni- ties.
We also show that there is considerable variation in how labour market effects impact the poor. In countries where the poor mainly live from agricultural production, the poorest deciles fared relatively well, whereas in El Salvador, where labour income contributes as much as 50% to household income in the lowest income decile, the crisis caused real suf- fering among the poor.
The transfer channel seems to have played a very important role at the micro-level.
Households with migrating household members were faced with income reductions in all countries, despite variations in their share of the overall population and the extent to which remittances dropped off. The effect was most pronounced in El Salvador and Tajikistan
and least pronounced in Cambodia. In contrast, reduced social spending noticeably af- fected the poorer populations of Tajikistan, while social spending remained negligible in Cambodia and increased in El Salvador. The poorest households in El Salvador benefited from increased social spending.
These findings are elaborated in the following sections: Section 3.1 describes the meth- odological approach and Sections 3.2, 3.3 and 3.4 discuss the effects of the global eco- nomic and financial crisis on households in El Salvador, Tajikistan and Cambodia, respec- tively. The country sections all follow the same order: first, evidence is provided about the respective transmission channels and each country’s reaction to the crisis. Then microeco- nomic effects are assessed through analysing changes in income by income levels and socio-demographic characteristics. Finally, income changes for the subsample of the poor- est 30% of the population are analysed in greater detail.
3.1 Methodological approach
The micro-level impact of the global economic and financial crisis was assessed by com- paring data from three developing countries that were affected by the crisis, but to differ- ent degrees and through different channels (Figure 10). El Salvador, Tajikistan and Cam- bodia were selected using the following considerations: only low and middle income countries with poverty rates above 2% were considered;8 and just export-dependent coun- tries (where exports account for more than 20% of GDP) were eligible, because we con- sider the trade channel to have been one of the main transmission channels of the crisis.
Only countries with growth corrections (April 2008 projections compared to October 2010 data, IMF 2011), negative GDP or export growth came into question, as well as countries where household surveys had been conducted in 2007 and 2009 – thus permitting analysis
8 Poverty rates are measured as poverty headcount ratio at US$ 1.25 a day (PPP).
Figure 10: Annual real GDP per capita growth (in %)
Source: World Bank (2012) -6
-4 -2 0 2 4 6 8 10 12 14
2000 2001 2002 2003 2004 2005 2006 2007 2008 2009 2010
Cambodia El Salvador Tajikistan
of the impact of the crisis on different population groups shortly before and after the eco- nomic and financial crisis. The following surveys were used: the Encuesta de Hogares de Propósitos Múltiples (EHPM), conducted by the Dirección General de Estadística y Cen- sos in El Salvador; the Living Standards Measurement Survey (LSMS)9 in Tajikistan con- ducted by the World Bank in collaboration with the State Committee on Statistics of Taji- kistan; and the Cambodia Socio-Economic Survey (CSES) conducted by the National In- stitute of Statistics of Cambodia.
The analysis of the micro-level effects was based on the comparison of average incomes in various population groups before and after the crisis. Sample averages for different groups were calculated from nationally representative household surveys, taking into ac- count stratification and clustering, and using the sample weights provided by the statistical organisations responsible for the survey design and data collection. Groups were created by classifying households according to criteria that can be compared before and after the crisis, as well as between countries. The criteria were selected to be as constant as possi- ble, at least in the short term, for example household structure and the head of household’s sex and age group, as well as social characteristics, such as the educational background and employment status of the household’s primary breadwinner. The household’s access to transfers is also considered. Some of these variables are clearly endogenous to struc- tural changes such as an economic crisis, but wherever this is so, we tried to account for potential changes by also taking changes of group sizes into consideration.
Average income was calculated as monthly per capita income and converted into constant international dollars to ensure comparability between countries and over time. The de- pendent variable was calculated so that it can be compared despite differences in the three countries’ economic structures and survey designs. Monthly income per capita was calcu- lated by adding up household income from all sources then dividing that sum by the num- ber of household members. To ensure inter-temporal and cross-national comparability, income was converted to the constant 2005 international dollar in purchasing power pari- ties (PPP).
Our methodological approach suffers from inaccurate price data. Converting income from current local currency units (LCU) to constant 2005 international dollar (PPP) is the best way to make data comparable not just before and after the crisis, but also between coun- tries. However, the 2007 food crisis caused an unprecedented rise in food prices that probably has not been completely captured by the available price data. The lack of good data complicates our research, making it more useful to consider differences between groups rather than study absolute changes. Assuming that income increased for all groups, which groups saw smaller increases, and which saw more? The data at hand allows us to answer such questions.
9 Although the Tajik dataset is a panel dataset, in order to ensure comparability with the other two da- tasets it was treated as repeated cross-sections. Employing the panel structure of the dataset, Kroeger and Meier (2012) find similar results. This suggests that our approach does not exclude any important insights and reduces the risk of measurement error biasing estimates.