doi: 10.3389/fpls.2018.00498
Edited by:
Diwakar Shukla, University of Illinois at Urbana–Champaign, United States
Reviewed by:
James Ames, University of California, Davis, United States John Clark Lagarias, University of California, Davis, United States
*Correspondence:
Chen Song chen.song@uni-leipzig.de Jon Hughes jon.hughes@uni-giessen.de
Specialty section:
This article was submitted to Plant Physiology, a section of the journal Frontiers in Plant Science
Received:
29 January 2018
Accepted:03 April 2018
Published:24 April 2018
Citation:
Song C, Mroginski MA, Lang C, Kopycki J, Gärtner W, Matysik J and Hughes J (2018) 3D Structures of Plant Phytochrome A as Pr and Pfr From Solid-State NMR: Implications for Molecular Function.
Front. Plant Sci. 9:498.
doi: 10.3389/fpls.2018.00498
3D Structures of Plant Phytochrome A as Pr and Pfr From Solid-State
NMR: Implications for Molecular Function
Chen Song
1,2* , Maria Andrea Mroginski
3, Christina Lang
4, Jakub Kopycki
4, Wolfgang Gärtner
1, Jörg Matysik
1and Jon Hughes
4*
1
Institut für Analytische Chemie, Universität Leipzig, Leipzig, Germany,
2Leids Instituut voor Chemisch Onderzoek, Universiteit Leiden, Leiden, Netherlands,
3Institut für Chemie, Technische Universität Berlin, Berlin, Germany,
4Institut für Pflanzenphysiologie, Justus-Liebig-Universität, Giessen, Germany
We present structural information for oat phyA3 in the far-red-light-absorbing (Pfr) signaling state, to our knowledge the first three-dimensional (3D) information for a plant phytochrome as Pfr. Solid-state magic-angle spinning (MAS) NMR was used to detect interatomic contacts in the complete photosensory module [residues 1–595, including the NTE (N-terminal extension), PAS (Per/Arnt/Sim), GAF (cGMP phosphodiesterase/adenylyl cyclase/FhlA) and PHY (phytochrome-specific) domains but with the C-terminal PAS repeat and transmitter-like module deleted] auto-assembled in vitro with 13 C- and 15 N-labeled phycocyanobilin (PCB) chromophore. Thereafter, quantum mechanics/molecular mechanics (QM/MM) enabled us to refine 3D structural models constrained by the NMR data. We provide definitive atomic assignments for all carbon and nitrogen atoms of the chromophore, showing the Pfr chromophore geometry to be periplanar ZZEssa with the D-ring in a β -facial disposition incompatible with many earlier notions regarding photoconversion yet supporting circular dichroism (CD) data. The Y268 side chain is shifted radically relative to published Pfr crystal structures in order to accommodate the β -facial ring D. Our findings support a photoconversion sequence beginning with Pr photoactivation via an anticlockwise D-ring Za → Ea photoflip followed by significant shifts at the coupling of ring A to the protein, a B-ring propionate partner swap from R317 to R287, changes in the C-ring propionate hydrogen-bonding network, breakage of the D272–R552 salt bridge accompanied by sheet-to-helix refolding of the tongue region stabilized by Y326–D272–
S554 hydrogen bonding, and binding of the NTE to the hydrophobic side of ring A.
We discuss phyA photoconversion, including the possible roles of mesoscopic phase transitions and protonation dynamics in the chromophore pocket. We also discuss possible associations between structural changes and translocation and signaling processes within the cell.
Keywords: chromophore–protein interaction, photochromicity, QM/MM, protein refolding, signal transduction
INTRODUCTION
Plant phytochromes mediate the largest environmentally determined developmental changes known in nature, including the induction of germination, de-etiolation and flowering, about 20% of all genes showing major transcriptional regulation by phytochrome. This is achieved by photoconversion of the physiologically inactive Pr state [λ
maxin the red (R) region,
∼ 660 nm] to the Pfr signaling state [ λ
maxin the far-red (FR) region, ∼ 730 nm]. Although both represent singlet electronic ground states (S
0), Pfr slowly reverts to Pr in darkness or can be photoconverted back to Pr by FR light. The situation is complicated significantly, however, by the existence of two functionally dominant phytochromes in plants, namely phyA and phyB, each with very different physiological properties and ecological roles, yet likely undergoing similar photochemical processes. Although plant phytochromes have been studied intensively for many years on account of their importance in natural ecosystems and agriculture, many fundamental aspects are still scarcely understood. As expected, the discovery of Cph1 phytochrome from the cyanobacterium Synechocystis 6803 (Hughes et al., 1997; Yeh et al., 1997) and subsequently BphPs (Davis et al., 1999) provided access to powerful biophysical methods, in particular X-ray crystallography, 3D structures of both Pr and Pfr inter alia providing clues regarding the mechanism of photoactivation and signaling. In particular, it seems that the remarkable tongue-like hairpin refolds radically upon photoconversion, perhaps leading to a shift of the PHY domain and the associated transmitter module (comprising DHp and CAT domains) which functions as a light-repressed HK (Anders et al., 2013; Takala et al., 2014). Although particularly Cph1 has close similarities to plant phytochromes, including the position of the chromophore attachment site in the GAF domain, differences between plant and cyanobacterial phytochromes should be kept in mind. In particular, (i) in Cph1 and other prokaryotic phytochromes Pr is the signaling state, whereas in plant phytochromes it is Pfr, (ii) the transmitter-like module of plant phytochromes resembles but is not a HK, (iii) even though other domains are involved, the light-signal from plant phytochromes arises from the sensory module itself (Matsushita et al., 2003; Qiu et al., 2017), and (iv) plant phytochromes alone include a tandem PAS-domain repeat between the N-terminal sensory and C-terminal transmitter-like modules. Consequently, the extent to which even Cph1 represents a valid model for plant phytochromes is limited. Nevertheless, on the basis of the
Abbreviations: BphP, bacteriophytochrome; CAT, catalytic ATPase; CBCR, cyanobacteriochrome; CD, circular dichroism; CP, cross polarization;
Cph1, cyanobacterial phytochrome 1; Cph2, cyanobacterial phytochrome 2;
DARR, dipolar-assisted rotary resonance; DHp, dimerization and histidine phosphoacceptor; DNP, dynamic nuclear polarization; DrBphP, Deinococcus radiodurans BphP; GAF, cGMP phosphodiesterase/adenylyl cyclase/FhlA;
HDX-MS, hydrogen-deuterium exchange coupled to mass spectrometry; HK, histidine kinase; MAS, magic-angle spinning; MELODI–HETCOR, medium- and long-distance heteronuclear correlation; NTE, N-terminal extension; PaBphP, Pseudomonas aeruginosa BphP; PAS, Per/Arnt/Sim; PCB, phycocyanobilin; Pfr, far-red-light-absorbing state; PHY, phytochrome-specific; phyA, phytochrome A; PIF3, phytochrome-interacting factor 3; Pr, red-light-absorbing state; P8B, phytochromobilin; QM/MM, quantum mechanics/molecular mechanics; SIDY, selective interface detection spectroscopy; XcBphP, Xanthomonas campestris BphP.
Cph1 structure (PDB code 2VEA; Essen et al., 2008) the first crystal structure of a plant phytochrome fragment was recently solved (PDB code 4OUR; Burgie et al., 2014a), although at 3.4-Å resolution several important details are unclear, including the geometry of the bilin chromophore.
The present paper focuses on oat (Avena sativa) phyA, the material on which most of the pioneering phytochrome work was focused. Indeed, it was the first phytochrome to be purified intact (Vierstra and Quail, 1982) and spectrally functional (Litts et al., 1983; Vierstra and Quail, 1983), cloned (Hershey et al., 1984), sequenced (Hershey et al., 1985), and overexpressed in transgenic plants (Boylan and Quail, 1989; Keller et al., 1989). Moreover, type-A phytochromes confer the exquisite light sensitivity unique to higher plants and might thereby have been a crucial factor in their evolutionary success by providing improved physiological regulation of germination and de-etiolation. It is therefore of interest to understand its particular molecular characteristics and action mechanism.
Although spectroscopic methods do not rival crystallography in solving 3D structures of complete proteins, MAS NMR continues to gain in value for protein structural studies, as it unveils outstandingly precise molecular details without the need to crystalize the protein. MAS NMR has contributed to phytochrome research, Cph1 auto-assembled with u-[
13C,
15N]- PCB providing information on the little-known Pfr → Pr back- conversion route, confirming that the chromophore is fully protonated in both Pr and Pfr, and revealing the existence of at least two Pr sub-states, only one of which is represented by the crystal structure (Rohmer et al., 2008, 2010; Song et al., 2011a,b;
Stöppler et al., 2016). We also showed that Pr is intrinsically less rigid than Pfr, implying a mesoscopic phase transition associated with photoconversion (Song et al., 2011a). Furthermore, our MAS NMR work on the oat phyA3 sensory module in the Pr state also provided the first structural information of any kind for a plant phytochrome, and revealed that here too Pr exists in at least two sub-states (Song et al., 2012). In this study we extend that work, presenting complete and unambiguous
13C and
15N chemical shift assignments for the chromophore and also tentative
1H assignments for the surrounding protein in both Pr and Pfr states. The latter was achieved with the help of 3D homology models optimized by NMR-restrained QM/MM calculations in which 198 atoms of the chromophore and its immediate environment were treated quantum mechanically.
The Pr and Pfr models (deposited in Supplementary Data Sheet S1) provide insight into the photoconversion process.
RESULTS
Chemical Shift Assignments of the Chromophore in Its Pfr State
Complete and unambiguous
13C and
15N assignments of the u-[
13C,
15N]-PCB chromophore as Pfr were derived from a series of 2D homo- and heteronuclear correlation experiments as for Pr (Song et al., 2012; see also Supplementary Results).
13
C–
13C dipolar correlation (DARR) experiments allowed the
detection of direct and indirect
13C–
13C correlations of the
PCB chromophore within its binding pocket (Figure 1 and Supplementary Figure S1). C4, C6, C18
1and C18
2, previously unresolved for Pr (Rohmer et al., 2008), were assigned unambiguously, whereby assignment of the bilin carbon atoms in the Pfr state was completed (Supplementary Table S1).
Neither the propionate side chains nor the A-ring carbons showed the signal splitting observed in Pr (Song et al., 2012). The C11
...C12
2...C13
1...C17
...C18
2correlation network was well resolved in Pfr (Supplementary Figure S1), the 3.7–3.8 Å internuclear distances according to the QM/MM model corresponding to the maximum effective detection range using a 50 ms mixing time with our current sensitivity.
Dipolar-filtered
1H–
13C heteronuclear correlation (MELODI–HETCOR) then allowed
1H intramolecular contacts between the chromophore carbons and the retained NH (H
N21−N24) and OH protons to be established, the spectrum with a cut-off distance of ∼ 2.8 Å (Figure 2A, red) revealing four clear pyrrolic
1H resonances. The NH proton resonating at 9.0 ppm was assigned to H
N24via its contacts with C19 (169.5 ppm), C16 (150.3 ppm), and C18 (140.7 ppm) at ring D. These carbons showed no contacts to other NH protons even with a ∼ 3.5 Å cut-off distance (Figure 2A, purple; Supplementary Table S2). The NH proton at 11.8 ppm showed correlations to C1 and C4 of ring A as well as C5 and hence was assigned to the H
N21(Figure 2A, red). The integrated intensity ratio of the H
N21contacts to C1 and C4 is ∼ 45:55, implying that the two A-ring carbons are roughly equidistant from this proton
FIGURE 1 |
2D
13C–
13C DARR spectra of the oat phyA3 u-[
13C,
15N]-PCB chromophore as Pfr with
1H mixing times of 5 (red) and 50 (purple) ms. The cross-peaks assigned to the directly bonded chromophore carbons are marked
×in black and numbered (for PCB chromophore numbering, see
Figure 3). Corresponding off-diagonal counterparts are marked×in green.
The cross-peaks that are not fully resolved using the mixing time of 5 ms are indicated by dashes. See also Supplementary Figure S1.
(van Rossum et al., 2002), supporting the assignment. Although the
1H signals corresponding to the nitrogens of rings B and C correlate with both C9 and C11, their different intensities allowed the assignment of H
N22and H
N2311.3 and 10.3 ppm, respectively (in Pr the two protons were indistinguishable at 10.7 ppm; Supplementary Table S2). The assignment of all four NH protons is thereby complete. State-related δ
Hchanges ( 1δ
H) were seen: − 0.3, + 0.6, − 0.4 and + 0.8 ppm as Pfr minus Pr for H
N21to H
N24, respectively. The lack of correlations involving OH protons of the propionic side chains of rings B and C in the two MELODI–HETCOR spectra implies that both are deprotonated, as in earlier studies (Bhoo et al., 1997; Essen et al., 2008; Yang et al., 2008; Song et al., 2011b).
From the
1H data,
1H–
15N HETCOR (Figure 2B) allowed us to assign the nitrogens themselves straightforwardly, with N21–
N24 located at 159.0, 140.7, 157.3, and 136.9 ppm, respectively (Supplementary Table S1). The experimental δ
Nvalues were closely matched by those computed using a QM/MM approach (δ
N21−N24= 165.3, 140.7, 154.1, and 138.0 ppm, respectively; see Supplementary Table S3). It should also be noted that the recent
15
N DNP enhanced MAS NMR characterization of the Pr state in Cph1 finalized the assignment of the Pr resonances (Stöppler et al., 2016), in which the previous tentative assignments of N22 and N23 (Rohmer et al., 2008) were interchanged. This thus forms a solid basis on calculating the state-induced δ
Nchanges of the chromophore in oat phyA3 (see below).
Changes in Chromophore 13 C and 15 N Chemical Shifts and Line-Widths in Pr and Pfr
The δ
Cand δ
Nchanges ( 1δ ) of the chromophore associated with photoconversion (Figure 3A, Supplementary Table S1) indicate that the C- and D-ring regions are predominantly affected. In particular, the C13, C16–C18 and N24 signals shift dramatically relative to Pr, together with the C13
1...C17 DARR contact – seen only in Pfr – providing clear evidence for a D-ring photoflip. 1δ
Cof the C-ring propionate carbons reflect structural rearrangements of the binding pocket during photoconversion.
Further details of these changes are provided by the interfacial
1H contacts of the chromophore atoms (see Discussion). Whereas in the A–B ring region most carbon atoms show only small changes upon photoconversion, larger 1δ
Cvalues are seen for the A-ring linkage to the protein at C3, C3
1, and C3
2. State-related δ
Cchanges in the conjugated π -system of the chromophore are also apparent (Figure 3A).
Our earlier studies revealed that the Pr state is structurally heterogeneous in both oat phyA3 and Cph1, several carbons in/around the A-ring region, the C-ring propionate and several protein residues nearby showing at least two conformations associated with different hydrogen bonding networks (Song et al., 2013). Heterogeneity in Pfr has also been described on the basis of resonance Raman and ultra-fast absorbance spectroscopy (Kim et al., 2014; Velázquez Escobar et al., 2015; Stensitzki et al., 2017).
In the present work, the N22 peak at ∼ 141 ppm in the 1D
15N
spectrum (Figure 2B) is asymmetrical and significantly broader
than the other three, deconvolution revealing components at
FIGURE 2 |
2D
1H–
13C MELODI–HETCOR and
1H–
15N HETCOR spectra of the oat phyA3 u-[
13C,
15N]-PCB chromophore as Pfr.
(A)The MELODI–HETCOR spectrum acquired with an LG–CP contact time of 500
µs (red) reveals mostly intramolecular1H contacts of the chromophore carbons (for example,
1
H
N21−N24–
13C
PCB, marked
×in black). Heteronuclear signals obtained with a mixing period of 900
µs (purple) fall into two categories: (i) Intramolecular
1
H
N21−N24–
13C
PCBcorrelations (marked
×in black and green for fully and less resolved signals, respectively), and (ii) interfacial correlations between the
chromophore and protein residues in its vicinity (shaded in gray). Intramolecular
1H
N21−N24–
13C
PCBcorrelations are summarized in Supplementary Table S2.
(B)The
1
H–
15N HETCOR spectrum was acquired for tracing direct
1H–
15N connectivities. For all three correlation spectra, only the characteristic spectral region of
δH= 8–13 ppm (ω
1-dimension) is shown.
δHand
δC/(δ
N) values are indicated by the horizontal and vertical lines, respectively. The 1D
13C and
15N MAS spectra of the same protein as Pfr are shown with assignments as the external projections along the
ω2-dimension above the spectra in
(A,B), respectively. Resonancesmarked with an asterisk indicate glycerol carbons and amide nitrogens of protein backbone originating from
1 3C and
15N in natural abundance.
140.7 and 142.1 ppm with an intensity ratio ∼ 0.7:0.3 (Figure 2B), perhaps implying heterogeneity at this point. Moreover, the
15
N line-shapes become more Gaussian and less Lorentzian at
− 40
◦C relative to those obtained from the spectra recorded at temperatures just below the freezing point of the sample solution (e.g., < − 17
◦C), indicating an increased distribution of chemical shifts at lower temperatures. On the other hand, Pfr heterogeneity was apparent in neither the DARR spectra (Figure 1) nor interfacial
1H contacts of the Pfr chromophore (see below). Indeed, the line-widths of the
13C and
15N signals of the chromophore are distinctly narrower in Pfr than in Pr (Figure 3B, Supplementary Table S4). Pfr line narrowing is most dramatic for the A-ring linkage to the protein at C3, C3
1and C3
2. The C8
1, C12
2, C17
1and C18
1peripheral carbons of rings B–D also narrow. The observed
13C and
15N line-narrowing in the Pfr chromophore does not result from an increase in spin-spin relaxation time (Siemer et al., 2012) but rather from a general decrease in structural heterogeneity of the surrounding protein relative to Pr.
Interfacial 1 H Contacts of the Chromophore in Its Pfr State
As for Pr (Song et al., 2012),
1H
residue–
13C
PCBcontacts of oat phyA3 in Pfr were identified using MELODI–HETCOR and its variant SIDY with the help of QM/MM calculations (see Supplementary Materials and Methods). For instance, the side chain of conserved H323 (oat phyA3 numbering used throughout the article, otherwise noted) showed contacts to the pyrrolic
carbons of rings B and C as well as their propionates in Pr, the corresponding
1H shifts nicely distinguishing cationic and neutral τ tautomers of the imidazole in the two Pr isoforms (Song et al., 2012). However, the Pfr spectra imply that the side chain is neutral (Supplementary Figures S2, S3 and Supplementary Tables S5–S9). We thus conclude that H323 exists in the N ε 2- protonated τ tautomeric form in the Pfr state, well supported by both our earlier MAS NMR studies (Song et al., 2011b) and a recent investigation combining pH-dependent resonance Raman spectroscopy and QM/MM calculations (Velázquez Escobar et al., 2017a) on Cph1. Moreover, our starting Pfr QM/MM model was based on the BphP PaBphP Pfr structure (PDB code 3C2W), consequently with ring D on the α -face (D- α
f) relative to rings B and C (Yang et al., 2008). Such a D- α
fdisposition proved inconsistent with many
1H contacts of the chromophore resolved in the two correlation spectra, in particular for D-ring methyl groups like C17
1and C18
2. A β -facial ring D (D- β
f) allowed most of its
1H contacts to be assigned straightforwardly (Supplementary Table S9). The final models for Pfr and Pr are presented as PDB files in the Supplementary Data Sheet S1. The assignments have been deposited as BMRB acquisition 27434.
Conformational Changes in Residues Surrounding the Chromophore
Unlike Pr, only local Pfr conformational heterogeneity was detected in the chromophore (N22 in ring B) and none within
∼ 6.0 Å of its immediate protein environment, indicating that
the pocket is much more rigid in Pfr. The NTE too is likely to
FIGURE 3 |
Chemical shift and FWHM line-width (
ν1/2) changes of chromophore
13C and
15N resonances associated with Pr→Pfr photoconversion in oat phyA3.
(A)
The
13C,
15N (N21–N24), and
1H (H
N21−N24) chemical shifts of the chromophore in Pfr are labeled (black numbers) and their corresponding changes associated with photoconversion represented as red and blue circles (for down- and up-field shifted as Pfr, respectively; Supplementary Tables S1, S2).
(B)The
ν1/2values of the Pfr resonances are labeled in black numbers. Pr-to-Pfr
ν1/2changes of the chromophore resonances are represented as red and blue circles (for broader and narrower resonances as Pfr, respectively; Supplementary Table S4). Atoms showing signal doublings are labeled with two circles.
be less mobile in Pfr, as a single
1H contact with C2 of ring A was seen in Pr, yet 15 SIDY contacts (mainly with the ethylidene and methyl substituents of ring A and C5) were apparent in Pfr (Supplementary Table S7). Whereas in Pr, MELODI–
HETCOR (Supplementary Figure S2) and SIDY (Supplementary Figure S3) detected several correlations connecting P540, S541 and M549–R552 of the tongue to A-ring carbons, of these only M549 was detected in Pfr, albeit via different carbon atoms (Supplementary Table S9). Indeed, from the available crystal structures as well as our QM/MM model for Pfr, the other tongue residues would be too distant to interact with the chromophore.
Besides M549, in Pfr the D-ring carbons contacted S554 from the conserved PRXSF
551−555motif (Figures 4A,B). R548, another tongue residue seen by SIDY only in Pfr, showed two contacts to ring A at C2 and C2
1(Supplementary Table S8). The Pfr-state QM/MM model corroborated this a priori, whereas in Pr R548 would be much too distant to be detected.
Interfacial
1H contacts of the chromophore in Pr and Pfr are given in Supplementary Table S9, amino acids with at least one
1
H contact in either Pr or Pfr are shown in Figure 5. Prominent changes were detected for R317 (at H η 1 and H η 2) and Y326 (Hη). The B-ring propionate likely forms a salt bridge with R317 in Pr, but the 1δ
Hvalues of ∼ 1.5 ppm associated with photoconversion and the contacts between the B-ring propionate and R287 seen only in Pfr indicate a light-driven partner swap associated with a shift of the two inner rings, also implied by changes in
1H contacts to I273 and P274 (Supplementary Table S9).
Contacts between ring D and Y241, Y268 and Y326 which form a hydrophobic subpocket around it (Figure 5) are radically different in Pr and Pfr (Supplementary Table S9), indicating dramatic structural rearrangement of their phenolic side chains.
C17
1and C18
1interact with different sides of the Y241 ring in Pr and Pfr. Indeed, our QM/MM models suggest a t,g
+rotamer ( χ
1= 191
◦, χ
2= 61
◦) for this tyrosine in Pr and a g
−,t rotamer ( χ
1= 304
◦, χ
2= 333
◦) in Pfr (see Supplementary Materials and Methods for rotamer definitions), associated with a reduction of
∼ 1.5 Å in the (χ
1,χ
2)-dependent Cε2–Nα internuclear distance.
Similarly, large changes were observed for Y268: in Pr its phenolic ring is close to C17
1, C18
1and C18
2of the ring D, whereas in Pfr only a single
1H contact to C18 was apparent (Supplementary Table S9). The hydroxyl of Y326 on the opposite bilin α -face correlated with C15 and C16 (Figure 4C, Supplementary Figure S4, and Supplementary Table S9). Although the global δ
Hchanges of the Y326 ring and a + 1.7 ppm 1δ
Hfor H η might be interpreted as hydrogen bonding to N24 in Pfr, the associated contact to C19 is clearly absent (Supplementary Figure S4 and Supplementary Table S9). Indeed, with a likely D- β
fsuch an interaction would be impossible (see Discussion). Further prominent δ
Hchanges associated with photoconversion were detected for the imidazole rings of H372 and the neighboring H323 ( 1δ
Hfor H ε 2 of − 1.4 and − 1.2 ppm for H372 and H323, respectively; Supplementary Table S9).
DISCUSSION
13
C–
13C DARR and
1H–
13C/
15N HETCORs provided insight
into the structure/functional relationships in both the inactive
Pr and signaling Pfr states of the chromophore and
1H
neighbors up to ∼ 6 Å distant in oat phyA3. With the help of
QM/MM-based models and complete
13C and
15N assignments
of all 37 PCB carbon and nitrogen atoms (Figure 3A and
Supplementary Table S1), we tentatively identified many specific
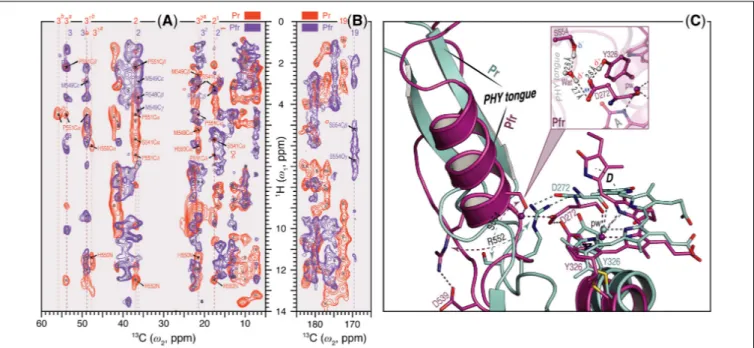
FIGURE 4 |
Sheet-to-helix refolding in the tongue region associated with Pr→Pfr photoconversion in oat phyA3.
(A)The 2D SIDY data in both states (Pr, red and Pfr, purple) were collected with a
1H spin diffusion mixing time of 800
µs and CP contact time of 96µs. The spectral region 5–60 ppm in theω2-dimension and 0–14 ppm in the
ω1-dimension is shown for the
A-ring1H contacts with the tongue residues (see also Supplementary Figures S3, S5).
(B)The 2D MELODI–HETCOR data were acquired with an LG–CP contact time of 2.3 ms. The spectral region 165–185 ppm in the
ω2-dimension and 0–14 ppm in the
ω1-dimension is shown for
D-ring C191H contacts with the tongue residues (see also Supplementary Figures S2, S4).
13C resonances of the
A-ring carbons(A)and C19
(B)are indicated by vertical lines and their
1H contacts of the tongue residues are labeled in red and purple as Pr and Pfr, respectively. Non-
1H
tongue–
13C
A/D-ringcorrelations resolved in the spectra are marked
×in gray.
(C)QM/MM-optimized structure models of oat phyA3 in the Pr (gray) and Pfr (purple) states show a sheet-to-helix refolding in the tongue region as confirmed in the SIDY
(A)and MELODI–HETCOR
(B)spectra. For example, the Pr-state
β-sheet (gray) forms a R552/D272 salt-bridgehydrogen-bonded to the chromophore, whereas in the Pfr-state
α-helix (purple) S554 acts as a hydrogen-bond donor via a water molecule to D272 of the GAF domain which in turn interacts with the hydroxyl group of Y326 (see inset). R552 and S554 form part of the conserved PRXSF motif of the PHY tongue.
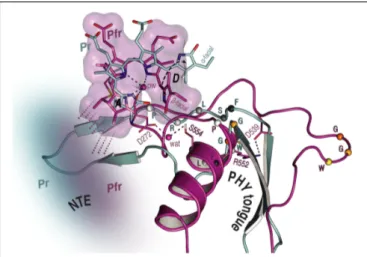
FIGURE 5 |
Interfacial
1H contacts of the PCB carbon atoms in oat phyA3 as Pr and Pfr. Structural views show the chromophore and its
1H residue contacts observed with MELODI–HETCOR and SIDY experiments for
(A)Pr and
(B)Pfr (all resolved
1H–
13C contacts summarized in Supplementary Table S9). For both states, the 3D visualizations use the oat phyA3–PCB models optimized by QM/MM. Amino acids with at least one observable
1H contact in both states are shown as yellow sticks. The light-driven
δHchanges are represented as red and blue spheres representing down- and upfield shifts, respectively. Amino acids resolved only in Pr or Pfr are colored green-cyan. The NTE region is shown in blue-gray and its possible interfacial contacts with the chromophore are shown as yellow dashes.
Potential hydrogen-bonding interactions are shown as black dashes. Water molecules are shown as green spheres.
chromophore–protein contacts (
1H
residue–
13C
PCB) in both Pr and Pfr (Supplementary Figures S2–S5 and Supplementary Table S9; Song et al., 2012). Although these data alone are still far from providing complete 3D structural solutions, our work provides novel insight into the characteristics of A-type plant phytochromes in both parent states, as well as the underlying photoconversion mechanisms.
Chromophore
The present work relies on generating holophytochrome in which the chromophore but not the apoprotein is isotopically labeled, exploiting the in vitro assembly reaction typical of the phytochrome family. We caution that, at least in the case of Cph1, small but perhaps functionally significant differences exist between material produced in vitro and in vivo, perhaps as a result of cotranslational assembly and thus different cooperative folding. In the case of phyA3 from oat there seems to be no functional difference between the holoproteins extracted from plants and apoprotein assembled in vitro (Schmidt et al., 1998).
All the chromophore carbon and nitrogen atoms in both states are now assigned definitively (Figures 1–3A and Supplementary Table S1), the DARR correlations showing the chromophore to be periplanar ZZZssa and ZZEssa in Pr and Pfr, respectively.
For example, H
N24correlated with the ring C at C13, C13
1, and C14 in Pr but not Pfr (Supplementary Table S1), whereas a DARR correlation connecting C13
1of ring C and C17 of ring D is only seen in Pfr (Supplementary Figure S1). Furthermore, the interfacial correlation data show ring D to be α - and β -facial in Pr and Pfr, respectively, geometries corresponding to those for Cph1, whereas in bacteriophytochromes both states are α -facial. This difference was implied by CD spectroscopy (Rockwell et al., 2009). In that study it was suggested that the direction of isomerization in plant phytochromes and Cph1 is anticlockwise, the slump arising from steric hindrance of the ring D by the C-ring methyl side chain leading to rotation around the C14–C15 single bond, whereas in bacteriophytochromes the likely direction of isomerization would be clockwise leaving the D-ring at the α face. A D- β
fPfr would require radical changes in the cavity accommodating ring D relative to the situation in BphP Pfr.
Indeed, the present study reveals exactly such changes (see below).
Although most intramolecular
1H contacts (
1H
N21−N24) of the A-ring carbons are unaffected by photoconversion (Supplementary Table S2), H
N21of ring A exhibited a weak but clearly resolved contact with C9 of ring B in the
1H–
13C MELODI–HETCOR spectrum solely in Pfr (Figure 2A, purple;
Song et al., 2012), implying a modified distortion at the A–B methine bridge in response to local protein structural changes during photoconversion. Such changes were probably the origin of the confusion that the ring A photoisomerizes (see Song et al., 2014).
The 1δ
Cpattern shown in Figure 3A indicates electronic rearrangement in the chromophore π -system associated with photoconversion. In Pfr, whereas the 1δ
Cvalues alternate for the conjugated chains of rings A–B and ring D, all four
13C signals of the ring C are uniformly shifted upfield relative to Pr, indicating
a local electron density increase in Pfr. This might be a general event in the phytochrome family, as nearly identical effects were also seen in Cph1 (Supplementary Figure S6). The interruption of the alternating pattern at ring C is also seen in the phytochrome- related CBCRs fragments such as AnPixJg2 (Song et al., 2015) and NpR6102g4 (Rockwell et al., 2015) during their red/green photocycles (Supplementary Figure S6). State-related δ
Cchanges in the π-conjugated C4–C19 systems in oat phyA3 and Cph1 are generally similar (Supplementary Figure S7), particularly so for carbons associated with the A–B and B–C methine bridges as well as C17 of the ring D, implying similar electronic changes.
The smaller 1δ
Cvalues for C14 and C16 in oat phyA3 relative to Cph1 might arise from the larger tilt angle between rings C and D (the angle between the normal vectors) in plant phytochromes.
Our Pr model for oat phyA3 predicts 57
◦, whereas 46
◦was predicted for Arabidopsis phyA (Mroginski et al., 2011). The Cph1 crystal structure indicates a shallower angle of 27
◦(Essen et al., 2008), whereas that for Arabidopsis phyB implies ∼ 60
◦(Burgie et al., 2014a). A D-ring twist greater than ∼ 40
◦would significantly reduce conjugation with the rest of the π -electron system, leading to δ
Cchanges localized to the C–D methine bridge and ring D. The differences observed at C13 and C18 in the present study also support such an effect (Supplementary Figures S6, S7).
Although changes in the extent of conjugated π -electron systems lead to shifts in the absorbance λ
max, it is by no means clear how or even if the R/FR photochromicity characteristic of canonical phytochromes derives from this. The conjugated system would have to be longer in Pfr than Pr to induce the bathochromic absorbance shift: yet, on the contrary, following denaturation Pfr is hypsochromically shifted relative to Pr (Zhao and Scheer, 1995; Ishizuka et al., 2007; Hirose et al., 2008;
Song et al., 2014). Interaction with the protein pocket is thus fundamentally significant, but the actual effect is unknown.
Progress here will probably require an adequate understanding of the border orbitals of both Pr and Pfr.
Our
1H and
15N Pfr data of the pyrrole NH groups (Figure 2) give clear evidence that a protonated cationic bilin ring system is present in both Pr and Pfr, paralleling conclusions from earlier work on prokaryotic phytochromes (Hahn et al., 2008; Rockwell and Lagarias, 2010). State-induced δ
Hchanges seen at the two NH protons associated with rings B and C (Figure 3A) reflect changes in the pocket, in particular for the highly conserved D272 and H323 as well as the pyrrole water, all of which are within hydrogen-bonding distance (Figure 5). Indeed, the δ
Nvalues calculated quantum-mechanically for the chromophore nitrogens in the Pfr state agree well with those measured experimentally (Supplementary Table S3). Moreover, the
15N Pfr spectra of oat phyA3 and Cph1 are remarkably similar (Supplementary Figure S8), all four maxima deviating by less than 1.5 ppm and the N22 signal showing a similar splitting. The Pr → Pfr 1δ
Npatterns are similar too (Supplementary Figure S6).
This resemblance suggests that the hydrogen bonds connecting
the four pyrrole nitrogens are very similar. Interestingly, N22 of
ring B in oat phyA3 and Cph1 in both states resonates at least
13-ppm upfield of N23 of ring C (Supplementary Table S1). We
have proposed that the distinct δ
Ndifference between these inner
ring nitrogens arises from the asymmetry of the strong hydrogen- bonding interactions with the nearby carbonyl backbone of D272 (D207 in Cph1) and the pyrrole water (Rohmer et al., 2010).
Recent DNP-enhanced MAS NMR studies on Cph1 in Pr have suggested that the positive charge carried by the tetrapyrrole system is mainly localized at ring B and thus would account for a downfield shift of N22 relative to that of N23 (Stöppler et al., 2016).
Bilin–Protein Linkage
Subtle but significant state-related changes were detected at the A-ring ethylidene linkage to the protein (Supplementary Table S1). Similar 1δ
Cvalues at these carbons are also seen in Cph1 (Supplementary Figure S6) and a non-canonical Group II phytochrome SyB.Cph2(GAF) fragment (Ulijasz et al., 2010). Moreover, in the case of the red/green CBCR NpR6102g4, much more dramatic shifts of the ethylidene carbons of ring A and on the three methine bridges were found (Rockwell et al., 2015; Supplementary Figure S6), implying a stronger mechanical distortion of the bilin chromophore upon photoproduct formation. The pattern of
13C line-width changes at the linkage is also similar to that in Cph1 (Supplementary Figure S9). Changes in interactions with the protein in this region probably result from restructuring of the binding pocket deriving from the D-ring movement rather than from autonomous movements of the chromophore. Whereas significant changes in δ
Cand line-widths at the A-ring linkage to the protein imply that covalent attachment is functionally important, biochemical evidence contradicts this: mutation or chemical blocking of the Cys attachment site prevents covalent attachment, yet the chromophore is still bound and photochromicity seen, the observed bathochromic shifts in λ
maxbeing consistent with the more extensive conjugated π -system of the unattached chromophore (Jorissen et al., 2002; Lamparter et al., 2002).
Signaling in plant phyB requires the chromophore, but not covalent attachment (Oka et al., 2011).
N-Terminal Extension
Unfortunately, beyond secondary structure predictions, there exist no structural data for the NTE of any plant phytochrome.
Indeed, even in the case of prokaryotic phytochromes, the structure of the (much smaller) NTE seems to be influenced critically by subtle interactions with the tip of the tongue-like hairpin extending from the PHY domain. For example, the PAS–GAF and PHY domains in wild-type (2VEA) and Y263F mutant (3ZQ5) crystal structures of the Cph1 Pr sensory module (Essen et al., 2008; Mailliet et al., 2011) are almost identical except at that point. The fact that deletion of the NTE in plant phytochromes leads to a hypsochromic shift of the Pfr absorption maximum and accelerated dark reversion implies, however, that its interactions with the sensory module are functionally important. Indeed, for example Jordan et al. (1995, 1997) found that, whereas alanine substitutions in the serine-rich 2–18 region lead to enhanced physiological sensitivity to light, modifications to the downstream region lead to hypsochromic shifts particularly of Pfr and accelerated Pfr → Pr dark reversion.
The current study provides insight into the behavior of the NTE
at the molecular level. Whereas our SIDY experiments revealed only one
1H NTE contact in Pr, no less than 15 interactions were detected in Pfr. Although we are not yet able to assign these contacts with certainty, we consider that they involve I67 in Pr and predominantly Y69 in Pfr (Supplementary Figures S3, S5 and Supplementary Table S8). Similarly, in MELODI–HETCOR we observed 16 contacts likely to involve the NTE in Pfr but none in Pr (Supplementary Figures S2, S4 and Supplementary Table S6). The much more extensive interaction between the NTE and the chromophore in Pfr than in Pr derives from hydrogen bonds from the hydrophobic side of ring A (Figures 5, 6).
The Pfr peaks are also narrower than those in Pr (Figure 3B), consistent with reduced mobility. The state-dependent changes in dynamics of the NTE based on HDX-MS data for Arabidopsis phyB (von Horsten et al., 2016) showed two points in the NTE with more rapid H/D exchange in Pfr than in Pr, implying increased mobility or accessibility in Pfr. It is important to note, however, that the phyA and phyB sub-families have very different physiological roles in plants and that the NTE in phyB is always much larger and shows no sequence similarity to that of phyA.
Tongue
We observed a number of Pr correlations connecting the chromophore to five residues of the tongue-like extension of the PHY domain in the MELODI–HETCOR spectrum (Supplementary Table S6), implying that the tongue is bound strongly to the rest of the protein. R552 from the conserved PRXSF
551−555tongue motif is also seen to contact ring A in the SIDY spectrum, commensurate with a salt bridge to D272 (Figure 4A). In the corresponding Pfr spectra, however, only R548, M549 and S554 were detected (Figure 4A and Supplementary Table S9), implying that the S554 side chain points away from the chromophore in Pr but is rotated inward to
FIGURE 6 |
![FIGURE 1 | 2D 13 C– 13 C DARR spectra of the oat phyA3 u-[ 13 C, 15 N]-PCB chromophore as Pfr with 1 H mixing times of 5 (red) and 50 (purple) ms](https://thumb-eu.123doks.com/thumbv2/1library_info/2809145.72375/3.892.67.436.594.940/figure-darr-spectra-phya-chromophore-mixing-times-purple.webp)
![FIGURE 2 | 2D 1 H– 13 C MELODI–HETCOR and 1 H– 15 N HETCOR spectra of the oat phyA3 u-[ 13 C, 15 N]-PCB chromophore as Pfr](https://thumb-eu.123doks.com/thumbv2/1library_info/2809145.72375/4.892.84.824.91.400/figure-melodi-hetcor-hetcor-spectra-phya-pcb-chromophore.webp)