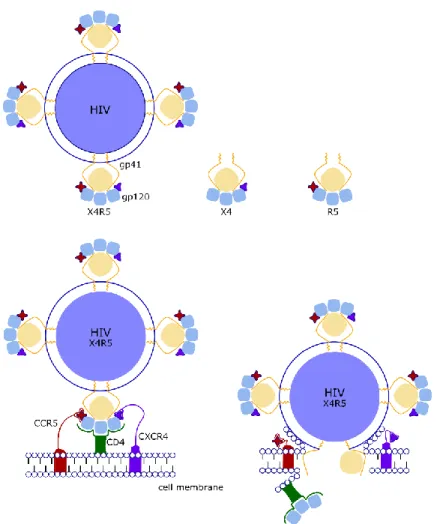
IN VITRO DIFFERENTIATION OF GENOME ENGINEERED STEM CELLS FOR A NOVEL HIV THERAPY
83
0
0
Volltext
(2)(3)
(4)
(5)
(6)
(7)
(8)
(9)
(10)
(11)
(12)
(13)
(14)
(15)
(16)
(17)
(18)
(19)
(20)
(21)
(22)
(23)
(24)
(25)
(26)
(27)
(28)
(29)
(30)
(31)
(32)
(33)
(34)
(35)
(36)
(37)
(38)
(39)
(40)
(41)
Abbildung

+7


ÄHNLICHE DOKUMENTE
Microhardness testing showed a lower dentine hardness value in GF incisors compared to SPF, while HE staining showed that GF incisors exhibited thicker predentine than SPF
Despite evident advances in in vitro expansion methods, application of tumour infiltrating lymphocytes, incorporation of professional antigen presenting cells,
As for CD1b and CD1c molecules, T cell recognition can also be altered via impairment of CD1d lysosomal trafficking, preventing binding of its dedicated lipid
In the chronic phase, it is unlikely that HIV is directly responsible for CD4+ T cell death, since the degree of productive infection in peripheral blood and tissues is very
The cells were incubated with mTHPC loaded liposomes, THP loaded PLGA nanoparticles, LCNP and free mTHPC/ free THP (dissolved in 0.1% DMSO) for 4 h at an equitoxic dose..
To compare the endodermal and hepatic differentiation capabilities of these various pluripotent stem cells, we first applied the protocol published by Kania and col- leagues (Kania
Enrichment of OCT4, SOX2, and NANOG within various classes of dynamic genomic regions that change upon differentiation of hESC. Values are
H3K4me1 regions enriched for OCT4 binding sites frequently become HMRs in all three differentiated cell types, whereas NANOG and SOX2 sites are more prone to change to an HMR
