I
The Effect of Natural Variation at Ppd-H1 and HvELF3 on Responses to Osmotic Stress in Barley (Hordeum vulgare)
Inaugural-Dissertation
zur
Erlangung des Doktorgrades
der Mathematisch-Naturwissenschaftlichen Fakultät
der Universität zu Köln
vorgelegt von
Ermias Habte Haile
aus Nazreth, East Shoa Ethiopia
Köln, 2013
II
Diese Arbeit wurde am Max-Planck-Institut für Züchtungsforschung in Köln in der Abteilung fur Entwicklungsbiologie der pflanzen (Director:Prof.Dr.G.Coupland) angefertigt.
Prüfungsvorsitzender: Prof. Dr. Martin Hülskamp Berichterstatter:Prof. Dr. George Coupland
Prof. Dr. Ute Höcker
Tag der mündlichen Prüfung
October,14,2013
III
Abstract
The circadian clock is an important timing system that, in part, controls stress adaptation in Arabidopsis thaliana. In the model crop barley, the clock orthologs Ppd-H1 and HvELF3 are important regulators of photoperiod response and flowering. However, little is known about additional effects of the clock on plant performance and stress adaptation in barley. Therefore, the objectives of this study were i) to analyse the effects of natural variation at the barley photoperiod response and clock genes Ppd-H1 and HvELF3 on response to osmotic stress and
ii)to test whether osmotic stress at the root acted as an input signal to the shoot circadian clock and thus changed diurnal patterns of physiological traits.
The first chapter describes changes in gene expression and physiology under polyethylene glycol induced osmotic stress in seedlings of two spring barley cultivars carrying a natural mutation in Ppd-H1 and two derived introgression lines with the wild type Ppd-H1 allele. Analysis of performance at three consecutive days under stress revealed that the natural mutation in Ppd-H1 resulted in reduced cell membrane injury and increased photosynthetic activity and concomitant lower expression of stress-responsive and senescence-activated genes as compared to the introgression lines with the wild type Ppd-H1 allele. In the second chapter, I analysed diurnal changes of clock and stress -expression and of leaf water relations and gas exchange in two pairs of genotypes varying at Ppd-H1 and HvELF3. Variation at HvELF3 affected the phase and shape of the clock and stress-gene expression profiles, whereas variation at Ppd-H1 modified the expression levels only of stress genes. Osmotic stress upregulated expression of clock and stress- response genes and advanced their expression peaks. Expression differences in clock genes did not have strong effect on the diurnal expression of physiological traits.
Taken together, this thesis demonstrates that osmotic stress at the barley root altered clock gene
expression in the shoot and acted as a spatial input signal into the clock. Ppd-H1 controlled
stress-induced senescence, while variation at HvELF3 did not affect senescence related traits,
and had minor effects on gas exchange under stress. Unlike in Arabidopsis, barley primary
assimilation was less controlled by the clock and more responsive to environmental
perturbations, such as osmotic stress.
IV
Zusammenfassung
Die circadiane Uhr ist ein interner Zeitmesser, der unter anderem die Anpassung an Stress in der Modelpflanze Arabidopsis thaliana koordiniert. In der Modell-Getreidepflanze Gerste spielen die Uhrgene Ppd-H1 und HvELF3 eine wichtige Rolle für die Regulierung der Blüte in Abhängigkeit der Photoperiode. Allerdings ist der Einfluss der circadianen Uhr auf die agronomische Leistung und Anpassung an Stress in Gerste noch wenig erforscht. Das Ziel dieser Arbeit ist es, i) den Einfluss natürlicher Variation an Ppd-H1 und HvELF3 auf das Verhalten von Gerstenkeimlingen unter osmotischen Stress zu untersuchen, ii) den Effect von osmotischem Stress an der Wurzel auf die Expression von Uhrgenen und physiologischer Merkmale im Blatt zu untersuchen.
Im ersten Teil meiner Arbeit beschreibe ich die Effekte von Variation an Ppd-H1 auf die Expression von Stress-induzierten Genen und physiologische Merkmale unter osmotischem Stress, induziert durch Polyethylenglycol. Zwei Genotypen mit verschiedenen Allelen für Ppd- H1 zeigten unter osmotischem Stress Unterschiede in der photosynthetischen Aktivität und Zellmembranpermeabilität, und in der Expression von Stress- und Seneszenz- induzierten Genen.
Im zweiten Teil meiner Arbeit gehe ich näher auf die Interaktion von osmotischem Stress und diurnalen Änderungen circadianer Rhythmen ein. Hierfür wurden diurnale Genexpressionsprofile der Uhrgene und Stress-induzierter Gene erfasst, sowie Änderungen physiologischer Parameter unter osmotischem Stress untersucht. Osmotischer Stress führte zu einer Induktion von Genen der circadianen Uhr und der Stress-Signalwege, sowie zu einer Verschiebung ihrer diurnalen Expressionsprofile. HvELF3 beinflusste die Expressionsphase und Form von Uhr- und Stressgenen, während Ppd-H1 nur die Expressionshöhe von Stressgenen regulierte. Diese Veränderungen korrelierten nicht mit Änderungen in den betrachteten physiologischen Parametern.
Zusammenfassend zeigen meine Ergebnisse, dass Ppd-H1 neben seiner Rolle in der
photoperiodischen Regulation der Blüte pleiotrope Funktionen in der osmotischen Stressantwort
und der Stress-induzierten Seneszenz übernimmt. Des Weiteren führte osmotischer Stress an den
Wurzeln zur Änderung der Genexpresssion der circadianen Uhr im Spross. Im Unterschied zu
Arabidopsis scheint der Primärmetabolismus in Gerste weniger stark von der circadianen Uhr
als von äusseren Umwelteinflüssen, wie osmotischer Stress, kontrolliert zu sein.
V
Abbreviations
ABA Abscicic acid ABI5 ABA-insensitive5 ABRE ABA responsive element APX1 Ascorbate peroxidase1 ARF1 ADP-rybosylation factor 1 AT Time after stress
CAT1 Catalase 1
CCA1 Cicadian clock -associated1 CCAF Circadian clock factor DRE Drought responsive element DREB1 Drought responsive binding1 DRF1 Drought responsive factor 1 EC Evening complex
EE Evening element EL Electrolyte leakage
Fv/Fm Maximum quantum yield of PSII GA Gibberlicc acid
GI Gigantia
HRGP Hydroxyproline-Rich Glycoprotein LD light dark
LHY Late elongated hypocotyl LREM Light response element motif LT Leaf temperature
MDA Malondialdehyde PEG Poly ethylene glycol PI Performance index
PIF Phytochrome interacting factor
PRR PSEUDO-RESPONSE REGULATOR PSII Photosystem II
RWC Relative water Content
SAM Shoot apical meristem
TF Transcript factor
TOC1 Timing of CAB1
ZT Zeitgeber time
VI
Table of Contents
Contents
Zusammenfassung ... IV Abbreviations ... V Table of Contents ... VI
Chapter One- The Effect of Natural Variation at Ppd-H1 on Responses to to Osmotic in Barley ... 1
Introduction ... 1
Materials and Methods ... 6
Barley genotypes ... 6
Growth conditions ... 6
Experimental set up ... 6
Determination of relative water content (RWC) ... 7
Photochemical efficiency ... 7
Leaf temperature ... 8
Electrolyte leakage ... 8
Quantification of proline ... 8
Leaf Malondialdehyde (MDA) measurement ... 9
Apical meristem measurement ... 9
Germination test ... 9
RNA extraction, cDNA synthesis and real time qRT-PCR ... 10
Design and validation of qRT-PCR primers ... 10
Cloning of PCR product for standard curve in qRT-PCR ... 11
Statistical analysis ... 11
Results ... 12
Effect of short-term osmotic stress on physiological responses of genotypes varying at Ppd-H1 ... 12
Cell-membrane stability affected by short-term osmotic stress and by natural genetic variation at Ppd- H1 ... 13
Chlorophyll fluorescence is affected by natural genetic variation at Ppd-H1 osmotic stress ... 17
Association between physiological parameters in osmotic-stress ... 19
Changes of shoot apical meristem under short-term osmotic stress ... 20
Expression of genes involved in osmotic stress signaling pathway in genotypes differing at Ppd-H1 under osmotic stress ... 22
VII Differential expression of ROS scavenging and senescence activated genes under osmotic stress
between genotypes differing at Ppd-H1 ... 26
Correlation between candidate drought stress gene expression under osmotic-stress ... 28
Seed germination affected by allelic variations at Ppd-H1 under exogenous ABA application ... 29
Discussion ... 30
Short term Osmotic stress affects water status of barley seedlings... 30
Expression of stress-responsive genes under PEG-induced osmotic stress in barley ... 32
ROS scavenging and senescence activated genes were altered by osmotic stress ... 34
Variation at Ppd-H1 affects osmotic stress in barley ... 34
Ppd-H1 sensitivity to ABA-mediates seed germination ... 37
Conclusion ... 38
Chapter Two- Osmotic Stress at the Barley Root Affects Expression of Circadian Clock Genes in the Shoot ... 39
Introduction ... 39
Materials and Methods ... 42
Plant material and growth conditions ... 42
Osmotic stress application ... 43
Leaf sampling and gene expression analysis ... 43
Physiological and morphological measurements ... 43
Statistical analysis ... 44
Comparative analysis of cis-acting regulatory elements ... 44
Results ... 45
Osmotic stress at the root acts as an input into the shoot circadian clock ... 45
Osmotic stress affects the levels and peak phases of stress gene expression ... 49
Cis-acting regulatory elements in core clock and drought-responsive genes ... 54
Diurnal changes of physiological responses to short-term osmotic stress ... 54
Variation at HvELF3 does not affect physiological responses to osmotic stress ... 58
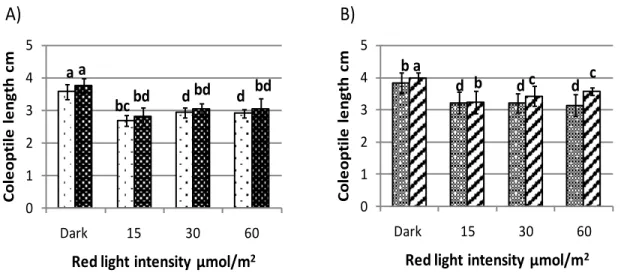
Variation at HvELF3 and Ppd-H1 does not affect coleoptile development ... 61
Discussion ... 62
Reciprocal interaction between clock and stress-response genes ... 62
Variation at Ppd-H1 affects the expression levels of stress-response genes... 63
Diurnal pattern of physiological traits do not correlate with diurnal changes in gene expression ... 64
Conclusion ... 65
References ... 67
VIII
Supplementary Tables ... 79
Acknowledgements ... 102
Erklärung ... 103
Lebenslauf ... 104
1
Chapter One- The Effect of Natural Variation at Ppd-H1 on Responses to to Osmotic in Barley
Introduction
Drought is the most important abiotic constraint to plant survival and global crop productivity.
Water deficit affects plant physiological, biochemical, as well as molecular processes (Harb et al., 2010). Its impact on plants differs depending on developmental stage of the plant, duration and severity of the stress and the ability of plant to adapt to drought stress. Responses to drought stress at different growth stages could thus provide a basis for developmental strategies to adapt and respond to drought stress (Vurayai, et al.,2011). Plants respond to drought stress through changes in morphology, physiology, and metabolism in different organs of the plant (Chaves et al., 2002). At the cellular level, plant responses to water deficit may result from cell damage, whereas responses at tissue and organ level may be correspond to adaptive mechanisms (Cellier et al., 1998). The adaptive strategies to cope with the prevailing drought stress include drought escape, drought avoidance and drought tolerance. An important drought escape mechanism is rapid phenological development which allows reproduction outside the dry season. Drought avoidance describes the maintenance of a high tissue water potential through reduced transpiration or improved water uptake. Finally, drought tolerance allows the plant to survive and reproduce in the presence of a low water content in the plant, through accumulation of osmolytes, antioxidants, and other protective proteins ( Ingram and Bartels, 1996; Chavez et al., 2003).
As an escape strategy, the pattern of crop development is an important trait for adaptation to dry
environments. Quantitative Trait Loci (QTL) studies showed that genomic regions associated
with improved yield under drought coincided with major flowering genes in barley and
wheat(Quarrie et al., 2006; von Korff et al., 2008; McIntyre et al., 2009; Rebetzke et al., 2008
,Rollins et al. 2013). Studies suggest that flowering time genes have pleiotropic effects on plant
architecture, yield structure and even shoot sodium accumulation (Taeb, et al., 1992; Kurepa, et
al. 1998; Lens, et al., 2008; Kinoshita et al. 2011; Rollins et al. 2013). However, not much is
known about the direct or indirect effects of flowering time genes on genes and pathways other
than those involved in the control of development.
2
Photosynthesis is one the plant processes that is affected primarily by drought stress. The effects of drought stress on photosynthesis can be direct through the reduction of CO
2diffusion (Flexas et al., 2012) or indirectly through alteration of photosynthetic metabolism (Cornic and Fresneau, 2002) that arises from imbalances of electron transport (Bartoli et al., 2000). Furthermore, these imbalances of electron transport enhance the accumulation of reactive oxygen species (ROS) such as superoxide radicals, singlet oxygen, and hydroxyl radicals (Cruz de Carvalho, 2008).
Hence, the increased ROS would damage proteins, lipids and DNA (Mittler et al., 2002). For example, peroxidation of lipids, commonly taken as an indicator of oxidative stress, disrupts the membrane integrity of the plant cell. This means that essential solutes leak out from the organelles and from the cell and cause the damage of membrane function and metabolic imbalances (Blokhina et al., 2003). In addition, drought stress could also damage oxygen- evolving complex of photosystem II and reaction centers (Subrahmanyam et al., 2006).
Therefore, in order to examine the extent of damage in the photosynthetic apparatus chlorophyll fluorescence measurements have become a widely used method to study the functioning of the photosynthetic activity and are used as an indicator of the plant’s response to drought stress (Massacci et al., 2008). Furthermore, drought induced senescence in plants plays an important role in plant survival. This drought-induced leaf senescence under stress contributes to the remobilization of nutrient material to the new tissues (Munne-Bosch and Alegre, 2004). ROS are regulators of leaf senescence (Zentgraf and Hemleben, 2008) and their production is also known to be increased under drought stress. Understanding this connection between development/
senescence and stress response might be crucial to decipher the genetic and molecular control of stress responses in plants.
Studies on the model plant Arabidopsis revealed genes and gene networks of drought responses
in plants, and these were classified in regulatory and functional (response) genes (McCue and
Hanson, 2002; Shinozaki and Yamaguchi-Shinozaki, 2007; Harb et al., 2010). Nakashima et al.,
(2009) showed that gene networks regulating drought responses are conserved between dicots
and monocots. The common drought stress signaling pathway are comprised of abscisic acid
(ABA)-dependent and ABA-independent pathways (Shinozaki and Yamaguchi-Shinozaki,
2007). Key genes for these ABA-dependent/independent pathways have been identified in
Arabidopsis , such as DROUGHT-RESPONSIVE-BINDING PROTEIN2 (DREB2)/C-REPEAT
BINDING FACTOR (CBF) and ABA-RESPONSIVE ELEMENT BINDING PROTEINS (AREB)
3
(Bartels and Sunkar, 2005; Sakuma et al., 2006). These transcription factors induce downstream functional genes, which are involved in cellular homeostasis to mitigate the effects of stress (Ramanjulu and Bartels, 2002). Orthologous genes involved in these regulatory pathways were also identified in barley (Tondelli et al., 2006; Guo et al., 2009), but the functions of most of these genes have yet to be identified. Despite the existence of common regulatory mechanisms between monocots and dicots, some stress-inducible genes such as DREB2 like genes in barley are induced both by ABA and drought stress (Xue and Loveridge, 2004), suggesting that drought signaling pathways might be different in barley as compared to the model plants Arabidopsis and rice.
Barley is one of the most drought tolerant crops which is cultivated in various parts of the world
and is an ideal model crop for drought stress studies (Eshghi et al., 2010). Mediterranean barley
which is adapted to terminal drought is characterized by a rapid development under long day
(LD) conditions (von Korff et al., 2008). Early flowering under LD in barley is primarily
controlled by the photoperiod response gene Ppd-H1 (Turner et al., 2005). Barley genotypes
carrying the mutated recessive ppd-H1 allele are late flowering whereas the dominant Ppd-H1
allele causes early flowering under LD (Campoli et al., 2012). A single nucleotide mutation in
the CCT domain of Ppd-H1 resulting in an amino acid change is causative for this difference in
sensitivity to LD (Turner et al., 2005). Natural variation at this gene is adaptive and shows a
specific geographical distribution. The photoperiod sensitive winter barley genotypes (ancestral)
are predominant in Mediterranean areas and represents an adaptation to terminal drought and
heat. In contrast, the derived photoperiod insensitive allele was selected in spring barley cultivars
grown in temperate Northern European areas as an adaptation to longer growing seasons
(Cockram et al., 2007). Ppd-H1 encodes a PSEUDO-RESPONSE REGULATOR (PRR) gene,
most similar to the circadian clock gene PRR7 in Arabidopsis (Turner et al., 2005). The circadian
clock is an autonomous oscillator that produces endogenous biological rhythms with a period of
about 24 hours. The Arabidopsis circadian clock consists of core oscillators that connect morning
and evening phases. The central core feedback loop comprises two MYB genes CIRCADIAN
CLOCK ASSOCIATED1 (CCA1) and LATE ELONGATED HYPOCOTYL (LHY) which is
expressed in the morning and represses transcription of the evening expressed PRR gene TIME
OF CAB EXPRESSION1 (TOC1) (Wang and Tobin, 1998; Alabadi et al., 2001). The expression
of CCA1/LHY declines in the evening releasing the repression of TOC1 in the evening. The
4
morning feedback loop comprises of PRR7 and PRR9, the transcription of these genes is promoted by CCA1/LHY and the subsequent accumulation of PRR7 and PRR9 proteins down regulates the transcripts of CCA1/LHY genes (Farre’ et al., 2005). This loop also involves, EARLY FLOWERING 3 (ELF3), EARLY FLOWERING 4 (ELF4) and LUX ARRYTHMO (LUX) which promotes CCA1 and LHY expression and represses PRR7 and PRR9 (Doyle et al., 2002;
Hazen et al., 2005). The evening feedback loop involves GIGANTIA (GI) regulates negatively TOC1 expression (Pokhilko et al., 2012).
The circadian clock is implicated in regulation of stress responses in plants (Matsui et al., 2008;
Mizuno and Yamashino, 2008). For example, studies in Arabidopsis have shown that the circadian clock is an important mechanism controlling stress adaptation in plants by coordinating their metabolism and development with predicted daily and seasonal changes of the environment (Green et al, 2002; Michael et al, 2003; Dodd et al, 2005). In line to these, global transcriptome analysis identified several stress-responsive genes that are controlled by circadian clock in Arabidopsis such as genes providing protection against cold stress, oxidative and heat stress (Covington et al., 2008; Lai et al., 2012). For example, constitutive expression of DREB1s/CBFs genes were observed in triple PRR mutants (PRR5, PRR7 and PRR9), which reveals a direct link between clock genes such as PRRs to the stress inducible transcription factors CBFs (Nakamichi et al., 2009). This suggests a relationship between PRR genes and stress-inducible DREB/CBF genes in plants. Despite the prominent role of Ppd-H1 for photoperiod response and adaptation, its effect on stress adaptation through clock dependent or independent control of stress responsive genes has not yet been analyzed in barley.
Furthermore, recent studies indicated that the circadian clock is also involved in the control of
seed germination (Penfield and King, 2009). It is believed that circadian clock is arrested in dry
seeds, but the start of seed imbibition could set the phase and synchronize Arabidopsis circadian
clock (Zhong et al., 1998). Circadian clock and seed germination are sensitive to environmental
stimuli and can be modulated by light and temperature (McClung et al., 2006). Because of the
common environmental factors setting these two events, there is a possible interaction between
clock and seed germination. Moreover, metabolism of the plant hormones such as ABA and
gibberilic acid (GA) are under the control of the clock, including genes important in germination
control, suggesting that this is the mechanism through which the clock controls germination
5
(Michael et al. 2008; Penfield and Hall, 2009). In agreement to these ideas, a previous study has indicated the interaction of central seed dormancy regulator ABA-INSENSITIVE3 (ABI3) and TOC1 in Arabidopsis (Kurup et al., 2000), indicating the involvement of circadian clock in seed germination through hormone balance control. In addition, a recent study by Penfield and Hall, (2009) demonstrated that mutations in the circadian clock genes CCA1/LHY, GI and LUX altered seed germination in Arabidopsis. Their study also indicated the importance of clock genes for the normal ABA and GA responses in seeds. However, the effects of other circadian clock genes including PRR7 and PRR9 on seed germination remain to be demonstrated. Furthermore, there is less information available on how alteration of circadian clock genes affects seed dormancy and germination in cereals.
Different experimental procedures have been developed for mimicking drought stress which differed in terms of intensity and dynamics. Polyethylene glycol (PEG) is a ionically neutral osmotically active polymer and has been widely used to induce osmotic stress by decreasing the water potential of the nutrient solution (Murillo-Amador et al., 2002). With this method a water deficit can be uniformly applied to all plants and higher molecular weight of PEG such as 8000 or more does enter into the plant roots and is not toxic to plant cells (Verslues et al., 2006).
Hence, many drought/osmotic stress experiments have used PEG to understand physiological, metabolism and molecular changes drought stress (Kumar et al., 2011; Marcin’ska et al., 2013;
Yang et al., 2011) and to identify tolerant cultivars in different crops (Badiane et al. 2004;
Nodichao, 2010).
The objective of this study was to understand the role of natural genetic variation at major
photoperiod response genes and circadian clock ortholog Ppd-H1 on plant performance under
osmotic stress. The second objective of the present study was to study the effects of natural
variation at Ppd-H1 on seed germination under ABA. The plant performance was analyzed by
measuring physiological responses and transcript changes under short-term PEG-induced
osmotic stress conditions and by assessing seed germination under different concentrations of
ABA.
6
Materials and Methods Barley genotypes
The spring barley cultivars Scarlett and Triumph and derived introgression lines S42-IL107 and Triumph-IL in the background of Scarlett and Triumph, respectively, were used in this study.
S42-IL107 was generated by crossing the spring barley Scarlett with the wild barley accession ISR42-8, the introgression line was then obtained after repeated selection and backcrossing to Scarlett (von Korff et al., 2004; Schmalenbach et al., 2011); Triumph-IL was obtained from the cross of Triumph and the winter barley Igri and was kindly provided by David Laurie (John Innes Center, Norwich). Scarlett and Triumph carry the same mutation in the CCT domain of Ppd-H1 and are late flowering under LD (Turner et al. 2005). The introgression lines S42-IL107 and Triumph-IL harbor the photoperiod-responsive Ppd-H1 allele introgressed from wild barley and winter barley, respectively, and are early flowering under LD (Campoli et al., 2012).
Growth conditions
All chemical were purchased from Carl Roth GmbH unless stated otherwise. Seeds of all genotypes used in this study were surface-sterilized with 6 % Sodium hypochlorite solution for 30 min and stratified at +4°C for 2-3 days (d) on wet filter paper in the dark. The stratified seeds were pre-germinated at room temperature in the dark for 1 d. The germinated seeds were then placed in seed-holders which were filled with agar (Merck, Germany). After 2 d, seedlings were transferred to the hydroponics system which consisted of half-strength Hoagland nutrient solution (3.5 mM Ca(NO
3)
2, 2.5 mM KNO
3, 1 mM KH
2PO
4, 1 mM MgSO
4.7H
20, 0.5 mM Fe–
EDTA, 0.023 mM H
3BO
3, 0.004 mM MnCl
2-4H
2O, 0.47 mM ZnSO
4-7H
2O, 0.12 mM CuSO
4- 5H
2O, 0.006 mM Na
2MoO
4), as described by (Hoagland and Arnon, 1950). Plants were kept for 8-10 d in a climatic chamber at irradiance of 300 μmol/m
2/s and air temperature 20 °C during day and 16 °C at night time. The nutrient solution was changed every three to four days.
Experimental set up
Short-term osmotic stress experiments were conducted in 16 h photoperiod length (LD) using cultivars Scarlett and Triumph as well as introgression lines S42-IL107 and Triumph-IL.
Osmotic stress was applied after seedlings reached the two leaf stage. In order to generate
uniform osmotic stress conditions in the roots of the plants, seedlings were subjected to water
7
deficit by replacing the normal nutrient solution with one supplemented with 20 % PEG 8000 (Fluka, Germany) which corresponds to -0,8 MP osmotic potential. The media of the control plants were also replaced with freshly prepared Hoagland’s nutrient solution that corresponded to -0.2 Mpa. According to Hsiao (1973) the stress induced by PEG for 24, 48 and 72 h represents mild, moderate and severe water stress, respectively.
Each experiment was repeated three times. Physiological measurements and leaf sampling for RNA were conducted at three time points i.e. 24 h, 48 h and 72 h after stress. All measurements were conducted from second leaf from the bottom and samples were collected between ZT4-ZT6 in order to minimize the diurnal effects on sampling. In each experiment, RWC, photochemical efficiency and leaf temperature were analysed from 8-9 plants per genotype, treatment and time point. Measurements of proline content and MDA accumulation were conducted using three replicates per genotype, treatment and time point, each pool of three leaves was considered as one biological replicate. Leaf samples for total RNA extraction were also collected at three different time points using three replicates each of which consists of two pooled leaf samples.
The leaf samples collected for RNA were immediately frozen in liquid nitrogen and stored -80
⁰C until processed.
Determination of relative water content (RWC)
Leaf relative water content (RWC) was measured on the second emerged leaf. Water content was estimated according to Turner (1981) and was calculated from the equation: RWC = (FM - DM)/(SM - DM) X 100, where FM is the fresh mass of the leaves, SM is the mass at full water saturation, measured after submerging the leaves for 24 h in the dark in distilled water at +4 °C, and DM is the mass after drying the leaves for 24 h at 70 °C.
Photochemical efficiency
Photochemical efficiency was estimated using chlorophyll fluorescence measurements.
Chlorophyll fluorescence was measured on the middle part of the abaxial side of the second fully
developed intact leaf after dark-adaptation for 20 min with an in situ portable fluorometer Handy
Plant Efficiency Analyzer (PEA) (Hansatech, King’s Lynn, Norfolk, UK) as described by
Humbeck et al. (1996). Fluorescence was induced using 3000 µmol photons m
-2s
-1flash of
actinic light persisting for 1 s on dark adapted leaves. The induction curves were analyzed using
the PEA plus software (Hansatech,UK). The chlorophyll fluorescent parameters calculated
8
include Fv/Fm, performance index (PI) and Area. Where, Fv/Fm ratio measures the efficiency of excitation energy captured by open PSII reaction centers representing the maximum capacity of light-dependent charge separation (Krause and Weis, 1991). Performance index (PI) encompasses three components; the force of the light reactions, the force of the dark reactions and the efficiency of light trapping by the light harvesting complex. The area above the fluorescence curve between Fo and Fm (Area) is proportional to the pool size of electron acceptors Qa on the reducing side of PSII.
Leaf temperature
Leaf temperature (LT) was measured on the second emerged leaf. LT was measured using Optris LS LT portable infrared thermometer (Optris, USA) set to close focus mode and with the emissivity set 0.99. Temperature measurements were taken prior to sampling and measured from the middle portion of the blade.
Electrolyte leakage
Electrolyte leakage was measured according to Szalai et al., (1996). Uniform leaf discs from nine plants from each genotype per condition were pooled and placed in a glass vial (20 ml). The leaf discs were then washed three times in deionised water to remove electrolytes adhered on the leaf surface. Then 10 ml deionised water was added to the vial, capped and incubated in the dark for 24 h at room temperature. The conductance was measured using a conductivity meter (Horiba, Ohio). After the initial measurement (i), the vials were autoclaved for 15 min to kill the leaf tissue and to achieve 100 % electrolyte leakage. After cooling, the final conductivity reading (ii) was taken. The measurement was then represented as percentage of (i/ii) *100. These two measurements were carried out individually for all samples from both the control (non-stress) and stress treatments every 24 h for 3d after stress application.
Quantification of proline
Plant material (0.1-0.2 g fresh weight of leaf) was collected on ice and stored at -80 °C for further processing. The proline content was estimated according to the method of Bates et al.
(1973). Leaf samples were extracted with 3% sulphosalicylic acid, extracts (200µl) were held for
1 hour in boiling water after adding 200 µL acidic ninhydrin and 200 µL glacial acetic and the
reaction was terminated in an ice bath. The reaction mixture was extracted with 400 µL toluene
9
mixed for 60 seconds. The chromophore containing toluene was aspirated from aqueous phase.
The proline content was then measured by spectrophotometer (Synergy 4, Biotek, Germany) by reading at 520 nm against toluene blank. The standard curve was prepared from a 10X dilution series of L-proline (Sigma Aldrich, Germany) with 0.1 to 100 µg ml-1 concentrations. Free proline content was determined from standard curve and calculated following Bates et al., (1973):
µ𝑔 𝑝𝑟𝑜𝑙𝑖𝑛𝑒 /𝑚𝑙 𝑋 𝑚𝑙 𝑡𝑜𝑙𝑢𝑒𝑛𝑒 115 .5µ𝑔/µ𝑚𝑜𝑙𝑒
𝑔 𝑠𝑎𝑚𝑝𝑙𝑒 /5 = µmol/g fresh weight
Leaf Malondialdehyde (MDA) measurement
The level of lipid peroxidation Malondialdehyde (MDA) was measured following the modified method of Heath and Packer (1968) with 0.2 g of fresh leaf per plant of the second leaf. The leaf material ground in liquid nitrogen and homogenized with 2 ml solution of 0.1 % Trichloracetic acid (TCA). The homogenate was centrifuged at 1000xG for 15 min. Then 2 ml of the supernatant was mixed with 2 ml of TCA and 2 ml of Thiobarbituric acid (TBA). The samples were incubated at 95 °C for 30 min and immediately transferred to ice for 5 min, followed by centrifugation at 1000 g for 1 min. The supernatant absorbance was read at 532 nm, and values correspond to non specific absorption 600 nm were subtracted. MDA concentration was calculated using its molar extinction coefficient (є= 155 mM-1 cm-1)
Apical meristem measurement
The development of plants was monitored by dissecting and scoring the shoot apical meristem three day after application of osmotic stress in 3-5 replicate plants according to the Waddington scale (Waddington et al., 1983).
Germination test
Seeds of all genotypes were surface-sterilized with 6 % sodium hypochlorite solution for 30 min and rinsed with sterile water. The sterilized seeds were placed in 10cm Petri dishes lined with two sheets of Whatman No.1 filter paper, saturated either with 3ml distilled water (control) or by adding different concentrations of 3ml ABA (± Cis,trans-abscisic acid, Sigma, Germany).
Germination tests for all samples were immediately conducted in the dark at room temperature.
10
Three replications of 40 seeds were used per genotype and treatment conditions. After 3d, germinated seeds (those where the coleoptile had emerged through the hull) were counted and expressed as a germination percentage. The experiment was repeated three times.
RNA extraction, cDNA synthesis and real time qRT-PCR
Total RNA was extracted from 100 mg of tissue using TRIZOL® reagent (Invitrogen,Germany) following manufacturer’s instructions, except for the addition of RNaseH, followed by a DNase treatment (final volume 100 μL). First strand cDNA synthesis was performed on 4 μL of total RNA using 100 U of SuperScriptTM II RT (Invitrogen, Germany) and 500 ng of poly-T primer and following manufacturer’s recommendations (final volume 40 μL). The resulting cDNA was diluted 1:4 in nuclease-free water and stored in aliquots at −20 °C.
Real-Time quantitative PCRs (qRT-PCR) were performed on cDNA samples using gene-specific primers (Supplementary Table 1). Amplifications were performed using 4 μL of cDNA, 0.5 U of GoTaq DNA polymerase (Promega), 0.2 mM dNTP, 2.5 mM MgCl2, 0.2 μM each primer, and 0.5 μL of EvaGreen (Biotium) in a final volume of 10 μL. Reactions were performed in a LightCycler480 (Roche) with the following amplification conditions: 95 °C for 5 min, 45 cycles of 95 °C (10 s), 60 °C (10 s) and 82 °C (10 s). Appropriate non-template controls were included in each 384-well PCR. Dissociation analysis was performed at the end of each run and the melting curves for each primer pair showed a single peak confirming the specificity of the reaction. The standard curves were prepared from a dilution series of plasmids containing the target fragments and subjected to qRT-PCR analysis with the respective cDNA samples. Starting amounts for each data point were calculated based on the titration curve for each target gene and the reference (HvActin) gene using the LightCycler480 Software (Roche; version 1.5).
Design and validation of qRT-PCR primers
Drought/osmotic responsive genes in barley were identified either through public data base
searches from NCBI (http://www.ncbi.nlm.nih.gov/) and literature searches or via BLAST
searches of known drought responsive genes to barley EST, Contigs, and mRNA sequences in
NCBI, IPK Barley Blast Server (http://webblast.ipk-gatersleben.de/barley/viroblast.php) and
HARVEST: Barley databases. Specific primer pairs for qRT-PCR were designed by using
Primer3 (http://primer3.wi.mit.edu) (Supplementary Table S1). The specificity and efficiency of
11
the primers were tested by carrying out preliminary qRT-PCR assays on a pool of cDNAs from stress and control samples of different concentrations. Primers for candidate gene were then selected based the presence of single peak by melting curve analysis and absence of non-specific products or primer-dimer artifacts. The specificity of the amplicons was also checked by electrophoresis on 2 % agarose gel and sequencing of the PCR products in order to confirm that the product sequence was the same as the target candidate gene.
Cloning of PCR product for standard curve in qRT-PCR
Amplification of stress response genes was conducted from cDNA of stress samples using GoTaq® DNA polymerases (Promega, Germany). The PCR amplifications were performed using 5 μL of cDNA, 0.5 U of GoTaq DNA polymerase, 5 μL 5x GoTaq buffer, 1 μL 2 mM dNTP, 0.5 μL 10 mM of each primer, and 12.9 μL sterile H
2O in a final volume of 25 μL Reactions were performed in a PCR Cycler (Eppendorf, Germany) with the following amplification conditions: 95 °C for 3 min, 35 cycles of 95 °C (10 s), 60 °C (30 s) and 72 °C (30 s). After detection of specific PCR amplicons, the PCR products were cloned into the pCR®2.1- TOPO® vector using T TOPO® TA Cloning® Kit according to manufacturers recommendation (Invitrogen, USA). The recombinant plasmids were extracted by the Nucleospin ® Plasmid purification kit (Mascherey-Nagel, Germany). The extracted recombinant plasmids were sequenced. The obtained sequences were queried online by using the BLAST service at the NCBI. Dilutions of purified plasmid DNA were used to construct gene specific calibration curves. These calibration curves were used for calculation of each candidate and reference gene concentration in qRT-PCR.
Statistical analysis
Statistical analyses were carried out with SAS version 9.1 (SAS Institute Inc, 2003). The procedure LSMEANS was used to calculate adjusted means and standard deviations for each trait. A multifactorial analysis of variance (ANOVA) was performed for each trait with a mixed general linear model using the PROC GLM procedure:
Y
ijkl= µ + G
i+T
j+R
k+P
l+GT
ij+GP
il+TP
jl+GTP
ijl+R
ijkl.where µ is overall mean, G
iis the fixed effect of the i-th genotype, T
jis the fixed effect of the j-
th treatment, R
kis the random effect of the k-th replication , P
lis the fixed effect of the l-th time
point, GT
ijis the fixed interaction of the i-th genotype with j-th treatment, GP
ilis the fixed
12
interaction of the i-th genotype with l-th time point, TP
jlis the fixed interaction of the j-th treatment with l-th time point ,GTP
ijldenotes the interaction effects of i-th genotype with j-th treatment and l-th time point, R
ijklis the residual effect. Pearson correlations coefficients between trait values were calculated with the least squares means for stress and control plants separately.
Results
Effect of short-term osmotic stress on physiological responses of genotypes varying at Ppd-H1
The present study was conducted to examine whether the natural mutation in the CCT domain of
the major photoperiod response gene Ppd-H1 and pseudo response regulator homolog (PRR7)
affected performance under osmotic stress. The effects of short-term osmotic stress on
physiological performance, relative water content (RWC), leaf temperature (LT) and proline
content, were analysed in the spring barley cultivars Scarlett/ S42-IL107 and Triumph/Triumph-
IL at 24h, 48h and 72h after beginning of the stress treatment (AT). A significant reduction of
RWC was observed in Scarlet and S42-IL107 under stress compared to control conditions at all
time points (Fig. 1A), while in Triumph and Triumph-IL the reduction of RWC was only
significant 72h AT (Fig. 1B). The lowest RWC was observed under stress 72h AT, when it was
86 % for Scarlett(ppd-H1), 85 % for S42-IL107(Ppd-H1), 85 % for Triumph(ppd-H1) and 75 %
for Triumph-IL(Ppd-H1). The RWC of control plants ranged between 91 % and 94 % in all
genotypes. Although no significant differences were observed between Scarlett(ppd-H1) and
S42-IL107(Ppd-H1) at all time points under control and stress conditions, a significant
difference in RWC was observed between Triumph(ppd-H1) and Triumph-IL(Ppd-H1) in
stressed plants 72h AT (Supplementary Table S2,S3,S4 and S5). LT was significantly increased
in stressed plants compared to control plants in all genotypes (Fig. 1, C and D). No significant
differences between genotypes differing at Ppd-H1 was recorded for LT. Proline content
increased gradually during the stress treatment and was significantly higher under stress
compared to control conditions in all genotypes 48h and 72h AT, with an up to three-fold
increase of proline content in stress as compared to control conditions (Fig. 1, E and F). No
significant differences in proline accumulation were observed between genotypes differing at
13
the Ppd-H1 locus. Taken together short term osmotic stress affected RWC, LT and proline content, but variation at Ppd-H1 did not cause differences in these physiological traits.
Cell-membrane stability affected by short-term osmotic stress and by natural genetic variation at Ppd-H1
Osmotic stress commonly leads to the production of reactive oxygen species (ROS) which in
turn affect membrane integrity (Blokhina et al., 2003). In order to test for the effects of osmotic
stress and variation at Ppd-H1 on ROS production and membrane integrity in barley, lipid
peroxidation was analyzed as was the percentage of electrolyte leakage (EL) under osmotic
stress. Changes in lipid peroxidation levels under osmotic stress were quantified by measuring
malondialdehyde (MDA) content. MDA levels were increased in stressed plants in comparison
to control plants 48h and 72h AT in all genotypes (Fig. 2, C and D). In general, MDA production
was elevated in Scarlett(ppd-H1) and S42-IL107(Ppd-H1) compared to Triumph(ppd-H1) and
Triumph-IL(Ppd-H1) under osmotic stress. The production of MDA was higher in S42-
IL107(Ppd-H1) (0.52) than Scarlett(ppd-H1) (0.38) and in Triumph-IL(Ppd-H1) (0.31) than in
Triumph(ppd-H1) (0.22) under osmotic stress 72h AT. The analysis of variance also showed
significant genetic differences in MDA production (Supplementary Table S2 and S4), indicating
a genotype dependent accumulation of MDA under osmotic stress.
14 Figure 1. Effects of osmotic stress and variation at Ppd-H1 on physiological performance in barley.
Seedlings were grown in hydroponics under long days (16h light) for 10 days. Seedling were immersed in 20 % PEG at the two leaf stage or kept under control conditions for 3 days and physiological traits were measured at a 24h interval. Scarlett(ppd-H1) control , Scarlett(ppd-H1) stress , S42- IL107(Ppd-H1) control and S42-IL107(Ppd-H1) stress are shown in left panel and Triumph(ppd-H1) control , Triumph(ppd-H1) stress , Triumph-IL(Ppd-H1) control and Triumph-IL(Ppd-H1) are shown in the right panel. A) and B) Relative water content, C) and D) Leaf temperature and E) and F) Proline accumulation. Different letters indicate significant differences at p≤
0.05 using least square means. Means ± standard deviation (Sd) (n = 3) are shown.
A) B)
C) D)
E) F)
70 75 80 85 90 95 100
Re la tive w at er c on te nt %
b a b b
aa b b
a b c c
70 75 80 85 90 95 100
Re la tive w at er c on te nt %
a
a a a a a a a
a a b
c
15 16 17 18 19 20 21 22
Le af t em pe ra tu re (⁰ C)
a a aa a a
b b bb bb
15 16 17 18 19 20 21 22
Le af t em pe ra tu re (⁰ C)
a a a a a
b bb
b b b
a
0 0.1 0.2 0.3 0.4 0.5 0.6 0.7 0.8
24 48 72
Pr ol in e µ m ol / g fr es h w ei gh t
Hours after stress a a a a a a a a
b b
b b
0 0.1 0.2 0.3 0.4 0.5 0.6 0.7 0.8
24 48 72
Pr ol in e µm ol /g fr es h w ei gh t
Hours after stress
a a a a a a
b b
b b
a a
15
Like MDA, EL was significantly increased in stressed plants compared to control plants 48h and 72h AT in Scarlett(ppd-H1) and S42-IL107(Ppd-H1) (Fig. 2A). Triumph(ppd-H1) and Triumph- IL(Ppd-H1) showed significantly higher EL under osmotic stress compared to control conditions at all time points (Fig. 2B). The increase in EL under osmotic stress was significantly higher in S42-IL107(Ppd-H1) as compared to Scarlett 72h AT and in Triumph-IL(Ppd-H1) as compared to Triumph at all time points. The analysis of variance demonstrated a significant effect of the genotype by time point interaction between Scarlett(ppd-H1) and S42-IL107(Ppd-H1) and between Triumph(ppd-H1) and Triumph-IL(Ppd-H1) (Supplementary Table S2 and S4). EL was thus affected by osmotic stress and by genetic variation between the spring barley genotypes Scarlett and Triumph and their respective introgression lines.
Taken together, the gradual increases in MDA and EL under osmotic stress indicated the
generation of free radicals and subsequent effects on cell membrane integrity. In addition, the
increased production of MDA and EL in the introgression lines S42-IL107(Ppd-H1) and
Triumph-IL(Ppd-H1) compared to Scarlett(ppd-H1) and Triumph(ppd-H1) showed genotype
dependent accumulation of ROS and differences in cell membrane stability under osmotic stress.
16 Figure 2. Effects of genetic variation (Ppd-H1) and osmotic stress on ROS production and cell membrane injury in barley seedlings grown under PEG-induced or under control conditions. Seedlings were grown in hydroponics under long days (16h light) for 10 days. Roots of seedlings at the two leaf stage were immersed in 20 % PEG to induce osmotic stress or were kept under control conditions for 3 days and A) and B) electrolyte leakage (EL) and C) and D) malondialdehyde (MDA) were measured at 24h intervals in Scarlett(ppd-H1) control , Scarlett(ppd-H1) stress , S42-IL107(Ppd-H1) control and S42- IL107(Ppd-H1) stress are shown in left panel and Triumph(ppd-H1) control , Triumph(ppd-H1) stress , Triumph-IL(Ppd-H1) control and Triumph-IL(Ppd-H1) are shown in the right panel.
Different letters indicate significant differences at p≤ 0.05 using least square means. Means ± standard deviation (Sd) (n = 3) are shown.
C) D)
0 5 10 15 20 25 30 35
El ec tr o lyt e le ak age %
aa a a ab
a b a b
a b
c
0 5 10 15 20 25 30 35
El ec tr o lyt e le ak age %
a b c d
aa b c
a a b
c
A) B)
0 0.1 0.2 0.3 0.4 0.5 0.6
24 48 72
M D A µ m o l/ g fr e sh w e ig h t
Hours after stress a aa a a a
b b a a
b c
0 0.1 0.2 0.3 0.4 0.5 0.6
24 48 72
M D A µ m o l/g fr es h w ei gh t
Hours after stress aabab
b
aa aab
b c ab
17
Chlorophyll fluorescence is affected by natural genetic variation at Ppd-H1 osmotic stress
To understand the effects of osmotic stress on photosynthesis activity, I measured the chlorophyll fluorescence transients under short-term osmotic stress. The fluorescence transients recorded included maximum quantum efficiency of photosystem II (Fv/Fm), the area above the fluorescence curve between initial fluorescence (Fo) and maximum fluorescence (Fm) (Area) and Performance index (PI). Osmotic stress had no significant effects on the expression of chlorophyll fluorescence parameters at all time points, except for 72h AT, when S42-IL107 and Triumph-IL showed a significant decrease in all three chlorophyll fluorescence parameters under osmotic stress as compared to control conditions. At the same time, no significant decrease in chlorophyll fluorescence were observed in their respective parental lines Scarlett and Triumph, except Area in Triumph and PI in Scarlett, under osmotic stress (Fig. 3, A, C and E).
(Supplementary Table S2,S3,S4 and S5). Furthermore, ANOVA revealed interaction effects of genotype by treatment for all three chlorophyll fluorescence parameters in Triumph(ppd-H1) and Triumph-IL(Ppd-H1) while in Scarlett(ppd-H1) and S42-IL107(Ppd-H1) only PI had significant interaction effect (Supplementary Table S3 and S5).
Altogether, the results show that the chlorophyll fluorescence parameters were affected by
osmotic stress 72 AT only in the introgression lines carrying a dominant Ppd-H1 allele.
18 Figure 3. Effect of short-term PEG-induced osmotic stress on chlorophyll fluorescence. Seedlings were grown in hydroponics under long days (16h light) for 10 days. Roots of seedlings at the two leaf stage were immersed in 20% PEG to induce osmotic stress or were kept under control conditions for 3 days and A) and B) Fv/Fm and C) and D) Area, E) and F) Performance index were measured at 24h interval from Scarlett(ppd-H1) control , Scarlett(ppd-H1) stress , S42-IL107(Ppd-H1) control and S42- IL107(Ppd-H1) stress are shown in left panel and Triumph(ppd-H1) control , Triumph(ppd-H1) stress , Triumph-IL(Ppd-H1) control and Triumph-IL(Ppd-H1) are shown in the right panel.
Different letters indicate significant differences at p≤ 0.05 using least square means. Means ± standard deviation (Sd) (n = 3) are shown.
A) B)
0.81 0.815 0.82 0.825 0.83 0.835 0.84
24 48 72
Fv/Fm
aa
a a a a a a aab a b
0.81 0.815 0.82 0.825 0.83 0.835
24 48 72
Fv/Fm
a aaa a a a a a a a b
0 10000 20000 30000 40000 50000 60000 70000 80000
24 48 72
Area
ababab a aa a a a a b
0 10000 20000 30000 40000 50000 60000 70000
24 48 72
Area
a aa a a
a a a a b
a c
0 0.5 1 1.5 2 2.5 3 3.5
24 48 72
Performance index
Hours after stress a a a
a a a a a b
c d a
0 0.5 1 1.5 2 2.5 3
24 48 72
Performance index
Hours after stress a a a a a a a a a
ab a
b
C) D)
E) F)
19
Association between physiological parameters in osmotic-stress
In order to identify the relationship among physiological parameters, Pearson correlation coefficients (r) were calculated across all genotypes and time points, but separately for control and stress conditions as shown in Table 1. The results demonstrated that most of the physiological traits had higher correlation coefficients under stress than control conditions.
Under stress, RWC was positively correlated with PI (0.26) and negatively with EL (-0.38), LT (-0.33), Proline (-0.3) and MDA (-0.26), but not under control condition. LT was positively correlated with EL (0.33) and MDA (0.29) under stress, while it was only positively correlated under control condition with proline (0.21). Proline accumulation was negatively correlated with chlorophyll fluorescent parameters both under stress and control conditions, while it was strongly and positively correlated with EL (0.54) and MDA (0.47) under stress conditions.
Chlorophyll fluorescence parameters (Fv/Fm, Area and PI) were strongly and negatively
correlated either with EL or MDA under stress condition. In addition, MDA was positively
correlated with EL (0.38) under stress which indicates the oxidative damage of lipid and
membrane permeability under stress conditions. Altogether, the strong associations between
RWC and other physiological traits might show that responses of the physiological traits were
determined by the water status of the leaves. In addition, the significant links between
photosynthetic efficiency responses (Fv/Fm, Area and PI) and cell membrane stability indicators
(EL and MDA) indicate that the stability of cell membrane influences the photochemical
efficiency of the cell.
20 Table 1.Pearson correlation coefficients for physiological traits measured across all genotypes
under stress (above the diagonal) or control conditions (below the diagonal)
RWC LT Proline Fv/Fm Area PI EL MDA
RWC -0.33* -0.3* 0.16 0.16 0.26* -0.38* -0.26*
LT -0.15 0.2 -0.21 -0.16 0.1 0.33* 0.29*
Proline 0.11 0.21* -0.21 -0.43* -0.34* 0.54** 0.47**
Fv/Fm 0.12 0.01 0.15 0.24* -0.02 -0.37* -0.11
Area 0 -0.22* -0.36* 0.07 0.15 -0.45** 0.05
PI 0.13 -0.01 -0.26* 0.03 0.34* 0.15 -0.56**
EL 0.02 0.19 -0.18 -0.08 0.08 0.19 0.38*
MDA 0.05 -0.02 0.29* -0.02 -0.26* 0.18 0.11
Significant (*= p<0.05, **= p<0.001) coefficients are underlined. EL electrolyte leakage, RWC relative water content, Proline proline content, Fv/Fm maximum quantum efficiency of Photosystem II ,Area the area above fluorescence curve between Fo and Fm, PI performance index ,LT leaf temperature and MDA malondialdehyde
Changes of shoot apical meristem under short-term osmotic stress
Plant development and growth are affected by drought stress (Harb et al.,2010). In order to
monitor the developmental changes under short-term osmotic stress, the development stage of
shoot apical meristems (SAM) of seedlings were scored 3 d after the start of stress based on the
Waddington developmental scale (Fig. 4;Waddington et al. 1983). The developmental stage of
SAM was advanced in the introgression lines carrying Ppd-H1 both under control and stress
conditions compared to Scarlett and Triumph. However, the development of SAM was not
affected by short-term stress.
21
Figure 4. Shoot apical meristem in Scarlett/S42-IL107 and Triumph/ Triumph-IL. Seedlings were grown in hydroponics under long days (16h light) for 10 days. Roots of seedlings at the two leaf stage were immersed in 20 % PEG to induce osmotic stress or were kept under control conditions for 3 days. A) The picture of the meristem after 72h control/stress. Development of the shoot apical meristem under control/stress treatments in B) Scarlett and S42-IL107 and C) Triumph and Triumph-IL. Means ± standard deviation (Sd) (n = 3) are shown.
Control
Stress
0 0.5 1 1.5 2 2.5
Waddington scale
0 0.5 1 1.5 2 2.5
Waddingtonscale
A)
B) C)
22
Expression of genes involved in osmotic stress signaling pathway in genotypes differing at Ppd-H1 under osmotic stress
Natural variation at Ppd-H1 affected photosynthesis parameters, generation of free radicals and cell membrane integrity. In addition, it has been shown that variation at Pseudo Response Regulator genes, homologous to Ppd-H1 in barley controlled the expression of stress response genes (DREB/CBF genes) in Arabidopsis thaliana (Dong et al., 2011; Nakamichi et al., 2009).
Therefore, the expression of representative genes induced by drought/osmotic stress HvDRF1 and HvDREB1 (drought responsive element binding protein 2 like genes (DREB2), HvABI5 (ABA-responsive gene), HvWRKY38 (ABA-responsive WRKY family gene), HvA22 (ABA- induced late embryogenesis abundant protein) were tested under osmotic stress and control conditions (Shinozaki and Yamaguchi-Shinozaki et al.,2007; Todaka et al., 2012). As the introgression lines S42-IL107 and Triumph-IL carry other genes from the donor parents (Schmalenbach et al.,2011;Turner et al.,2005), I have tested the transcript profile of the stress response gene involved in cell wall extension hydroxyproline-rich glycoprotein (HvHRGP) (Sujeeth et al.,2012), from the introgressed genes in S42-IL107 (Supplementary Table S21).
Moreover, the expression of PHYTOCHROME INTERACTING FACTOR (PIF), which is recently linked to abiotic stress as a negative regulator of DREB genes, was also tested (Kidokoro et al.,2009). Expression of these stress induced genes was monitored under the same conditions as used for measurements of physiological traits.
The expression of both DREB2 like genes was elevated in stressed plants as compared to control plants in all genotypes. Under osmotic stress, S42-IL107(Ppd-H1) and Triumph-IL(Ppd-H1) showed higher levels of HvDRF1 and HvDREB1 transcripts 24h and 48h AT compared to Scarlett(ppd-H1) and Triumph(ppd-H1) (Fig. 5A, B, 5C and D). Under control conditions, the expression of HvDRF1 and HvDREB1 was not significantly different between genotypes differing at Ppd-H1.
The expression of HvABI5 was significantly different between control and stress conditions 48h and 72h AT in all genotypes. However, no differences in expression of HvABI5 were detected between genotypes differing at Ppd-H1 both in control and stress conditions (Fig. 5 E and F).
Significant differences in the expression of HvWRKY38 between stress and control conditions
were observed at 48h and 72h AT in Scarlett and S42-IL107, and in Triumph and Triumph-IL
23