THE NEW APP
RECYCLING magazine DIGITAL EDITION
a New issues already available on Friday a Optimised for all devices
(smartphone, tablet, desktop)
a Keyword search across all issues a Multimedia bonus
content
a Read-aloud function
Print subscribers automatically get access to the app. More information here:
recycling-magazine.com/app-instructions
ORDER
NOW:
755 Metal Composition in Waste Combustion Ashes and their Recovery
Incineration Residues
Metal Composition
in Waste Combustion Ashes and their Recovery
Jorma Jokiniemi
1. Ash formation and composition ...756
1.1. Grate fired boilers ...758
1.2. Circulating fluidised boilers ...758
2. Emissions ...760
2.1. Fuel properties ...760
2.2. Process conditions ...761
2.3. Fine fly ash concentrations ...761
2.4. Trace elements ...762
3. Ash disposal and utilisation of valuable elements ...763
4. References ...766
Waste-to-energy (WtE) applications are increasingly being used to simultaneously re- duce the amount of waste and produce electricity and heat. As waste materials typically contain high concentrations of impurities that are transformed during combustion, the flue gases need to be cleaned efficiently in order to avoid harmful emissions to the environment. We determined experimentally fly ash and bottom ash particle charac- teristics – particle size, composition and concentration – as well as particle and trace element emissions during waste combustion in grate fired and circulating fluidized bed boiler plants. Both boiler types used selective non-catalytic reduction (SNCR) for NOx reduction together with novel integrated flue gas desulfurization (NID) for flue gas cleaning.
During our measurements, the flue gas cleaning devices were operating efficiently, and particle and trace element emissions were very low from both grate-fired and fluid- ized bed plants. All the measured emissions were clearly below the limit values set by European Waste Incineration Directive (WID).
As the emissions from waste-to-energy applications are well controlled by modern emission control devices there is huge amounts of bottom and fly ash produced from these plants. In Finland landfilling of bottom and fly ash as such is forbidden. This is because the ashes are typically defined hazardous materials and also because some kind of useful applications for the ashes should be achieved in the future. Currently the fly ash is stabilised before landfilling and bottom ash is used in road and other construction applications. From this perspective we can think that waste combustion
Incineration Residues
is actually a concentration step for recovering valuable incombustibles from waste material. Normally it has been thought that ash from waste combustion is a draw- back in terms of leachable metals. However, if we can utilize both fly and bottom ash as valuable materials, we can turn this drawback to benefit. Recovery of these non-renewable resources is essential for progression towards a circular economy.
In this study we evaluated possible ways to recover valuable elements especially from WtE fly ash as an alternative to stabilising and landfilling it.
1. Ash formation and composition
Nowadays for waste handling there are efficient source separation systems and the waste does not contain significant amounts of bio waste or other recyclable waste materials from households and industry. Waste material contains typically high concentrations of impurities that transform during combustion and may be emitted from the com- bustion units unless they are removed from the flue gases. These emissions may be in either gas phase, such as SO2, HCl, NOx, dioxins, organic compounds and some trace metals or as particles. Both gas phase and particle emissions need to be removed from the flue gases before the flue gases are emitted to the environment.
In combustion applications, waste materials may be considered as solid fuels. All solid fuels contain ash-forming components that transform during combustion in many ways.
Particle formation during combustion has first been described in pulverized coal com- bustion, where extensive literature covers different particle formation mechanisms [2, 7].
More recently, particle formation mechanisms have also been described in biomass combustion in different boiler types e.g. [5]. The transformations of the ash-forming elements depend on the type of fuel, the form of occurrence of the ash-forming com- pounds in the fuel, combustion technology used, as well as combustion conditions.
For waste fuels, few data are available on the form of occurrence of the ash-forming compounds, partly due to the lack of research in this area, partly because waste fuels have such varied origin and composition [6]. Therefore, it is of no practical value to predict particle formation mechanisms or resulting particle characteristics in waste combustion based on data from other solid fuel combustion processes. Even though the ash formation mechanisms are most likely the same in waste combustion as in other solid fuel combustion processes, their relative importance may be significantly different resulting in distinctly different ash particle characteristics.
In this investigation, we determined experimentally fly ash particle characteristics – particle size, composition and concentration – as well as emissions during waste com- bustion in two plants using different combustion technologies, but similar gas cleaning technology. The two combustion plants were a grate-fired boiler, and a circulating fluid- ized bed boiler. In grate-fired boilers, fuel is fed onto a moving grate where it is ignited and burned. Particle size of the feed fuel may be large; in the case of waste combustion, whole bags of waste are fed onto the grate. The combustion is relatively uneven with areas of high oxygen concentration, and some areas with highly reducing atmospheres.
Dorfstraße 51 D-16816 Nietwerder-Neuruppin Phone: +49.3391-45.45-0 • Fax +49.3391-45.45-10 E-Mail: order@vivis.de Aschen • Schlacken • Stäube
Mineralische Nebenprodukte und Abfälle,Volume 1 – 6
Package Price
350.00 EUR
save 150.00 EUR
TK Verlag GmbH
order now: www. .de Editors: Thomé-Kozmiensky (et al.)
3 Karl J. Thomé-Kozmiensky
MINERALISCHE NEBENPRODUKTE UND ABFÄLLE 2 – Aschen, Schlacken, Stäube und Baurestmassen –
Karl J. Thomé-KozmienskyMineralische Nebenprodukte und Abfälle
2
Thomé-Kozmiensky und VersteylAschen • Schlacken • StäubeThomé-Kozmiensky
Karl J. Thomé-Kozmiensky
Aschen • Schlacken • Stäube
– aus Abfallverbrennung und Metallurgie –
Ash • Slag • Dust Mineral By-Products and Waste
3 Karl J. Thomé-Kozmiensky
MINERALISCHE NEBENPRODUKTE UND ABFÄLLE 3 – Aschen, Schlacken, Stäube und Baurestmassen –
Karl J. Thomé-KozmienskyMineralische Nebenprodukte und Abfälle
3
3
Karl J. Thomé-KozmienskyMineralische Nebenprodukte und Abfälle
4
Karl J. Thomé-Kozmiensky
MINERALISCHE NEBENPRODUKTE UND ABFÄLLE 4 – Aschen, Schlacken, Stäube und Baurestmassen –
2014: Mineralische Nebenprodukte und Abfälle
– Aschen, Schlacken, Stäube und Baurestmassen – ISBN: 978-3-944310-11-4 50.00 EUR 2015: Mineralische Nebenprodukte und Abfälle 2
– Aschen, Schlacken, Stäube und Baurestmassen – ISBN: 978-3-944310-21-3 50.00 EUR 2016: Mineralische Nebenprodukte und Abfälle 3
– Aschen, Schlacken, Stäube und Baurestmassen – ISBN: 978-3-944310-28-2 75.00 EUR 2017: Mineralische Nebenprodukte und Abfälle 4
– Aschen, Schlacken, Stäube und Baurestmassen – ISBN: 978-3-944310-35-0 75.00 EUR 2013: Aschen • Schlacken • Stäube
– aus Abfallverbrennung und Metallurgie – ISBN: 978-3-935317-99-3 50.00 EUR
2018: Mineralische Nebenprodukte und Abfälle 5
– Aschen, Schlacken, Stäube und Baurestmassen – ISBN: 978-3-944310-41-1 100.00 EUR 2019: Mineralische Nebenprodukte und Abfälle 6
– Aschen, Schlacken, Stäube und Baurestmassen – ISBN: 978-3-944310-47-3 100.00 EUR
3
Thiel, Thomé-Kozmiensky,Friedrich, Pretz, Quicker, Senk, WotrubaMineralische Nebenprodukte und Abfälle 5
Thiel • Thomé-Kozmiensky Friedrich • Pretz • Quicker • Senk • Wotruba
MINERALISCHE NEBENPRODUKTE UND ABFÄLLE 5 – Aschen, Schlacken, Stäube und Baurestmassen –
3 MINERALISCHE NEBENPRODUKTE
UND ABFÄLLE 6 – Aschen, Schlacken, Stäube und Baurestmassen –
Thiel • E. Thomé-Kozmiensky Friedrich • Pretz • Quicker • Senk • Wotruba
Mineralische Nebenprodukte und Abfälle
6
Thiel, Thomé-Kozmiensky,Friedrich, Pretz, Quicker, Senk, Wotruba
3 MINERALISCHE NEBENPRODUKTE
UND ABFÄLLE 6 – Aschen, Schlacken, Stäube und Baurestmassen –
Thiel • E. Thomé-Kozmiensky Friedrich • Pretz • Quicker • Senk • Wotruba
Mineralische Nebenprodukte und Abfälle
6
Thiel, Thomé-Kozmiensky,Friedrich, Pretz, Quicker, Senk, Wotruba
hardcover with colored illustrations Mineralische_Nebenprodukte_Aschen-Schlacken-Stäube_Engl.pdf 1 28.08.19 15:46
Incineration Residues
Due to the uneven gas atmosphere, peak temperatures are high in the oxidizing areas, and temperature gradients inside the furnace are large. Quite different from grate-fired boilers, circulating fluidized bed boilers have a uniform temperature due to efficient heat transfer, and the peak temperatures are low. Gas atmosphere varies between oxidizing inside the gas bubbles and reducing in the suspension phase [5].
1.1. Grate fired boilers
The fly ash particles from grate-fired boilers are mainly formed from the ash-forming species that are released to the gas phase during combustion, and that subsequently form particles via gas-to-particle conversion, i.e. nucleation and condensation. A large fraction of the particle mass is in the submicron particle size range [3].
The grate fired waste combustion plant (Plant A1) started operation in autumn 2003 [8].
The plant produces 18 MWth district heating to about 8,000 households and a number of industrial and commercial clients, and 1.7 MW electricity for its own use. The fuel contains 70 % source separated household waste and 30 % presorted industrial waste.
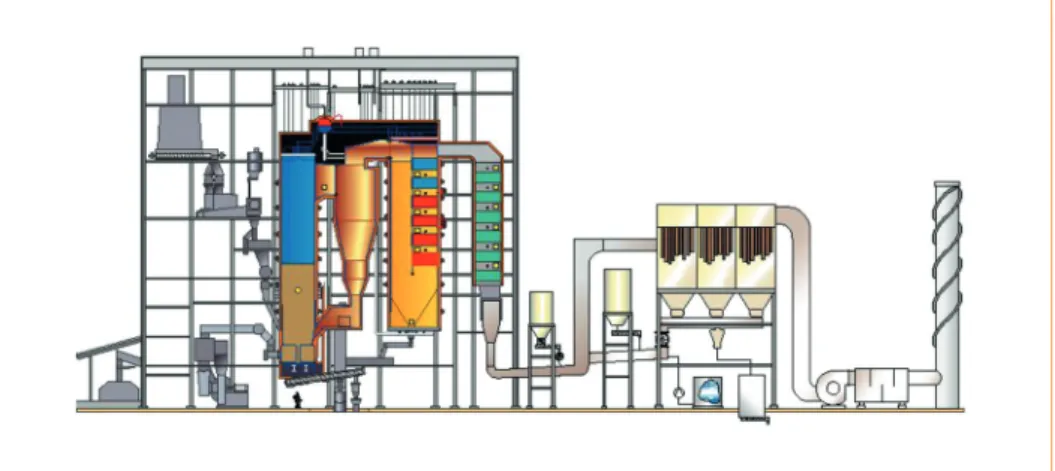
Plant A1 utilises conventional moving grate combustion technology and a novel inte- grated desulphurization (NID), including a fabric filter, for flue gas cleaning (Figure 1).
During our tests, activated carbon was used for Hg and dioxin absorption in NID, and lime feed was used for HCl and SO2 reduction. In order to reduce the nitrogen oxides formed in the combustion process, ammonia solution was fed into the boiler cyclone in a selective non-catalytic reduction (SNCR).
Fine particle and trace element behaviour, and emissions were investigated during a two day measurements campaign. Fine particle measurements were carried out at two locations at the plant, at the fabric filter inlet and at the stack. Total particle and gas emissions were measured at the stack.
1.2. Circulating fluidised boilers
In circulating fluidized bed combustion, typically major fraction of the fly ash particles is found in the so-called coarse particle mode, i.e. particles larger than 1 µm in diameter.
They are formed from the non-volatile ash-forming species. Only a small fraction – typically a few percent – of the fly ash particles are in the submicron particle mode and are formed by nucleation and condensation [4]. The amount of submicron particles formed depends both on the type of fuel used and the combustion technology applied.
The circulating fluidized bed (CFB) boiler (Plant B1) started operation in 2003. The plant is a 75 MWth CFB boiler equipped with NID flue gas cleaning system and an SNCR similar to the ones at Plant A1. Additives were used in the flue gas cleaning systems similar to the Plant A1, i.e., activated carbon for Hg and dioxin absorption, lime for HCl and SO2 reduction, and ammonia for NOx reduction (Figure 2). The boiler comprises several features beneficial for waste combustion unit. The fuel feed- ing is designed especially for optimal distribution of difficult fuels. The two cyclones are cooled, and the final superheating takes place in the heat exchangers located
759 Metal Composition in Waste Combustion Ashes and their Recovery
Incineration Residues
bottom ashfuel samples filter ash particle emissions dioxin/furan gas composition alkaline, TOC
fine particles fine particles (total particles) Figure 1:Flue gas cleaning for the grate boiler at the plant A1
Incineration Residues
in the solids returns. There is vertical empty cooling pass to reduce the flue gas temper- ature before the gas channel superheaters. This feature reduces fouling and corrosion of the heat transfer surfaces.
Figure 2: The Circulating Fluidised Boiler (CFB) for performed measurements
The fuel mix includes a number of different waste fractions, such as mixed and source separated municipal solid waste, industrial waste, rubber chips, and demolition wood waste. During the measurements, the fuel was approximately 30 – 50 % combined household waste and 50 – 70 % classified industrial waste. Silica sand was used as additional bed material.
Fine particle and trace element measurements were carried out during normal plant operation during two days. Like at Plant A1, fine particles were measured at the fabric filter inlet and at the stack. Total particle concentrations were measured with filters at fabric filter inlet and at stack, and gas emissions were measured at the stack.
2. Emissions 2.1. Fuel properties
The fuel composition at the two plants A1 and B1 was relatively similar. Chlorine concentration was high in both fuels, with approximately 1 % Cl in dry solids. Sulphur concentration was about 0.3 – 0.4 % and Na and K concentrations we also high.
Metal concentrations were high in both waste fuels, and despite almost similar ash contents, they were higher in the waste at Plant B1. The quality of the waste fuels varied during the measurements. Particularly, the trace metal concentrations in the fuels showed large variation from one sample to another. Cu content in the waste at Plant B1 was particularly high and had a large variation in the four samples with an average of 4,500 ppm.
761 Metal Composition in Waste Combustion Ashes and their Recovery
Incineration Residues
2.2. Process conditions
Furnace temperature and other combustion conditions were kept as constant as pos- sible during the measurements. At the grate-fired Plant A1, the average lower furnace gas temperature was 800 °C, in the middle of the furnace the temperature was highest at around 1,100 °C, and at the top of the furnace it was 1,030 °C. Temperatures at the fluidized bed boiler at Plant B were more uniform, and maximum temperature lower.
The bed temperature was approximately 850 °C, and the maximum temperature in the upper furnace was 900 °C.
Due to variation in the fuel quality, the gas concentrations had some variations. NID removed both HCl and SO2 effectively. For example, at Plant B1, HCl concentration upstream of NID was approximately 1,000 mg/m3, and it was reduced down to less than 10 mg/m3 at stack. All the measured gaseous emissions at both plants were below the limit values set by European WID.
2.3. Fine fly ash concentrations
The total fly ash particle mass concentration at the fabric filter inlet at Plant A2 was 1.1 – 1.7 g/Nm3. On average, 85 % of the particles were in PM1.0 (PM1.0 is the fraction of particles with aerodynamic diameter below 1.0 µm); the PM1.0 concentration was 1.0 – 1.4 g/Nm3 with average size of 0.6 µm. PM2.5 concentration was 1.1 – 1.6 g/Nm3. All the mass concentration values have been normalized to dry gas with 11 % O2 and NTP conditions.
The total particle mass concentration at Plant B1 at the fabric filter inlet was 4.6 g/Nm3, as determined by filter measurements. Mass concentration as determined with low-pressure impactors was higher at 10 – 15 g/Nm3 due to the measurement location downstream of a bend in the flue gas duct and a subsequent concentration gradient in the duct. This could not be avoided as access to flue gas duct was limited upstream of the fabric filter.
PM1.0 concentration at Plant B1, as determined by low-pressure impactors, was 0.25 – 0.30 g/Nm3; on the average only 7 % of the total particle concentration. PM2.5 concentration was 0.43 – 0.49 g/Nm3. The fine particle concentrations were not affected by the non-uniform concentration field inside the flue gas duct [1]. The average size of the PM1.0 mode was 0.4 µm and smaller than at Plant A1. This was due to lower mass concentration in this particle mode at Plant B1.
The major components in the PM1.0 particles were Na, K, Cl, and SO4. At plant A1, they made up approximately 60 % of the particles mass in PM1.0, and at plant B1, 80 %. In addition, PM1.0 contained 2 % Pb and 8 % Zn at Plant A1, and 5 % Cu and 7 % Pb at Plant B1. The rest of the particle mass in this size range was presumably components that were not analyzed, e.g., silicates and water-insoluble Ca. Al and Fe concentrations in PM1.0 were below 0.5 % of the particle mass.
The concentration of particles larger than PM1.0 was low at plant A1 with only 15 % of the fly ash particles being in this size range. Their composition was similar to the PM1.0 particles. At plant B1, the composition of the particles larger than 1.0 µm was
Incineration Residues
significantly different from PM1.0 particles. The water soluble Na, K, Cl, and SO4 made up only 13 % of the particle mass in particles larger than 1 µm, whereas they made up 80 % of the particle mass in PM1.0. In addition, particles larger than 1 µm contained approximately 11 % Al, and 3 % Fe indicating the presence of alumino-silicates and other minerals in particles in this size range.
Particle emissions from both plants were very low. Total particle emissions as deter- mined by low-pressure impactors from Plant A1 were 0.3 mg/Nm3, and from Plant B1 0.5 – 0.7 mg/Nm3. PM2.5 and PM1.0 emissions were below 0.1 mg/Nm3 at both plants.
The mass concentration at stack was so low that despite long sampling times, collected mass on each impactor stage was only barely above the detection limit, i.e. weighing and handling accuracy of the impactor samples.
2.4. Trace elements
The high trace element concentrations in the waste fuels were reflected in trace element concentrations in fly ash particles at the fabric filter inlet. Especially Cu, Zn and Pb concentrations were very high in the particles. The highest concentrations of these elements were found in PM1.0 particles at Plant B1, with Cu concentration 5.4 % and Pb concentration 7.4 %. At plant A1 Zn concentration was on average 8.2 % in PM1.0 particles.
At plant A1, due to the high PM1.0 concentrations, and relatively low concentrations of particles larger than 1 µm, large fractions of all the fly ash –bound trace elements were found in PM1.0. However, four elements were clearly enriched in PM1.0: Cd, Cu, Pb, Tl and Zn with more than 80 % in PM1.0. At Plant B1, three elements were clearly enriched in PM1.0: Cd, Cu, and Pb with 56, 36, and 62 % of these elements in PM1.0.
Tl concentration in PM1.0 was below the detection limit of the elemental analysis.
0.5 µm
Figure 3:
Electron microscope image of the fine fly ash particles from plant B1; the small black dots were identified as Cu and Pb rich particles by Energy Dispersive X-ray analysis (EDX)
763 Metal Composition in Waste Combustion Ashes and their Recovery
Incineration Residues
Trace element emissions from both plants were very low. Emissions were well below the limit values set by European Waste Incineration Directive (WID); i.e. sum of Cd and Tl below 50 µg/Nm3, and sum of As, Co, Cr, Cu, Mn, Ni, Pb, Sb, and V below 500 µg/Nm3. Hg emissions were divided between particles and gas phase. At plant A1, Hg emission in particles was below the detection limit of the method, and emission in the gas phase was 0.05 µg/Nm3. At Plant B1, Hg emission in particles was 1.5 µg/Nm3, and in gas phase 4.9 µg/Nm3.
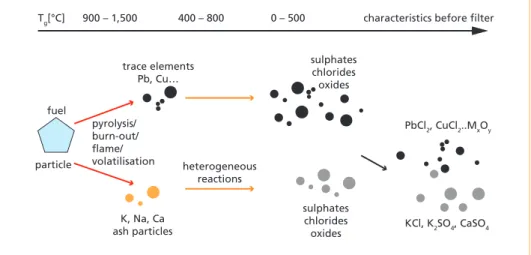
The fly ash particle formation mechanisms are depicted in Figure 4. The PM1.0 frac- tion is formed as K and Na chlorides and sulphates are formed in the gas phase and then homogeneously and heterogeneously condensed to form the fine particles. Later the trace elements condense on the alkali metal particles or they can also form new particles as described in Figures 3 and 4.
trace elements Pb, Cu…
K, Na, Ca ash particles
heterogeneous reactions
Tg[°C] 900 – 1,500 400 – 800 0 – 500 characteristics before filter
sulphates chlorides oxides
PbCl2, CuCl2..MxOy
KCl, K2SO4, CaSO4 sulphates
chlorides oxides pyrolysis/
burn-out/
flame/
volatilisation fuel
particle
Figure 4: Fly ash particle formation mechanisms in waste combustion
3. Ash disposal and utilisation of valuable elements
The fly ash and bottom ash chemical composition from grate combustion plant A1 and circulating fluidised bed combustion plant B1 were compared to other similar boilers located in Finland A2 (grate fired) and B2 (circulating fluidised bed).
In the 220 MW grate fired plant A2 the total amount of waste combusted is annually 960 GWh (340,000 tn waste) and natural gas 650 GWh. The annual production of elec- tricity is 620 GWh and district heat 870 GWh. The amount of bottom ash is 60,000 tn and boiler and fly ash 5,600 tn.
In the 54 MW circulating fluidised bed plant B2 the total amount of waste combusted is annually 145,000 tn. The annual production of electricity is 90 GWh and district heat 180 GWh. The bed and fly ashes collected from plant B2 are presented in Figure 5.
Incineration Residues
bed ash > 2 mm bed ash < 2 mm electrostatic precipitator ash
Fly ash from all plants considered here exceeds the limits of hazardous waste disposal.
Especially chlorine, cadmium, lead copper and zinc. As from emission measurement results we can interpret that major fraction of Cd, Cu and Pb as well as Na and K exist in the fly ash as chlorides and some as sulphates, which are water soluble. Thus large part of the elements are leachable. Zn concentration is high and is one of the elements that could be recovered from fly ash (Table 1 and 2). Another valuable metal is copper that is enriched especially in circulating fluidised bed (CFB) fly ash (B1 and B2) (Table 1).
Pb is enriched in both grate fired and CFB fly ash (Table 1).
Element A1 A2 B1 B2
% w/w
antimony 0.1000 0.0749 0.044 0.03 arsenic 0.0047 0.0068 0.0035 0.003 cadmium 0.0159 0.0136 0.00375 0.0025 chromium 0.0046 0.0477 0.022 0.048 copper 0.0800 0.0707 0.575 0.5 lead 0.2600 0.1346 0.34 0.2 manganese 0.0230 0.0839 0.202 0.11 nickel 0.0012 0.0095 0.0136 0.016 tin n.a. 0.0653 n.a. 0.0135 zinc 1.6800 1.5600 0.85 0.45 bismuth n.a. 0.0016 n.a. 0.002 cobalt 0.0004 0.0038 0.00275 0.004 molybdenum n.a. 0.0032 n.a. 0.0023 vanadium 0.0010 0.0029 0.00425 0.004 sulphur 2.1000 4.2000 n.a n.a chlorine 21.20 6.70 7.10 n.a.
Table 1:
Fly ash metal compositions for power plants A1, A2, B1 and B2 Figure 5: Bed and fly ashes from plant B2
765 Metal Composition in Waste Combustion Ashes and their Recovery
Incineration Residues
In bottom ash the chlorine amount is much smaller as compared to fly ash (Table 2).
Typically bottom ash is washed before the valuable metals are utilised. In the bottom ash of the plant A2 the fine fraction (grain size < 4 mm) is 30 – 40 % of the total bottom ash stream.
Element A1 A2 B1 B2
% w/w
antimony 0.02 0.0072 0.052 0.018 arsenic 0.0024 0.0022 0.005 0.003 cadmium 0.0004 0.0154 0.00068 0.0003 chromium 0.083 0.085 0.0238 0.036 copper 0.6 0.42 0.638 0.2367 lead 0.17 0.0933 0.135 0.0275 manganese 0.15 0.3668 0.07775 0.055 nickel 0.04 0.0862 0.007 0.012 tin n.a. 0.0168 n.a. 0.01 zinc 0.36 0.61 0.445 0.18 bismuth n.a. 0.0002 n.a. 0.0009 cobalt 0.0029 0.0174 0.00135 0.0018 molybdenum n.a. 0.0017 n.a. 0.0014 vanadium 0.0075 0.0036 0.0033 0.0033 chlorine 0.40 0.30 0.02 0.03
Table 2:
Bottom ash metal compositions for power plants A1, A2, B1 and B2
The most valuable metals to be recovered from bottom ash of plants A and B are copper and zinc. There are several processes that can be applied to recover metals from the fine ash powder like leaching with acids, hydrometallurgical and pyrometallurgical process- es. We have developed a thermal treatment method by which we are able to recover all components from the WtE fly ash to useful end products described schematically in Figure 6. The released fraction can be divided e.g. into road salt (NaCl, KCl) and nano zinc powder. The residual powder after thermal treatment in various conditions is good for catalyst and water purification applications.
Figure 6:
Fly ash utilisation in the Metal- circ Ltd. thermal treatment process
Fly ash and bottom ash Si, Ca, Al, Cl, Cd, Zn, Na, K,
Fe, Co, Ni, V…
Released Cl, Cd, Zn, Na, K
Residue Si, Ca, Al, Fe, Co, Ni, V…
End products from Zn E.g. cosmetics, paints, sensors…
Catalysts or water treatment chemicals
Si, Ca, Al Fe, Co, Ni, V…
Thermal treatment
Grinding and heat treatment
Schematic picture of waste combustion
ash thermal treatment process
Incineration Residues
4. References
[1] Brockmann, J.E.: Sampling and transport of aerosols. In: Aerosol Measurement: Principles, Tech- niques, and Applications (Willeke and Baron, eds). Wiley, 1993.
[2] Flagan, R.C.; Seinfeld, J.H. (1988) Fundamentals of air pollution engineering. Prentice Hall, New Jersey. 1988, pp. 1-363.
[3] Jöller, M.; Brunner, T.; Obernberger, I.: Energy & Fuels, 19, 2005, pp. 311-323.
[4] Lind, T.; Valmari, T.; Kauppinen, E.; Nilsson, K.; Sfiris, G.; Maenhaut, W.: Ash formation mecha- nisms during combustion of wood in circulating fluidized beds. Proceedings of the Combustion Institute, 2000, vol. 28, pp. 2287-2295.
[5] Nussbaumer, T.: Combustion and co-combustion of biomass: Fundamentals, Technologies, and primary measures for emission reduction. Energy & Fuels, 2003, vol. 17, pp. 1510-1521.
[6] Ollila, H.J.; Moilanen, A.; Tiainen, M.S.; Laitinen, R.S.: SEM-EDS characterization of inorganic material in refuse-derived fuels. Fuel, 2006, vol. 85(17-18), pp. 2586-2592.
[7] Senior, C.L.; Helble, J.J.; Sarofim, A.F.: Emissions of mercury, trace elements, and fine particles from stationary combustion sources. Fuel Proc. Technol., 2000, 65-66, pp. 263-288.
[8] Wilen, C.; Moilanen, A.; Hokkinen, J.; Jokiniemi, J.: Fine particle emissions of waste inceneration, Project Report, Prepared for IEA Bioenergy agreement task 36, 15.03.2007.
Contact Person
Professor Ph.D. Jorma Jokiniemi University of Easter Finland Laboratory Director
Fine Particle and Aerosol Technology Yliopistonranta 1
70211 Kuopio FINLAND +358 405050668 jorma.jokiniemi@uef.fi MetalCirc Ltd.
Co-founder and Chairman of the Board Kivivuorentie 4 A 65
01620 Vantaa FINLAND +358 405050668
jorma.jokiniemi@metalcirc.com
Vorwort
4
Bibliografische Information der Deutschen Nationalbibliothek Die Deutsche Nationalbibliothek verzeichnet diese Publikation in der Deutschen Nationalbibliografie; detaillierte bibliografische Daten sind im Internet über http://dnb.dnb.de abrufbar
Thiel, S.; Thomé-Kozmiensky, E.; Winter, F.; Juchelková, D. (Eds.):
Waste Management, Volume 9 – Waste-to-Energy –
ISBN 978-3-944310-48-0 Thomé-Kozmiensky Verlag GmbH
Copyright: Elisabeth Thomé-Kozmiensky, M.Sc., Dr.-Ing. Stephanie Thiel All rights reserved
Publisher: Thomé-Kozmiensky Verlag GmbH • Neuruppin 2019 Editorial office: Dr.-Ing. Stephanie Thiel, Elisabeth Thomé-Kozmiensky, M.Sc.
Layout: Claudia Naumann-Deppe, Janin Burbott-Seidel, Sarah Pietsch, Ginette Teske, Roland Richter, Cordula Müller, Gabi Spiegel Printing: Universal Medien GmbH, Munich
This work is protected by copyright. The rights founded by this, particularly those of translation, reprinting, lecturing, extraction of illustrations and tables, broadcasting, micro- filming or reproduction by other means and storing in a retrieval system, remain reserved, even for exploitation only of excerpts. Reproduction of this work or of part of this work, also in individual cases, is only permissible within the limits of the legal provisions of the copyright law of the Federal Republic of Germany from 9 September 1965 in the currently valid revision. There is a fundamental duty to pay for this. Infringements are subject to the penal provisions of the copyright law.
The repeating of commonly used names, trade names, goods descriptions etc. in this work does not permit, even without specific mention, the assumption that such names are to be considered free under the terms of the law concerning goods descriptions and trade mark protection and can thus be used by anyone.
Should reference be made in this work, directly or indirectly, to laws, regulations or guide- lines, e.g. DIN, VDI, VDE, VGB, or these are quoted from, then the publisher cannot ac- cept any guarantee for correctness, completeness or currency. It is recommended to refer to the complete regulations or guidelines in their currently valid versions if required for ones own work.