Report No. 30
South Asia Human Development Sector
How do Government and Private Schools Differ?
Findings from two large Indian states
December 2009
Discussion Paper Series
Public Disclosure AuthorizedPublic Disclosure AuthorizedPublic Disclosure AuthorizedPublic Disclosure Authorized
52634
How do Government and Private Schools Differ?
Findings from two large Indian states
Sangeeta Goyal and Priyanka Pandey
South Asia Human Development, World Bank. We gratefully acknowledge generous financial support from the EPDF trust fund for this work. We thank Samuel Carlson, Amit Dar, Lant Pritchett, Michelle Riboud and James Tooley for very helpful comments.
Table of Contents
Abstract ... i
1. Introduction ... 1
2. Background ... 3
3. Data and Empirical Methods ... 4
3.1 The Tests ... 7
4. Learning Decomposition ... 8
4.1 Unadjusted test scores ... 8
4.2 How do test scores vary with within and across schools? ... 9
4.3 Which child, family, teacher and school characteristics are correlated with learning outcomes? ... 11
4.4 Is there a private school effect? ... 11
5. Where do government and private schools differ? ... 13
5.1 Socio-economic composition of students in government and private schools ... 14
5.2 School Inputs ... 15
5.3 How do teachers differ across school types? ... 16
5.3.1 Teacher profile ... 16
5.3.2 Teacher Effort ... 17
5.3.3 Variation in teacher effort between and within schools ... 19
5.3.4 Are teachers rewarded for their effort differently in government and private sectors? 20 6. Discussion and Policy Implications ... 21
Appendix A ... 24
Appendix B ... 45
i
Abstract
This paper uses survey data from representative samples of government and private schools in two states of India, Uttar Pradesh and Madhya Pradesh, to explore systematic differences between the two school types. We find that private school students have higher test scores than government school students. However, in both private and government schools the overall quality is low and learning gains from one grade to the next are small. There is large variation in the quality of both school types; and observed school and teacher characteristics are weakly correlated with learning outcomes. There is considerable sorting among students, and those from higher socio-economic strata select into private schools. Private schools have lower pupil-teacher ratios and seven to eight times lower teacher salaries but do not differ systematically in infrastructure and teacher effort from government schools. Most of the variation in teacher effort is within schools and is weakly correlated with observed teacher characteristics such as education, training, experience. After controlling for observed student and school characteristics, the private school advantage over government schools in test scores varies by state, school type and grade. Private unrecognized schools do better than private recognized schools. Given the large salary differential, private schools would clearly be more cost effective even in the case of no absolute difference in test scores.
1
1. Introduction
1. Private schools offering primary education have grown at a rapid rate in India.
According to a recent survey, 25% of all enrolment in primary education in India is in private schools (SRI, 2005). Attendance in these schools is not limited to the non- poor or people in urban areas. This rapidly expanding sector includes a large number of low fees charging schools and data suggest nearly 30% of villages in India have access to a private school within the village itself (Kremer and Muralidharan, 2006;
De et al. 2002). Poor parents clearly reveal their aspiration, preference and choice when they incur considerable expenditure to send a child to a private school. In a private school, parents spend money on various fees, uniforms and textbooks, all of which are free in a government school.
2. Poor quality of education in government schools is widely reported as the major reason for the rapid growth of the private school sector. Private schools are generally perceived to be more accountable and offering better quality education. The Probe Report (1999) notes that “In a private school, the teachers are accountable to the manager (who can fire them), and, through him or her, to the parents (who can withdraw their children). In a government school the chain of accountability is much weaker, as teachers have a permanent job with salaries and promotions unrelated to performance. This contrast is perceived with crystal clarity by the vast majority of parents.”
3. Evidence from a slew of surveys in a number of developing countries including India show that learning outcomes of students in private schools, as measured by test scores, is on the average better than government schools. In most of these studies, the private school advantage remains even after controlling for a large set of observable child, family, school and teacher characteristics (LEAPS, 2007; Goyal 2006a and b;
Kremer and Muralidharan, 2006; Tooley and Dixon, 2006; Kingdon, 1996a and b).
4. The above has led to a strong debate on the relative merits of government versus private schools. It is argued that the government school system is expensive and wasteful and fails in imparting even minimum skills to students; private schools not only do better but also provide learning at a much lower unit cost (Tooley and Dixon, 2006). There is a clear need for reforming the government school system. The set of reforms advocated range in focus from making teachers and schools accountable for performance (using sticks or carrots or both) to making government schools compete for students with private schools (for example, by giving students vouchers to be used in a school of their choice).
5. While there is a strong case to be made for reforming the government school system, it is important to note that the evidence on private schools comes mostly from studies (including ours) based on data that show correlation and not causation between school type and outcomes. Any private school effect cannot simply be attributed to the school if students select into schools. However with lower per student cost private schools will still have a cost advantage.
2
6. Given that the public sector will continue to be the largest provider of elementary education in India, and more reform is expected in this sector in the time to come, the motivation for this work is therefore the question: „how can the public sector create a culture of performance, perhaps similar to that which exists in the performing private and public sector of many countries and what, if anything, can it learn from the private sector in order to do so‟. We use data collected on test scores, child and family and school and teacher characteristics from representative samples of government and private schools in two large states of India, Uttar Pradesh and Madhya Pradesh, to explore systematically the differences between the two school types. Both these states have historically lagged in terms of educational outcomes compared to the Indian average (literacy rate according to the 2001 census – 65.4%).
Madhya Pradesh (literacy rate 2001 - 63.7 %) to its credit has taken long strides to improve in the last two and a half decades; in Uttar Pradesh (literacy rate 2001 – 56.3
%) the pace of improvement continues to be slow.
7. Table 1 shows the penetration of private schools (in the elementary education sector) in the two states based on data from the District Information System for Education (DISE) data for 2006-07. From the table, it is evident that there is considerable presence of private schools in both the states overall and in the rural areas. In both states, more than a quarter of all school enrolment is in the private sector, and more than half of this enrolment is in the rural areas.
Table 1: Private Schools and Enrolment in Madhya Pradesh and Uttar Pradesh DISE 2006-07
Private Schools (%)
Private School Enrolment (%)
Private School Enrolment Rural (%)
Private School PTR (Government School PTR) Madhya
Pradesh 16 27 15 32 (41)
Uttar Pradesh 24 28 24 53 (53)
8. Based on a comparison of mean test scores in our data, we find that private school students do better than government school students, a finding that is consistent with other studies on government and private school outcomes. However the overall quality is low in both government and private schools as reflected by low average scores for both school types. Not only quality is low at a given grade, learning gains from one grade to the next are small for both school types. There is also large variation in the quality of both private and government schools. About half the variation in test scores is between schools and the remaining is within schools, similar to what other studies in India find (Pandey et al. 2008, Goyal 2006a and b). And observed school and teacher characteristics account for little of the variation in quality between schools.
9. Once we control for child and family background characteristics and school characteristics, whether there is a significant private school advantage in test scores varies by state, school type and grade. Private unrecognized schools do equally well or better than private recognized schools. This is unlike the findings from studies on other states of India (and even other developing countries) where a significant private school advantage remains almost always, after controlling for sample characteristics.
3
As our data is non-experimental in nature, we cannot make any claims about which of these individual factors are causing the loss of the private school advantage in some cases.
10. Instead we are able to compare mean differences in factors that may matter for learning across school types. We find that socio-economic characteristics of students and their families, such as caste, gender, parental literacy and household wealth favor private schools in both states with the implication that there is considerable sorting of students between the school types, and this is likely to be one source of the private school advantage. Other sources of private school advantage lie in lower pupil teacher ratios and substantially lower teacher salaries. Teacher effort is similar across school types, except in private unrecognized schools in Uttar Pradesh that have higher teacher activity. Teachers in private schools are younger, less likely to be trained and have fewer years of experience. Most of the variation in teachers‟ effort is within schools and is weakly correlated with observed teacher characteristics such as education, training, experience. This holds for both school types and is consistent with another recent study in the same states (Pandey et. al, 2008).
11. The paper is structured as follows. The second section sets the context for the motivation for this study and its findings. In section 3, data description and sampling methodology followed for data collection is described. Section 4 sets out the learning outcomes and the analysis of the sources of variation in learning outcomes and their correlates. Section 5 provides an analysis of differences in mean characteristics of government and private schools in terms of student and family characteristics, school and teacher characteristics. Section 6 discusses and concludes.
2. Background
12. Casual and more systematic observation, both are pessimistic about learning achievements in government schools in India. Most studies find that even after four and five years of schooling, many children do not acquire the basic skills in literacy and numeracy (Pandey et al, 2008; ASER 2005, 2006, 2007; PROBE 1999).
13. Many reasons have been put forward for the poor quality education in primary schools owned and run by the government. Earlier studies considered poor school resources and the poverty and illiteracy of parents as the prime reasons. Recent research has looked at teacher motivation and its impact on students‟ learning, and many of these studies have highlighted the pervasiveness of the phenomenon of teacher absence and inactivity in government schools.
14. With the rising numbers of schools in the private schools, researchers have also focused attention on the relative learning achievements across government and private schools. On raw scores alone, in most studies, it would be true that private schools have a distinct advantage over government schools. However, it is not clear how much of this advantage remains once a number of other characteristics – child, teacher and school related that also matter for learning achievements, are controlled for. Based on a survey in urban and semi-urban areas of Hyderabad in south India, Tooley and Dixon (2003, 2006) find that private primary school children, including
4
those in unrecognized schools, outperform government children. The size of the difference falls substantially when background variables are controlled for but the difference continues to be significant. A study of rural primary schools in Punjab province of Pakistan finds that after adjusting for school and student characteristics, significant differences remain in test scores between government and private schools (LEAPS, 2007). Similar results are found for schools in the Indian states of Orissa and Rajasthan (Goyal 2006a; Goyal, 2006b). Some of these studies also find large variation in scores within each school category, whether government or private which implies there are good and bad schools within any particular type of school (Goyal 2006a, 2006b).
15. Some of the sources of private school advantage lie in lower pupil teacher ratios, teachers with greater accountability and lower teacher salaries. This is supported by the above cited work that finds: a. private schools have higher teacher attendance and activity compared to government schools b. private school teachers get a fraction of the salary of government school teachers, and c. private schools have smaller class sizes (LEAPS 2007; Goyal 2006a and 2006b; Kremer and Muralidharan 2006;
Tooley and Dixon, 2006; Kingdon1996a and b).
16. We would like to note here that the difference in mean scores of government and private even after adjusting for observed variables cannot be attributed as a causal effect of school type. As is well known, even in studies that have information on measurable student characteristics, an important issue in identifying the impact of school type on student achievement is that students may select school type based on unobserved characteristics such as ability or parental motivation. If more able or more highly motivated students go to private schools then any private school achievement advantage over government schools, after controlling for observed student and family characteristics, cannot be attributed to school-type. To have clean impact evaluation, one needs either a randomized experiment with students randomly assigned to private or government schools, or a convincing way of dealing with endogenous sample selection into private or government schools. There are no randomized experiments available in India so far to measure the relative performance of private and government schools. In non-experimental data, it is difficult to find convincing instruments that can be used to correct for the bias arising from self selection into schools.
3. Data and Empirical Methods
17. Data for this study come from school surveys conducted in the states of Madhya Pradesh and Uttar Pradesh in India between November 2006 and February 2007. Six districts were selected in each state, covering every geographical region of the state as defined by the National sample survey organization (NSSO) of India. Madhya Pradesh is divided into six geographical regions, South, South Western, Northern, Vindhya, Central and Malwa. These six regions are roughly even in the number of districts, each with 6 to 10 districts. One district was randomly selected from each of these regions. Uttar Pradesh is divided into four geographical regions, Eastern, Western, Central and Southern. The eastern and western regions have more than twice as many districts (26-28 districts in each) as in the other two regions (8-10 in
5
each). Given the unequal sizes of regions, two districts from each of the two larger regions and one from each of the two smaller regions were randomly selected.
18. In each district, two blocks were randomly selected and in each block six gram panchayats and urban wards were randomly selected.1 The ratio of urban wards and gram panchayats were kept the same as the ratio of urban and rural population in the state. All primary schools, government or private, were surveyed in each gram panchayat and urban ward in the sample. Fifteen students randomly selected from each of the grades 4 and 5 in the sample schools were tested in language and mathematics. Random selection was done using school registers. As an example, if there were 60 students, then the first student in the list was randomly picked using a random number list created from a random number generator and every fourth student from the first student (60/15) was picked. If boys and girls were separately listed in the register, a list of all students was created appending one list below another and random selection was done using the above technique i.e., the first name was randomly selected and then every nth student picked (n being class size divided by 15) . This ensured that the proportion of boys and girls in the selected sample was similar to that in the class. If the class had less than 15 students then all were included in the sample. Alongside test scores, data on school and teacher characteristics were also collected. Data on sample students and their family background were collected from parent interviews conducted in their homes in the presence of the child.
19. Data on teacher attendance and activity were collected by making three unannounced visits to each school. In each visit field investigators recorded whether the teacher was present in school and what they were doing at the time of the visit, if they were present in school. Teacher activity is constructed as 1 if teacher is teaching, writing on the board, supervising written work, teaching by rote, 0 if teacher is absent, chatting, sitting idle/standing outside classroom, keeping order in classroom but not teaching, doing other non teaching work. Although we have data on all teachers teaching grades one to five, as multi grade teaching is widespread in the sample, we use school level averages of teacher attendance and activity in the analysis.
20. Types of schools: There are three types of private schools that exist in India. There are private aided and private unaided schools. Private aided schools are privately managed, but have teacher salaries and other expenses funded by government. Their teachers are paid at government-teacher salary rates directly from the state government treasury and are recruited by a government-appointed Education Service Commission rather than by the school. Private unaided schools are entirely privately managed and privately funded, and are of two types, recognized and unrecognized.
These schools run entirely on revenue from fees.
21. To understand the real dimension of the private education sector in India, the distinction between recognized and unrecognized schools is important. While
1 A gram panchayat is the lowest administrative unit in rural areas consisting of two to three revenue villages on average. The elected village government is formed at the gram panchayat level. The lowest administrative unit in urban areas is an urban ward. A block is an administrative unit between a district and a gram panchayat/urban ward.
6
government educational data collection exercises are intended to be a census of all schools in the country, they cover the recognized schools and do not cover the unrecognized private schools. The recognized schools have met the regulatory requirements of the state, while unrecognized schools have either not applied for, or have not succeeded in gaining, recognition. 2 Students from private unrecognized schools cannot appear for any state or central examinations. In reality, many recognized private schools may not fulfill all the conditions of recognition (Kingdon, 1994).
22. Because we sampled all schools in the selected gram panchayats and urban wards, our sample has four types of schools: government schools, private aided schools, private unaided recognized schools and private unaided unrecognized schools. In Madhya Pradesh, there were no private unaided unrecognized schools in the sampled gram panchayats or urban wards.
23. To find all the schools in any location, the field teams were briefed thoroughly on how to identify and classify different school types. In every village or urban ward, the team sat down with the village head (gram pradhan) and few other people who knew the village well to make a list of schools in each neighborhood of the village. They then visited each neighborhood to check the list of schools. The field teams in Madhya Pradesh did not find any private unrecognized schools in any of the locations they visited. All six teams in the state, each of which went to a separate district, found
„zero‟ unrecognized schools. On further probing it came out that in MP, all schools which have up to grade 5 have to have a registration number at least. This registration number is not unique to schools but unique to an umbrella organization like an NGO/trust/society. Because of this, schools up to grade 5 are perceived as recognized by the villagers but may no necessarily be so. The distinction between recognized and unrecognized schools in MP is therefore blurred or ambiguous and this should be kept in mind when interpreting the results.
24. Descriptive statistics of the sample are provided in the appendix (Tables A.1.- A.5.).
Private aided schools are a very small fraction of schools in the sample. For this reason, school level results presented by school type do not report on private aided schools everywhere. Student and teacher level analyses include private aided schools but results on these school types are not reported since the number of observations is small.3
25. The statistical strategy employed in this paper is that of multivariate regression analysis using the Ordinary Least Squares model. Standard errors in the regressions are clustered at the school or block level as appropriate, unless stated otherwise.
2 In the Uttar Pradesh, a recognized school must be a registered society, have an owned rather than a rented building, employ only trained teachers, pay salaries to staff according to government prescribed norms, have classrooms of a specified minimum size and charge only government-set fee rates (Kingdon, 1994).
3 We did a check by doing the analyses both with and without private aided schools. The results stay similar in both cases.
7 3.1 The Tests
26. The tests used for the study were based on the National Council of Educational Research and Training (NCERT) tests for grade 4 in language and mathematics. The language tested is Hindi which is the language in use in both states. The mathematics test was administered in Hindi language but the numerals used were Arabic (0,1,2,3…) as is the practice. When piloting the tests in rural private and public schools in both states, we had found that students were being taught mathematics in Hindi.
27. All the tests were in the multiple choice format. Both grades 4 and 5 students in the sample took the same test.
28. Reading Comprehension Test: The test consisted of 34 items aimed at assessing the student‟s ability to understand the meaning of words and sentences and to identify ideas from paragraphs and answer questions.
29. Word Meaning Test: The test consisted of 35 items aimed at assessing the student‟s ability to identify synonyms and antonyms.
30. Mathematics Test: The test consisted of 33 items aimed at assessing the students‟
ability to do simple additions, subtractions, multiplications, fractions and area and weight analysis.
31. The test items correspond to competencies that children are expected to have mastered by the end of grade 4. As an example, a description of specific test items is in appendix B.4
4One of the attractions to parents of low cost private schools is that they are supposedly English-medium, and may teach English at a much earlier stage than government schools. If this is the case, then not testing in English can likely skew the results in favor of government schools. This, however, is unlikely given our findings during the pilot that students in both types of schools were being taught in Hindi. Also, English is not taught as a language in early grades in government schools in UP and MP. Even if we did such a test, it would not be meaningful in this context.
8
4. Learning Decomposition
4.1 Unadjusted test scores
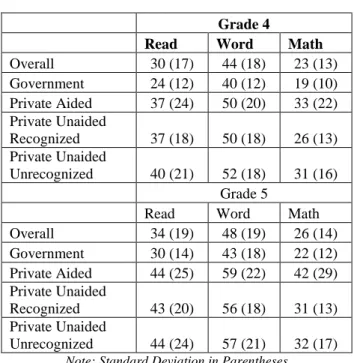
32. The raw means of test scores, overall and by type of school management, for the two states are set out in Tables 2 and 3. Each child‟s score on a test is the number of questions he or she answered correctly converted into a percentage for that test. The results set out in the table are not very encouraging for a number of reasons:
(a) The scores are low in absolute terms and certainly much lower than 60% which is the government‟s own indicator for a child‟s acceptable level of competency on a test, and is used as a threshold for reporting in official reports.
(b) The questions in the test papers were of the multiple choice format, and in general each question had four or five options to choose the answer from. Therefore, even if a child was randomly guessing the answer, he or she can score an average of 20-25%
points without having any real knowledge. Given these low scores and accounting for guessing would imply very little true learning.
(c) The standard deviations of the test scores, which are shown in parentheses in each cell of the table next to the mean scores, are very high. In most cases the standard deviation is half the mean. Such high variation implies that there are a few students who do exceedingly well but the majority of students perform poorly.
(d) If we were to take the differences between the mean scores between grades 5 and 4 as an indictor of average gain in learning between the two grades, then again the results are poor. The mean gain is only about 3-4 percentage points in each subject. Not only is this a very low rate of learning per year, the variation in test scores also increases which perhaps implies a further pulling away of the top scorers with little improvement in the test scores of the majority who continue to score poorly.
(e) In the Appendix, we provide the distribution of scores by percentile, overall and by type of school management for both grades, all three tests and for both states. In all cases, the distribution of scores of government schools is to the left of private schools.
Learning is poor in all school types. If we take scoring 50-60% on a test as a bench- mark of acceptable levels of learning (NCERT uses 60%), government schools in both states achieve this standard somewhere between the 90th and 95th percentile, whereas private schools do so between the 75th and 90th percentile.
9
Table 2: Mean Scores, Uttar Pradesh Grade 4
Read Word Math
Overall 30 (17) 44 (18) 23 (13)
Government 24 (12) 40 (12) 19 (10) Private Aided 37 (24) 50 (20) 33 (22) Private Unaided
Recognized 37 (18) 50 (18) 26 (13) Private Unaided
Unrecognized 40 (21) 52 (18) 31 (16)
Grade 5
Read Word Math
Overall 34 (19) 48 (19) 26 (14)
Government 30 (14) 43 (18) 22 (12) Private Aided 44 (25) 59 (22) 42 (29) Private Unaided
Recognized 43 (20) 56 (18) 31 (13) Private Unaided
Unrecognized 44 (24) 57 (21) 32 (17) Note: Standard Deviation in Parentheses
Table 3: Mean Scores, Madhya Pradesh Grade 4
Read Word Math
Overall 30 (21) 42 (22) 25 (17)
Government 24 (18) 38 (22) 21 (15) Private Aided 25 (8) 49 (12) 18 (6) Private Unaided 40 (21) 49 (22) 32 (17)
Grade 5
Read Word Math
Overall 36 (22) 47 (23) 29 (17)
Government 30 (18) 45 (22) 25 (15) Private Aided 40 (14) 56 (17) 27 (15) Private Unaided 48 (24) 54 (23) 37 (18)
Note: Standard Deviation in Parentheses
4.2 How do test scores vary with within and across schools?
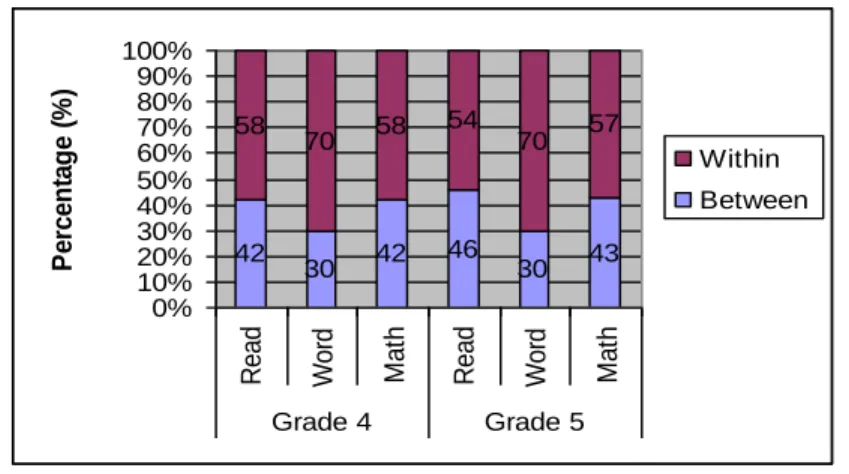
33. The total variation in test scores is the sum of variation arising due to differences between schools and variation within schools. What share each source of variation contributes can be computed using ordinary least squares regression analysis with test scores as the dependent variable and the school attended as the only independent variable. The amount of variation „explained‟ in this case is the share of the variation coming from differences between schools. The remaining (out of 100 percent) is that due to sources of differences within schools (i.e. what happens if all the schools were identical). For the two states, these sources of variation are shown graphically in the two figures below.
10
Figure 1: Within and Between School Variations in Test Scores, Uttar Pradesh
34. In Uttar Pradesh differences between schools account for a maximum of 56% of the variation in test scores; and in Madhya Pradesh a maximum of 46%. In both states, between school differences are more strongly correlated to test scores in reading comprehension and math. We also repeated the above analysis separately by school type. The results (not shown) are not very different from those of the overall sample.
This was true for both states. The implication of this finding is notable: there are good and bad schools within all types of school management.
35. These findings are consistent with the findings of other studies on education quality for Uttar Pradesh and Madhya Pradesh (Pandey et al, 2008). Between school differences are correlated with 5-10 percentage points greater variation in test scores in Rajasthan and Orissa, two other states of India which lag in terms of education outcomes (Goyal, 2006a; Goyal 2006b). In contrast, a study from Pakistan shows that differences between schools explain almost all the difference in test scores (LEAPS, 2007).
36. From the above analysis it is clear that school quality differences matter. Equally, differences across students keeping school quality constant also have a considerable association with test scores. From the point of view of policy, there is opportunity for improving education outcomes both by pursuing polices that improve school quality and also policies that are directed towards students.
Figure 2: Within and Between School Variations in Test Scores, Madhya Pradesh 53
35
55 53 34
56 47 65 45 47
66 44
0%
10%
20%
30%
40%
50%
60%
70%
80%
90%
100%
Read Word Math Read Word Math
Grade 4 Grade 5
Percentage (%)
Within Between
42 30 42 46
30 43 58 70 58 54
70 57
0%
10%
20%
30%
40%
50%
60%
70%
80%
90%
100%
Read Word Math Read Word Math
Grade 4 Grade 5
Percentage (%)
Within Between
11
4.3 Which child, family, teacher and school characteristics are correlated with learning outcomes?
37. Few observable characteristics of the child and family background and school have any robust significant correlation with learning outcomes. By robust we mean those factors that are generally associated with higher or lower scores irrespective of subject or grade. In Uttar Pradesh, a child who has attended pre-school and receives free textbooks has higher scores in grade 4. Children in schools with a higher share of teachers with less than high school qualifications have lower scores in grade 4. Other school and teacher characteristics such as infrastructure or share of teachers with training are not significantly correlated with test scores. In Madhya Pradesh, counter- intuitively, a child in a school with better infrastructure has lower scores. Other characteristics are not significantly correlated.
4.4 Is there a private school effect?
38. There is considerable variation in the quality of private schools of all types, as much as there is among government schools. We can reinforce this insight by analyzing whether there is a statistically significant private school effect before and after controlling for differences arising out of child and family background characteristics and observable and measurable characteristics of the school. In Tables 4 (Uttar Pradesh) and 5 (Madhya Pradesh) below we show the unadjusted and adjusted difference in mean test scores between private and government schools for each test and grade. While the unadjusted mean differences are the mean private school test scores subtracted from the government school scores, the adjusted mean differences in test scores are the remainder effect of the private school type after keeping constant a set of controls. Scores have been adjusted using two models: (a) the model uses as controls child and family background characteristics, a set of school characteristics, the district in which the school is located and whether the school is a rural or an urban school5; and (b) same as the first one except the district and rural location are replaced with the village of location. The full set of regression results are provided in the appendix (Tables A.8.a, A.8.b for Uttar Pradesh, and Tables A.8.c, A.8.d. for Madhya Pradesh)
39. The remainder which is the effect of the school type is not totally unbiased because there is the likelihood of systematic selection into various types of school that is correlated with unobserved children and family background characteristics. If more able or more motivated students select private schools then any private school advantage over government schools in test score, after controlling for observed student and school characteristics, cannot be simply attributed to school-type. In fact, as we will see later, there are strong reasons to believe that „better‟ students attend private schools in Uttar Pradesh and Madhya Pradesh and this may be partly responsible for the higher average private school test scores. To obtain an unbiased private school estimate when selection is going on in the data, one needs a way to
5 Child and family background characteristics included as controls are child‟s age, gender and caste, sibling size, whether the child takes private tuition or not, mother‟s and father‟s education levels, father‟s
occupation, and land ownership. School characteristics included as controls are infrastructure, mid-day meal provision, free textbook provision, and average teacher characteristics at the school level – female, education level, training and experience.
12
correct for selection bias. In the commonly used parametric approach of Heckman‟s selection model, one needs either to rely heavily on distributional assumptions about the error terms in the selection equation and outcome of interest equation, or a valid instrument which belongs in the selection equation but not in the outcome of interest equation. Since we do not have a convincing instrument, we do not correct for the selection bias. Distance to school is commonly suggested as an instrument in the literature on schooling outcomes. But distance to school also suffers from selectivity bias. More motivated parents may be willing to send their children to a school located further.
Table 4: Difference between private and government schools (private-government), Uttar Pradesh Grade 4
Private Unaided Recognized
Private Unaided Unrecognized
Read
Unadjusted 13** 16**
Adjusteda 3.38 9.47
Adjustedb 9.68 16.17*
Word
Unadjusted 11** 12**
Adjusteda 0.95 2.90
Adjustedb 22.06** 27.04**
Math
Unadjusted 7** 11**
Adjusteda 1.36 7.24
Adjustedb 3.64 6.67
Grade 5
Private Unaided Recognized
Private Unaided Unrecognized
Read
Unadjusted 15** 16**
Adjusteda 13.16* 17.49*
Adjustedb 26.64** 33.40**
Word
Unadjusted 13** 13**
Adjusteda 14.07** 16*
Adjustedb 31.64** 36.57**
Math
Unadjusted 9** 11**
Adjusteda 7.20 11.1*
Adjustedb 24.34** 28.69**
5% significance level; ** 1% significance level
aControls + District FE + rural dummy
b Controls + Village FE
Table 5: Difference between private and government schools (private-government), Madhya Pradesh
Grade 4 Private Unaided Recognized
Read
Unadjusted 17**
Adjusteda 8.33
Adjustedb 0.95
Word
Unadjusted 11**
Adjusteda 7.45
Adjustedb 3.32
Math
Unadjusted 11**
Adjusteda 8.20*
Adjustedb -0.83
Grade 5 Private Unaided Recognized
13
Read
Unadjusted 18**
Adjusteda 14.2**
Adjustedb 9.52
Word
Unadjusted 9**
Adjusteda 9.83*
Adjustedb 17.44
Math
Unadjusted 12**
Adjusteda 11.35**
Adjustedb 4.47
5% significance level; ** 1% significance level
aControls + District FE + rural dummy Controls + Village FE
40. In both states, without adjusting there is a significant private school effect in every test and grade. Once controls are included in the regressions, results change. The advantage varies by state, type of private school and grade. In Uttar Pradesh, private schools have an advantage in grade 5, after controlling for other factors. Private unrecognized schools outperform private recognized schools in having a greater number of significant differences and larger magnitudes of differences from government schools. In Madhya Pradesh, there is no robust private school advantage in either grade.
41. In an ideal situation, we would like to know which factors once controlled for remove the advantage private schools seem to confer when we only look at unadjusted averages. However because of the data being cross-sectional, it is not possible for us to do so. Which individual factor (or set of factors) is responsible for bridging the gap between government and private schools can be identified only if we have experimental data where the different factors are provided to schools in a randomized manner; or where we have data which allow us to build into the model the mechanism by which factors are distributed across types of schools. Neither is a possibility with the current data.
42. What we can do instead is to look at the mean differences in these characteristics across government and private schools and see whether they favor one school type or another. This is reported in the following section.
5. Where do government and private schools differ?
43. In this section, we present unadjusted and adjusted mean differences in the socio- economic composition of the student body, school and teacher characteristics between government and private schools. We use two models to adjust the means. In the first model we control for the district of location of the school and whether the school is rural or not. In the second model we adjust for the village in which the school is located. The tables show the mean differences across government and private unaided schools. While the statistical analyses included the private aided schools, the results are not being reported here due to their very small sample size.
14
5.1 Socio-economic composition of students in government and private schools 44. In tables 6 and 7, we test whether the mean differences in the characteristics of
students and their family background differ significantly across government and private schools.
45. For both states, the results are similar and striking. All factors of disadvantage are less represented in the private school, and all the differences across government and private schools are significant at the 1% level. Private schools have fewer students from SC and ST households, are more likely to be male. More students in these schools have parents who are educated above primary school. They also are more likely to have fathers who are not agricultural laborers, and come from households that own more than the median landholding in the sample.
46. The adjusted mean differences in these characteristics between the school types become larger in magnitude, and are larger for private unaided unrecognized schools.
These results clearly suggest considerable sorting of students on observed characteristics across school types. It is therefore likely that sorting is also going on along unobserved family/student characteristics such as attitude and motivation.
Table 6: Difference between private and government schools (private-government), Uttar Pradesh
Mean Share
Unadjusted Difference District FE + rural dummy Village FE Unaided
Recognized
Unaided Unrecognized
Unaided Recognized
Unaided Unrecognized
Unaided Recognized
Unaided Unrecognized
SC -0.073** -0.11** -0.13** -0.14** -0.2** -0.21**
OBC 0.03** 0.033** 0.09** 0.05** 0.15** 0.11**
General 0.04** 0.08** 0.04** 0.09** 0.05** 0.10**
Female -0.10** -0.15** -0.11** -0.18** -0.15** -0.23**
Tuition 0.04** 0.055** 0.04** 0.06** 0.07** 0.09**
Father's Education Primary School
and Below -0.09** -0.16** -0.12** -0.13** -0.17** -0.26**
Mother's Education Primary School
and Below -0.11** -0.12** -0.10** -0.10** -0.15** -0.13**
Father Agricultural
Laborer -0.06** -0.031** -0.04** 0.04** 0.07** -0.01**
Land owned more
than median -0.007 0.075** 0.024* 0.11** 0.15** 0.11**
* 5% significance level; ** 1% significance level
Table 7: Difference between private and government schools (private-government), Madhya Pradesh
Mean
District FE + rural
dummy Village FE
Unaided Recognized Unaided Recognized Unaided Recognized
SC -0.15** -0.15** -0.23**
ST -0.065** -0.083** -0.078**
OBC 0.058** 0.087** 0.18**
General 0.15** 0.15** 0.13**
Female -0.093** -0.12** -0.18**
15
Tuition 0.08** 0.06** 0.05**
Father's Education Primary School
and Below -0.28** -0.28** -0.3**
Mother's Education Primary School
and Below -0.23** -0.19** -0.19**
Father Agricultural Laborer -0.05** 0.08** 0.15**
Land owned more than median 0.05** 0.16** 0.23**
* 5% significance level; ** 1% significance level
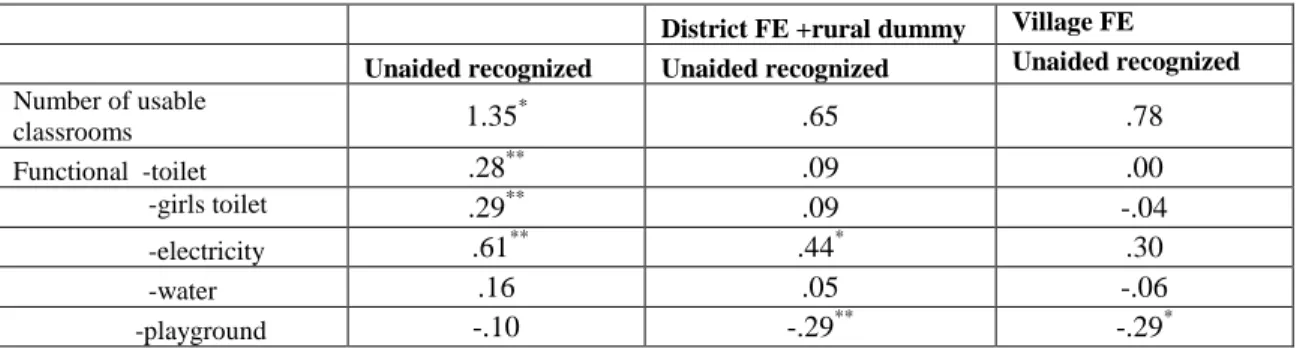
5.2 School Inputs Physical Infrastructure
47. There are few consistent differences in infrastructure between private and government schools (Tables 8-9). In Uttar Pradesh, private schools have fewer classrooms and in both states private schools (especially recognized ones) are more likely to have electricity in regressions with district fixed effects.
Table 8: Difference between private and government schools (private-government), Madhya Pradesh
District FE +rural dummy Village FE
Unaided recognized Unaided recognized Unaided recognized Number of usable
classrooms 1.35* .65 .78
Functional -toilet .28** .09 .00
-girls toilet .29** .09 -.04
-electricity .61** .44* .30
-water .16 .05 -.06
-playground -.10 -.29** -.29*
Table 9: Difference between private and government schools (private-government), Uttar Pradesh District FE +rural dummy Village FE
Unaided recognized
Unaided unrecognized
Unaided recognized
Unaided unrecognized
Unaided recognized
Unaided unrecognized Number of usable
classrooms
-.86 -1.21* -1.07* -1.38** -.85 -1.25
Functional -toilet .15 -.09 .01 -.19 -.01 -.15
- girls toilet -.10 -.19* -.16 -.23* -.10 -.20
- electricity .4** .15 .31** .11 .25* .10
- water -.03 -.19 -.04 -.25* -.11 -.28
- playground -.20 -.07 -.06 -.08 -.06 -.14
* 5% significance level; ** 1% significance level
Teaching Related Inputs
48. A clear advantage of private schools in both states is a lower pupil-teacher ratio (Tables 10-11). Aggregate teacher attendance and activity at the school level do not differ between private and government schools, except for private unrecognized schools in Uttar Pradesh that have higher activity even when district or village fixed effects are included.
16
Table 10: Difference between private and government schools (private-government), Madhya Pradesh
District FE + rural dummy Village FE
Unaided recognized Unaided recognized Unaided recognized
Enrollment -34 -55* -58
Number of
teachers 2.59**
2.01** 1.68
Pupil-teacher ratio
-29**
-30** -24**
Multi grade
teaching -.55* -.44** -.35
Teacher attendance .01 .00 .03
Teacher activity -.06 -.06 -.04
* 5% significance level; ** 1% significance level
Table 11: Difference between private and government schools (private-government), Uttar Pradesh District FE +rural dummy Village FE
Unaided recognized
Unaided unrecognized
Unaided recognized
Unaided unrecognized
Unaided recognized
Unaided unrecognized
Enrollment -96** -114** -97* -121** -93* -134*
Number of
teachers 1.28** 1.40*
1.21* 1.14 .67 1.04
Pupil-teacher
ratio -33** -37** -32** -35** -30** -39*
Multi grade
teaching -.07
-.25* -.15 -.25 -.12 -.19
Teacher attendance
.05 .04
-.01 .04 -.01 .05
Teacher activity .18** .11** .10 .09* .09 .11*
* 5% significance level; ** 1% significance level
5.3 How do teachers differ across school types?
5.3.1 Teacher profile Uttar Pradesh
49. Demographics: Teachers in private schools are more likely to be younger than teachers in government schools (Table 12).
50. Within government schools, contract teachers and regular teachers have different demographic profiles due to different recruitment policies. Compared to regular teachers, teachers in private schools are more likely to be from the local area. But contract teachers in government schools are more likely to be female and local compared to private school teachers (Table A.11a. in appendix).
51. Professional credentials and salary: Overall teachers in government schools are more likely to be trained, have greater experience and a higher salary than teachers in private schools. Teacher salary in government schools is eight times that in private schools (Table A6). The differences in these characteristics are bigger between regular teachers in government schools and teachers in private schools. Regular teachers are also more educated than teachers in the private sector.
17
Table 12: Difference between private and government schools (private-government), Uttar Pradesh District fixed effect + rural dummy Percent unless
stated otherwise
Unaided recognized
Unaided unrecognized
Unaided recognized
Unaided unrecognized
Age (yrs) -6.28** -2.62** -5.74** -2.93**
Male .04 .12** .11* .19**
Local -.04 .07 -.06 .11*
Pre-service
training -.38**
-.41** -.33**
-.43**
Graduate degree -.04 -.06 -.03 -.08
Experience (yrs) -3.38**
-1.78** -3.33** -1.73*
Salary (rupees) -5477** -5564** -5435** -5700**
Madhya Pradesh
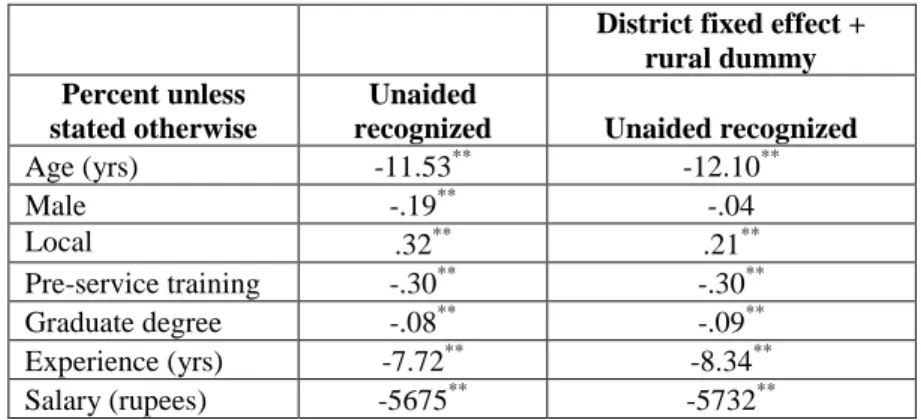
52. Demographics: Overall teachers in private schools are younger and more likely to be from the local area than teachers in government schools (Table 13).
53. Within government schools, contract teachers and regular teachers have different demographic profiles. Compared to regular teachers, teachers in private schools are also more likely to be female (Table A.11b in appendix.).
54. Professional credentials and salary: Overall teachers in government schools are more likely to be trained and have greater experience, education and a higher salary than teachers in private schools. Teacher salary in government schools is eight times that in private schools (Table A7). The differences in these characteristics are bigger between regular teachers in government schools and private school teachers.
Table 13: Difference between private and government schools, Madhya Pradesh District fixed effect +
rural dummy Percent unless
stated otherwise
Unaided
recognized Unaided recognized
Age (yrs) -11.53** -12.10**
Male -.19** -.04
Local .32** .21**
Pre-service training -.30** -.30**
Graduate degree -.08** -.09**
Experience (yrs) -7.72** -8.34**
Salary (rupees) -5675** -5732**
5.3.2 Teacher Effort
Government and private schools are similar in rates of teacher attendance, but differences in rates of teacher activity vary by state and by the type school.
18 Uttar Pradesh
55. Unadjusted Mean: Private recognized and unrecognized schools have similar rates of attendance and higher rates of teacher activity compared to government schools.
Activity rates are 11-18 percent point higher in private schools (Table 14). Mean attendance and activity rates are in table A.5. in the appendix.
56. Adjusted mean: After controlling for teacher characteristics and district or village fixed effects, teachers in private and government schools are similar in mean attendance and activity rates, except for private unrecognized schools that have higher teaching activity.
Table 14: Difference between private and government schools, Uttar Pradesh
Unadjusted (1)
Adjusted District FE + rural dummy
(2)
Adjusteda District FE + rural dummy +controls
(3)
Adjusteda Village FE + controls
(4)
Attendance Private Unaided Recognized .06 .01 .00 -.03
Private Unaided Unrecognized .06 .06 .05 .05
Activity Private Unaided Recognized .18** .08 .06 .04
Private Unaided Unrecognized .11** .10* .08* .11*
a Controls are a full set of teacher characteristics. *significant at the 5% level; **significant at the 1% level
Madhya Pradesh
57. Unadjusted mean: Private schools are similar to government schools in rates of teacher attendance and activity (Table 15). Mean attendance and activity rates are in table A.5. in the appendix.
58. Adjusted mean: After controlling for teacher characteristics and district/village fixed effects, private unaided recognized schools continue to have similar attendance and activity rates as government schools.
Table 15: Difference between private and government schools, Madhya Pradesh
Unadjusted (1)
Adjusted District FE + rural dummy
(2)
Adjusteda District FE + rural dummy +controls
(3)
Adjusteda Village FE + controls
(4)
Attendance Private Unaided Recognized .02 -.01 .06 .09
Activity Private Unaided Recognized -.06 -.08 -.08 -.02
a Controls are a full set of teacher characteristics. *significant at the 5% level; **significant at the 1% level
59. In both states, there is no discernible pattern of correlation between specific teacher characteristics (such as professional and demographic characteristics) and teacher