Policy Research Working Paper 7077
Can Conditional Cash Transfers Improve Education and Nutrition Outcomes
for Poor Children in Bangladesh?
Evidence from a Pilot Project
Céline Ferré Iffath Sharif
Social Protection and Labor Global Practice Group October 2014
WPS7077
Public Disclosure Authorized Public Disclosure Authorized Public Disclosure Authorized Public Disclosure Authorized
Produced by the Research Support Team
Abstract
The Policy Research Working Paper Series disseminates the findings of work in progress to encourage the exchange of ideas about development issues. An objective of the series is to get the findings out quickly, even if the presentations are less than fully polished. The papers carry the names of the authors and should be cited accordingly. The findings, interpretations, and conclusions expressed in this paper are entirely those of the authors. They do not necessarily represent the views of the International Bank for Reconstruction and Development/World Bank and its affiliated organizations, or those of the Executive Directors of the World Bank or the governments they represent.
Policy Research Working Paper 7077
This paper is a product of the Social Protection and Labor Global Practice Group. It is part of a larger effort by the World Bank to provide open access to its research and make a contribution to development policy discussions around the world.
Policy Research Working Papers are also posted on the Web at http://econ.worldbank.org. The authors may be contacted at isharif@worldbank.org.
There is an increasing recognition that investment in human development at an earlier age can have a significant impact on the lifetime earnings capacity of an individual. This notion is the basis for the popularity of conditional cash transfer programs to help boost child health and educa- tion outcomes. The evidence on the impact of conditional cash transfers on health and education outcomes, however, is mixed. This paper uses panel data from a pilot project and evaluates the impact of conditional cash transfers on consumption, education, and nutrition outcomes among poor rural families in Bangladesh. Given implementation challenges the intervention was not able to improve school
attendance. However the analysis shows that the pilot had
a significant impact on the incidence of wasting among
children who were 10–22 months old when the program
started, reducing the share of children with weight-for-
height below two standard deviations from the World
Health Organization benchmark by 40 percent. The pilot
was also able to improve nutrition knowledge: there was a
significant increase in the proportion of beneficiary mothers
who knew about the importance of exclusively breastfeed-
ing infants until the age of six months. The results also
suggest a significant positive impact on food consumption,
especially consumption of food with high protein content.
Can Conditional Cash Transfers Improve Education and Nutrition Outcomes for Poor Children in Bangladesh? Evidence from a Pilot Project*
Céline Ferré Iffath Sharif
Keywords: Cash transfers; Conditionality; Nutrition; Poverty; Bangladesh JEL classification: I15; I21; I38; J13, O15
Acknowledgements
We are grateful to Zahid Hassan and his team at DATA for their contribution during the data collection and
preparation, the Shombhob pilot implementation team, and Nkosinathi Mbuya and Salwa Khan for their
contributions during the design of the nutrition module in the household questionnaire used for the
evaluation. Raisa Sara provided excellent research assistance. Helpful comments on earlier version of the
paper were received from Maria Florencia Pinto Pablo Gottret, and Cem Mete. Financial support for this
research was provided by the South Asia Food and Nutrition Security Initiative (SAFANSI) and the Rapid
Social Response (RSR) MDTF of the World Bank.
Acronyms
BPO Bangladesh Post Office CCT
CTR
Conditional Cash Transfer Cost-to-transfer Ratio DiD Difference-in-Differences
EGPP Employment Generation Project for the Poorest FSSP Female School Stipend Program
GoB Government of Bangladesh
HIES Household Income and Expenditure Survey LGSP Local Government Support Project
MDG MIS
Millennium Development Goals Management Information System NCC Narayanganj City Corporation NNP National Nutrition Program
PMT Proxy-Means Test
POS Point-of-Sale
RD Regression Discontinuity
UP Union Parishad
2
1. Introduction
There is a large body of literature that suggests that, if implemented well, conditional cash transfers (CCTs) are appropriate demand side interventions that can have a significant positive impact on both poverty and human development outcomes (Fiszbein and Schady, 2009).
Popularly known as CCTs, these programs offer a way to arrest the intergenerational transmission of poverty by increasing current household investment in human capital formation. They do so by providing regular cash payments to families on the condition that they fulfill certain basic obligations, which are typically related to the usage of health or education services. Thus, the nature of the intervention increases consumption or has an “income effect.” It also increases the relative benefit of the service or the intervention that the cash transfer is being conditioned on, thereby generating a further “price effect” on the household decision to invest in schooling or other services that formulate the conditions for receiving the cash transfer. These effects are reflected in evaluations of CCTs which generally find that these programs boost household consumption, as well as have a positive effect on increasing use of health and education services.
Well-known examples of CCTs that have been widely evaluated and shown to have had impressive positive results on poverty and the use of health and education services include Oportunidades in Mexico and Bolsa Familia in Brazil. The evidence on health and education outcomes, however, is mixed. Although CCTs increase the likelihood that households will take their children for preventative health check-ups, only in some cases has this been shown to improve child nutritional status among beneficiary households. There are papers that argue that there may be limited impact of conditioning cash transfers, and that given the costs involved in setting up compliance monitoring mechanisms in CCTs, there may be a case for keeping cash transfers “unconditional” (Baird et al, 2011). This debate on whether to introduce conditional as opposed to unconditional cash transfers is all the more relevant in low income country contexts such as Bangladesh where there are limitations of both public resources as well as of capacity to implement programs. A subtle but important argument presented in Baird et al (2011) is that
3
country context matters whereby the impact of the conditionality is greater if it attempts to change household behavior as opposed to merely addressing a financial constraint. Akresh et al (2013) add another element to this debate by arguing that conditionality can be important if one is trying to influence household investment decisions on “marginal” children, i.e. those who are initially not enrolled in school or less likely to go to school such as girls, younger children or lower ability children.
The Government of Bangladesh (GoB) was among the first to pioneer conditional cash transfers in the early 1990s in the form of the Female School Stipend Program (FSSP). Studies have found some contribution of this program to the fourfold increase in female secondary school enrollment thereby reversing gender gaps in secondary level education outcomes.
1Since then, several CCT programs were implemented mainly to improve primary education outcomes. These include the Primary Education Stipend Program in 2002 and the Reaching Out-of-School Children in 2004. Experimentation with conditional cash transfers to improve the utilization of health services or outcomes is far more limited. While there are a couple of small programs that have tried to use conditional cash transfers to improve maternal and infant health (e.g. the Maternity Voucher Scheme and the Lactating Mothers Scheme), robust evaluations of these programs do not exist. More recently, the GoB piloted a CCT delivered through local governments, known as the Shombhob project which focused on improving both education and nutrition outcomes of young children. The Shombhob project (“Shombhob” means “possible” in Bangla) delivered bi-monthly cash transfers to very poor households with children aged 0 to 36 months or children attending primary school provided that they fulfill a range of nutrition and education-related obligations. This paper assesses the impact of this intervention on household
1
Khandker et al (2003) and Fuwa (2001) find that 8 percent of the increase in school enrollment can be attributed to FSSP. Shamsuddin (2013) finds that the program increased education level completed by at least half a class, and the likelihood of women working in the formal sector. Other factors for the increase in female secondary enrollment may have also played a role. Heath and Mobarak (2012)
examine the impact of job availability on parents’ decision to invest in their children’s education, and suggest that it was the growth in the garment industry that led to an increase in female school enrollment rather than the government FSSP program.
4
welfare, as well as on school attendance and a set of nutrition-related outcomes. Using a panel data set, the paper uses the design features of the project to identify the impact of the intervention.
Specifically, the paper estimates the effects of the Shombhob pilot on the following outcomes: (i) household food consumption; (ii) school attendance for primary-school-aged (6-15 years old) beneficiary children;
2(iii) incidence of underweight, wasting and stunting among beneficiary children aged below 3 years old; and (iv) nutrition-related knowledge and practices in beneficiary households with at least one child aged 0 to 36 months. Findings from the paper are able to contribute to the vast literature on the impact of CCTs, particularly on the much less studied impact on nutrition-related outcomes. The paper also assesses the effectiveness of the program processes and thus offers lessons on the design and implementation should the GoB were to scale up the intervention.
The paper is organized as follows. Section 2 describes the Bangladesh context and the design of the project. Section 3 describes the study design and the empirical methodology. The main findings of the evaluation are presented in Section 4. Finally, based on the findings of this paper, section 5 provides recommendations on the options for an expansion of the project.
2. The Bangladesh Context and Design of the Shombhob Pilot Project
2.1 Background
Despite remarkable progress in poverty reduction, extreme poverty and vulnerability in Bangladesh remain stubborn problems, which in turn can negatively affect child nutrition and educational outcomes. National level poverty lines suggest that poverty fell from 48.9 percent in 2000 to 40 percent in 2005 to 31.5 percent in 2010. Coupled with this progress was a consistent advancement in well-being and increased caloric intake and educational attainments across all income groups. Nevertheless an estimated 26 million people still remain in extreme poverty, and
2
The Government of Bangladesh considers children aged 6 to 15 the target group of primary education and displays education on this age group for primary school enrollment and attendance. In order to allow for comparison with official statistics, the same age group was used in this paper .
5
improving the human development outcomes for poor children remain a formidable challenge for Bangladesh. While there has been significant progress in reducing the incidence of underweight children below 5 years (from 60 percent in 1990 to 36 percent in 2011), progress in reducing wasting and stunting
3has been less encouraging. The rate of reduction in stunting from 2004 to 2011 was only 1.3 percentage points per year while the prevalence of wasting remained virtually the same. The incidence of low birth weight among newborn babies in Bangladesh is among the highest in the world, ranging between 20 to 22 percent, and maternal under nutrition is at about 24 percent (NIPORT, 2013). Poor dietary diversity and insufficient minerals in the average diet cause major diseases. Although the problem of under nutrition affects the whole population, the poor primarily bear its burden: improvements in childhood underweight and wasting outcomes show a strong negative wealth gradient (World Bank, 2013a).
While Bangladesh has been able to make much better progress in improving outcomes in primary education, some gaps between the poor and non-poor still remain. Inequity in primary enrollment because of household poverty has been reduced by half between 2000 and 2010.
However, while more children of primary school age were attending primary school in 2010 compared to 2000, repetition and dropout rates still remain high. About 5 million children are still out of the school system and most of them are from poor households (World Bank, 2013b). The poorest children (coming from the poorest 20 percent of families) are 12 percent more likely to be out of school, and this difference is mostly due to them having a lower chance of ever enrolling in or completing grade one, compared to the richest 20 percent. For poor children in Bangladesh, the opportunity cost of attending school can be high
4. Further increases in completion rates will thus need to be supported by interventions that help to increase both student enrollment and retention among poor children. Moreover, children living in slums are particularly vulnerable for
3 Underweight children are too thin for their age, wasted children are too thin for their high, and stunted children are too short for their age. See detailed discussion on underweight, stunting and wasting on page 27.
4
In fact recent analysis (Ito and Shonchoy, 2014) finds statistically significant impacts of seasonal labor demand on the school dropout rate in Bangladesh among children from agricultural households.
6
remaining out of the school system, and thus require additional focus.
Given this potential scope for demand side interventions to improve both nutrition and education outcomes among the poorest in Bangladesh, the GoB introduced the Shombhob pilot intervention in January 2012. Implemented by the Ministry of Local Government, the Shombhob project was designed to set up a conditional cash transfer mechanism that would work with poor mothers and their children to improve school attendance and nutrition behavior and outcomes.
2.2 Project design
The objective of the Shombhob project was threefold: (i) test the delivery of conditional cash transfers to the poorest households through local governments to reduce their household poverty levels, (ii) increase school attendance of beneficiary children going to primary school, and (iii) improve the nutritional status of beneficiary children aged 0 to 36 months old.
Specifically, the pilot project was expected to result in the following human development outcomes:
(i) Improvements in attendance rates among beneficiary children attending primary school;
(ii) Increased attainment of “age specific goal weight” (e.g. incidence of underweight, wasting and stunting) among 0 to 36 months;
(iii) Increased nutrition-related knowledge and practice among mothers with children aged 0 to 36 months;
(iv) Increased rate of exclusive breastfeeding of children aged 0 to 6 months;
(v) Increased dietary diversity and appropriate frequency of feeding among children aged 7 to 24 months.
The choice of the above indicators was based on the notion that the intervention will be carried out for at least 24 months covering two academic years from December 2011 to December 2013. However due to start up delays, implementation only began in February 2012, allowing transfers to be provided for 21 months (from April 2012 to December 2013). In addition, the project faced additional implementation challenges due to the annual floods that hit
7
the project locations during the months of August and September. School closures due to these floods constituted the most serious implementation challenge given focus of the transfers on regular school attendance. These implementation challenges coupled with the fact that the impact evaluation only covers 13 months of cash transfers are likely to affect the impact of the intervention on some of the above indicators.
Ten Unions
5from two rural Upazilas
6(Jaldhaka and Hatibandha) located in the Rangpur Division, which is the poorest in Bangladesh, were chosen as the pilot locations. To test the pilot in an urban setting, the project was also located in the slums of Narayanganj City Corporation.
The choice of Narayanganj was mainly driven by the practical consideration that the city offers large numbers of semi-public slums where the chances of “slum eviction” is likely to be minimal.
A detailed list of the rural and urban locations is provided in Tables A1 and A2 in Annex I.
Following a Public Information Campaign on the project objectives and duration, the targeting and enrollment processes were carried out. The Project used Proxy Means Test (PMT) scores to determine household eligibility.
7To create the initial beneficiary roster, Shombhob set up an open registration process where interested households with at least one child age 0-36 months
8and/or at least one primary-school-aged child were invited to come and apply to be selected by the project. During registration, each household had to fill in a questionnaire which gathered all the information and variables needed to construct a PMT score based on the formula and weights developed for Bangladesh in Sharif (2009) (see Table B1 in Annex II for the list of variables included in the PMT formula).
5
Unions are the lowest administrative unit in the Upazila. There are generally about 10 Unions per Upazila.
6
Upazilas are the lowest administrative unit in the Districts. Districts are the composed of Divisions. There are 64 Districts and 7 Divisions in Bangladesh.
7
The PMT based methodology predicts household wealth using a set of observable and verifiable variables that are highly correlated with household consumption.
8
Even though initially the project design included children below the age of 24 months, during implementation the age limit was increased to 36 months. The delay in implementation by six months since the implementation of the baseline survey led to this change.
8
Out of the 37,801 families who applied for the program, the poorest 15,952 families were selected based on their PMT scores. This meant that the cut off lines or the eligibility thresholds for selection was a PMT score of 660 for the two rural Upazilas and 690 for the Narayanganj City Corporation (NCC).
9The list of eligible beneficiaries was then validated by community leaders, and verified by UP chairmen, and the Mayor’s office in the case of NCC. UP Chairmen, members, leaders of communities also played a role in explaining the project objectives to the targeted families. The eligible families were requested to enroll into the project, and this enrollment process was completed in April 2012. The final number of enrolled households was 14,125. Among this roster of eligible households, there were 7,004 children who were eligible to receive the nutrition benefit and 15,774 children who were eligible to receive the education benefit. The breakdown of the beneficiary families in terms of their location and the type of benefit is provided in Table 1 below.
Table 1: Distribution of Beneficiaries Total beneficiaries 14,125 families
Jaldhaka 7,735 families
Hatibandha 4,238 families Narayanganj 2,154 families Nutrition-related benefits 7,004 children Education-related benefits 15,774 children
Once enrollment was completed the project delivered cash payments every two months to the enrolled households from April 2012 to December 2013. Three types of transfers were set up depending on the household demographic composition. Beneficiary households received: (i) a transfer of BDT 400 (approximately USD 5) per household if the household members included
9
The two cutoff points, 660 and 690, are given without any unit, as they are a score. These cut-offs represent respectively the 19 and 47 percentiles of the national income distribution (data from HIES 2005).
These cut offs were determined based on both the resource envelop and the capacity of the implementing agency to monitor the project. A higher cut off was used for Narayanganj as it is relatively wealthier than rural areas in Rangpur and to minimize undercoverage rates. Using a higher cut off line for urban areas relative to rural areas is also consistent with the recommendations in Sharif (2009).
9
one or more children aged 0 to 36 months;
10(ii) BDT 400 per household if eligible families had one or more children going to primary school; and (iii) BDT 800 for those households with children below 36 months of age as well as children going to primary school. These transfers were a flat amount and did not vary with the number of children in either category.
11Thus the maximum benefit amount a household could receive was BDT800 per month. An innovative electronic payments system was developed with the Bangladesh Post Office (BPO), which provided cash cards to beneficiary mothers to make transfers electronically to their accounts with the Post Office. Payments were made using Point-of-Sales (POS) machines with the option of accessing the cash either at the village level with the help of a “mobile payments team” or at the Upazila level BPO branch office. The BPO arranged for a mobile team to travel with POS machines and cash to the village centers on a designated day during each payment cycle.
Alternatively the beneficiary had the option to withdraw cash at any point in time from the Upazila BPO branch office. BPO received a small commission for this service – 1 percent of the transferred amount or BDT 10, whichever is higher. Payment verification as a result was made possible in real time and provided to the project management.
The average transfers under this pilot are relatively higher than other existing social safety net programs, but nevertheless low enough to not lower incentives to work. The maximum monthly amount was BDT 800, which is about 14 percent of the lower poverty line and 18 percent of the 2010 food poverty line (World Bank, 2013a). Evidence from CCT programs in other developing countries suggest limited labor disincentive impacts especially when the level of benefit is within 20 percent of beneficiary households’ income (Grosh et al, 2008). These transfers were linked to specific conditions on the part of beneficiary households. To ensure that households knew these conditions, each household received a booklet, which detailed the purpose
10
While the original target group was children below the age of 24 months, due to the delay between collecting the baseline data and the start of the project, program design was changed to increase the age limit of children to be eligible for the nutrition allowance.
11
This was a conscious decision so as to not provide incentives to increase the size of households, and counter the family planning policies of the Government.
10
of the pilot project and its timeline, the eligibility criteria, beneficiary conditions, and the payments and grievance redress mechanisms. Table 2 presents the benefit schedule and the conditions that determined the size of monthly transfers.
Table 2: Benefit Amounts
Target group Type of benefit Condition
Households with children aged
0-36 months Nutrition allowance of
BDT 400 per month
Monthly attendance at growth monitoring of children aged 0 – 36 months, and nutrition session for mother/caregiver
Households with children going
to primary school (6-15 years) Education allowance of BDT 400 per month
Regular school attendance (at least 80 percent every month) for enrolled children in primary school
The education and nutrition transfers were conditioned on (i) attendance at regular local government or non-government primary schools (at least 80 percent of classes) by primary school going children;
12and (ii) regular growth monitoring of beneficiary children aged 0-36 months.
Participation in monthly nutrition-related education sessions by mothers of children aged 0 to 36 months or caregivers and other decision-makers (e.g. mothers in law, fathers) were encouraged but was not mandatory. School attendance was monitored at the school level by Shombhob officers using the attendance sheets supplied by the schools.
3. Impact evaluation design
3.1 Panel Data and Sampling Framework
Even though the project was implemented in three locations, due to time and resource constraints, the localities chosen for the impact evaluation of the project were Jaldhaka Upazila
12
Local government officers were responsible for visiting the schools every 45 days to take records of the children’s attendance. In practice, this was a challenging task – too few officers were tasked with visiting a large number of schools and beneficiary children’s enrollment information had to be verified every cycle due to poor record-keeping and information flow.
11
and Narayanganj City Corporation only. A baseline survey was fielded prior to the initiation of the project in May/June 2011 based on a two-stage process. The first stage included a complete census of all households in the five project unions of Jaldhaka Upazila (Kaimari, Saulmari, Khutamara, Kathali, and Mirganj Unions) and in the 36 government-recognized slums of Narayanganj. The census questionnaire collected information on all the variables needed to compute household level PMT scores. The census survey provided information on 36,610 households in the Jaldhaka unions, and 7,980 households in the slums of Narayanganj.
Information on household demographics, household head characteristics, household assets, type of housing, access to facilities and overseas remittances allowed the construction of a PMT score for each household (see Table B2 in Annex II for a complete list of variables collected and weights associated). The universe of households to draw from was further restricted using households’ likelihood of being a Shombhob beneficiary: households with PMT scores above the 50
thpercentile were discarded and the rest was divided between households with PMT scores below the 25
thpercentile (potential beneficiaries) and households with PMT scores between 25
thand 50
thpercentile (potential controls).
13In the second stage, a random sample of 3,000 households was drawn from the census list and interviewed. This stratified sample resulted in having 2,400 households from rural Jaldhaka Upazila, and 600 households from the slums of Narayanganj. Data was stratified in each location to ensure representativeness of the four different types of families (no qualifying children, households with young children (0-36 months old) only, households with children going to primary school (6-15 years old) only, and households with both). Households were randomly selected within each of the four demographic groups and within each of the two PMT score groups (below the 25
thpercentile and between the 25
thand 50
thpercentiles).
13
The choice of the eligibility threshold was 25
thpercentile since the incidence of extreme poverty at the time of the project design was 25 percent. However, during implementation the cut off line was lowered due to changes in the poverty rates as well as to limit the number of beneficiaries to a manageable size.
12
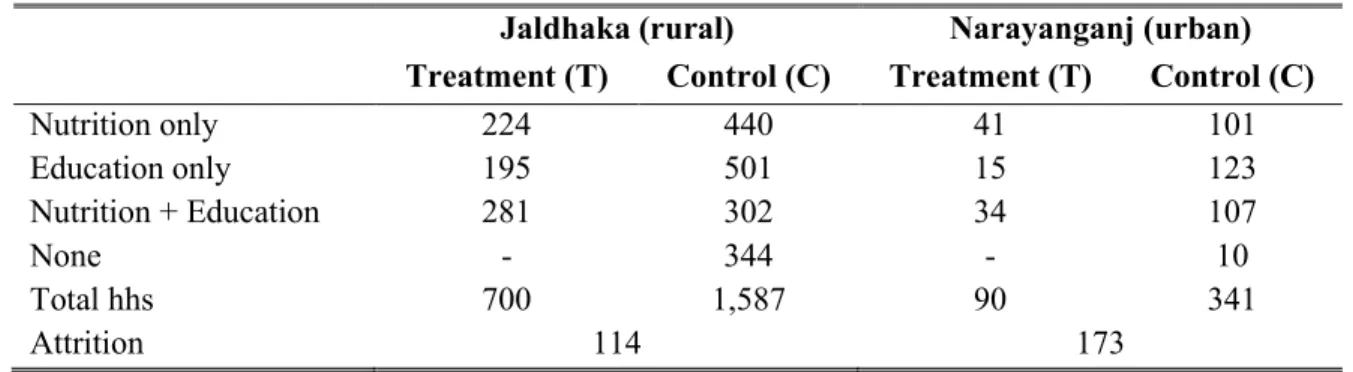
Table 3: Number of Households in the Shombhob panel sample
Jaldhaka (rural) Narayanganj (urban) Treatment (T) Control (C) Treatment (T) Control (C)
Nutrition only 224 440 41 101
Education only 195 501 15 123
Nutrition + Education 281 302 34 107
None - 344 - 10
Total hhs 700 1,587 90 341
Attrition 114 173
These same households participated in a follow-up end line survey fielded in May/June 2013, 13 months after receipt of the first Shombhob payment. The follow-up survey used the original baseline questionnaire and respondent lists. To ensure there were enough households in each component of the treatment and control groups, a sample of 3,005 households was interviewed. Based on these three sets of data (from the census, baseline and endline surveys), a panel of 2,718 households remained to conduct our analysis.
14Table 3 presents the different samples in the data set. In Jaldhaka, 700 households received at least one Shombhob transfer, 1,587 did not receive any, and 114 households interviewed during the baseline were not found when the enumerators came back for the endline survey. In Narayanganj, 90 households received at least one Shombhob transfer, 341 did not receive any, and 173 households could not be located at the time of the endline survey. The high attrition rate in Narayanganj while not unusual given the high frequency of in and out migration among the residents of urban slums, is clearly a challenge for any social program targeted towards the urban slum population. Due to this high attrition rate in Narayanganj, the impact evaluation was restricted to the Jaldhaka sample.
3.2 Methodology
To determine the impact of Shombhob we use the Difference-in-Differences (DiD) or double difference methodology which compares the outcomes of beneficiary households and their
14
2,718 corressponds to 3,005 panel households minus 287 households that moved out of the pilot location.
13
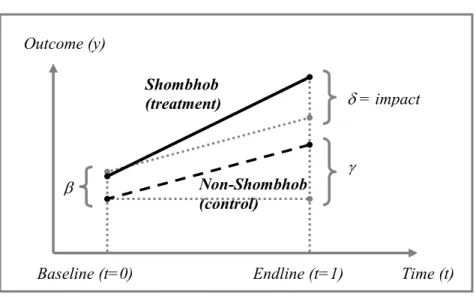
children before and after the implementation of Shombhob to derive impact estimates. Ideally the net impact of the pilot would be measured by comparing the change in the presence of the intervention and in the absence of the intervention. However since it is not possible to observe the same households and children in both of these states, the DiD estimator assumes that the average change in the comparison group represents the counterfactual change in the treatment group if there were no treatment. This allows a reliable inference of program impact by comparing the pre- to post-intervention change in the outcome of interest for the treated group relative to a comparison group. The net impact of Shombhob is defined, as shown in equation 1 below, as the change in the outcome of interest of beneficiary households and their children (treatment) minus that of non-Shombhob households and their children (control), before and after the project implementation:
Impact
y= (y
shom, after– y
shom, before) – (y
non-shom,
after– y
non-shom, before) (1)
where (y
hh status,
time) indicate the enrollment status of a given household before and after project implementation. The change in the outcome of Shombhob households is given as (y
shom, after–
y
shom,
before). Similarly, the change in the outcome of non-Shombhob households over the same
period is given as (y
non-shom,
after– y
non-shom, before). Therefore, the net project impact on the change in the outcome is calculated by equation 1, which yields the difference of growth in the outcome for the Shombhob households (treatment) and the non-Shombhob households (control) before and after the project implementation. The estimated impact is illustrated in Figure 1 below.
14
Figure 1: Difference-in-differences Methodology
Instead of computing this double difference in means, we run a set of DiD regressions, allowing controlling for differences in observable characteristics:
Y
it= α + β T
i+ γ t + δ T
it + φ X
i+ ε
it(2)
where t stands for the period (t = 0 for the baseline, and 1 for the endline). Y
itis the outcome of household i in period t. T
irepresent the treatment status of the household: it takes the value 0 if in the control group (non-Shombhob) and 1 if in the treatment group (enrolled in Shombhob). X
iis a set of additional observable characteristics,
15and ε
itis an error term. β measures the difference between treatment and control at baseline, γ shows the difference in outcomes between baseline and endline in the absence of the program, and δ is our coefficient of interest and the estimated impact of the program on Y (see Figure 1).School Enrollment: Impact he Conditional Cash
One key assumption of the estimation strategy described above is that unobservable factors (“heterogeneity”) that shape actual program participation of the household is additively linear in nature and “differenced away” by the DiD estimation. This is equivalent to the
15
Two sets of additional characteristics are used. First, we use the PMT score as a composite indicator of household characteristics. Second, we use a set of household characteristics: household head gender, age and education, presence of agricultural laborer, housing characteristics (roof, walls, latrines, tube well, electricity), asset ownership (housed, cattle, land, fan, television, bicycle), and remittances.
Outcome (y)
Baseline (t=0) Endline (t=1) Time (t) Shombhob
(treatment)
Non-Shombhob (control)
δ = impact
γ β
15
assumption that in the absence of the intervention, the difference in the outcomes between treatment and control groups would move in tandem, decreasing or increasing at the same pace.
The error term, however, could still be contaminated with factors that shape both program participation and outcomes which could lead to a violation of the above identifying assumption of equal trends in the absence of the intervention. One way to deal with possible selection bias is to use a Regression Discontinuity Design (RDD) technique that exploits the targeting design itself.
RDD is a quasi-experimental design and makes use of discontinuities generated by program eligibility criteria such that program assignment is based on a cut-off point of some assignment variable. Households are assigned to the treatment group by a non-random assignment rule based on the assignment variable. The eligibility for becoming beneficiaries of a program is solely determined by whether they are below or above the unique value of a cut-off point. This is a case of “sharp RD design” (Rosenbaum and Rubin, 1983; Heckman et al., 1997). In other words, the probability of being exposed to treatment changes from 0 to 1 discontinuously as one crosses the cut-off. RDD identifies and estimates the program impact in the neighborhood of the cut-off point for selection into the program. Within a small interval of the cut-off, households on either side of the cut-off have similar income levels and can be thought to have similar growth in the outcomes in the absence of cash transfers or in the presence of cash transfers, and therefore form very good comparison groups. To elaborate further, suppose that the pre- treatment relationship between the assignment score (S) and the outcome variable (Y) is given by the following straight line linear regression:
Y= α + βS + є (3)
Where α and β are the regression coefficients and є is the error term. After the treatment, if the treated subjects are affected by a constant treatment effect (β
0) on the outcome variable, the regression equation can be revised as follows:
Y
i= α + β
oT
i+ β
iS
i+ є
i(4)
16
T
i= 1 if subject i is assigned to the treatment, 0 otherwise. Because of the constant effect assumption, the slope of the regression line does not change but the intercept changes to α + β
ofor the treatment group. We interpret the constant effect β
oas the program effect.
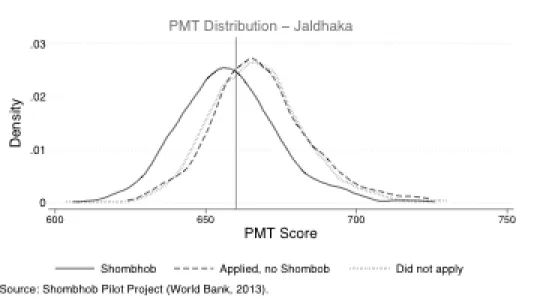
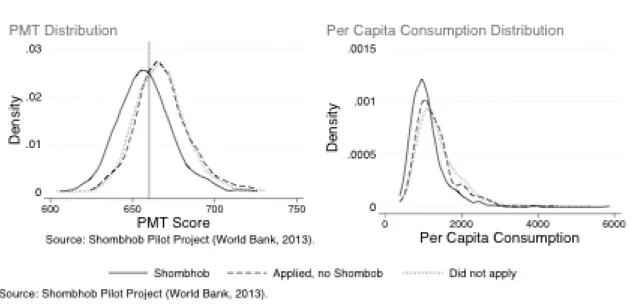
The eligibility requirement to participate in Shombhob or the assignment score S in equation 4 is to have a PMT score that is lower than 660 in Jaldhaka, and thus we are able to fulfill the sharp discontinuity assumption. Figure 2 below shows that this eligibility threshold falls between the means of both the consumption distribution of participants (solid line), and that of rejected applicants (dotted line), and thus implies that there is a considerable number of households just to the right of the threshold that have a PMT score very close to that of eligible households.
Figure 2: Eligibility threshold to determine treatment and control groups
Thus these households constitute a reasonable control group since comparing a sample of households within a very small range around the eligibility score is analogous to conducting a randomized control trial. Households with a score just to the left and just to the right of the threshold score may be considered as identical in the sense that in the absence of Shombhob, the unconditional mean values of the outcomes Y
itare the same. Therefore, it would be reasonable to evaluate the program by comparing outcomes of eligible families with Shombhob scores just
17
below the cutoff (treatment) with those of ineligible families with Shombhob scores just above the cutoff (control).
However the program implementation allowed us to construct several control groups to estimate the impact of the project. First, to derive the main results of the analysis we use the full sample of beneficiaries (i.e. the treatment group or T) and those who applied yet did not receive the program (i.e. the first set of control group, C
1). T and C
1are expected to have similar scores and motivation: households in both groups belong to the bottom 50 percent of the income distribution and applied to the program. Second, we compare T with the group of households in the panel who did not receive any transfers under the Shombhob. This second control group, C
1+C
2, includes C
1and the group of households who did not apply and thus did not get any Shombhob transfer. This robustness check, while a “fuzzy RD design,” increases the statistical power of the estimates and gives insight on the impact of Shombhob on a larger set of households.
Third, we restrict the treatment and control groups to the households whose PMT is below 660:
due to measurement error during the registration process, some rejected households actually record PMT scores below 660.
16Lastly, we use the full sample (T versus C
1+C
2) with new weights inversely proportional to the distance between household PMT and the eligibility threshold |PMT
i-660|. This fourth robustness check increases the power of the estimates – just like the second robustness check using the larger C
1+C
2control group. It also allows us to give more weight to the observations closer to one another – i.e. those immediately above and below the PMT threshold, and less weight to those further away from the threshold – i.e. less comparable households.
16
We know what the “true” PMT score is from the preliminary census that was conducted prior to the implementation of Shombhob. We believe that the baseline census records household level “true”
information as trained enumerators were able to verify the information given to them by the households.
18
4. Empirical results
4.1 Descriptive statistics
Table B2 in Annex II provides descriptive statistics of the households followed by the panel. In the case of Jaldhaka, the average household size is the same as the national average of 4.5 but the total monthly household consumption is BDT 6,066 which is significantly lower than the national average as found in the Household Income and Expenditure Survey (HIES) 2010.
Half of the total household expenditure is spent on food. A majority of household heads does not have an education and very few households own durable assets. Asset ownership and housing characteristics are poor, and worse than an average household in Bangladesh. Over 40 percent of household heads are casual agricultural laborer. The average size of land owned is about 1.8 acres. Both these characteristics are highly correlated with extreme poverty in Bangladesh. In the case of Narayanganj, households are larger in size compared to the rural panel but per capita consumption is higher than the rural sample. Interestingly the majority of urban households had access to electricity unlike the households in the rural sample. However, a much smaller proportion had access to latrines compared to rural households. A similar pattern is observed with access to safe water: a much larger proportion of rural households had access to safe water compared to urban households. The situation is the reverse when it comes to asset ownership:
more urban households owned television and fans, which is consistent with the fact that these households had more access to electricity than households in rural Jaldhaka.
Table B2 also provides a comparison between the households in the panel, and those who were not located at the time of the endline survey. We find that in the case of Jaldhaka, on average, families who disappeared between the two rounds were more vulnerable: they were poorer, with fewer assets, and more likely to rely on remittances compared to those who stayed behind. Only 5 percent of the 2401 households surveyed at baseline in rural Jaldhaka were not found at the time of the endline survey. In the case of Narayanganj, we find a similar pattern in that those households who left the project area were relatively poorer with worse access to
19
facilities compared to those who remained. The out migration in Narayanganj however was relatively high - almost 30 percent of the households surveyed in the first wave were not found at the time of the endline survey. As mentioned earlier, due to this high attrition rate in the urban sample, the impact evaluation exercise is restricted to the rural sample in Jaldhaka only.
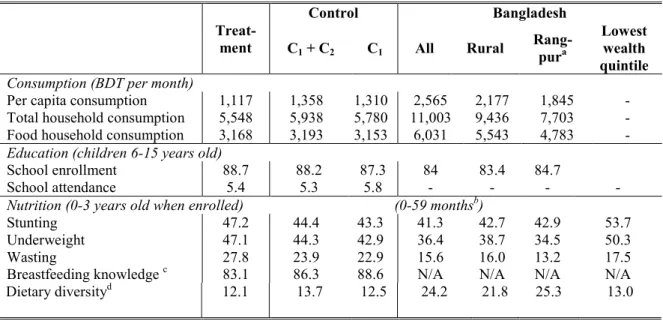
Table 4 presents a comparison of the outcome variables between the treatment and control households before the implementation of the Shombhob pilot. Most of the differences between the treatment and control households are in nutrition outcomes – the treatment households appear to be worse off compared to the control households in the case of incidence of stunting, wasting, underweight, knowledge of breastfeeding, and dietary diversity. The same is true in terms of household consumption. School attendance (defined as the number of classes missed in the last two weeks) and enrollment rates however are almost identical.
Table 4: Baseline outcome indicators by treatment and control households, Jaldhaka
Dietary diversity
d12.1 13.7 12.5 24.2 21.8 25.3 13.0
Table B3 in Annex II provides descriptive statistics of other household level characteristics of both the treatment and control groups. The data suggest the two groups are quite
Treat- ment
Control Bangladesh
C1 + C2 C1 All Rural Rang- pura
Lowest wealth quintile
Consumption (BDT per month)
Per capita consumption 1,117 1,358 1,310 2,565 2,177 1,845 - Total household consumption 5,548 5,938 5,780 11,003 9,436 7,703 - Food household consumption 3,168 3,193 3,153 6,031 5,543 4,783 - Education (children 6-15 years old)
School enrollment 88.7 88.2 87.3 84 83.4 84.7
School attendance 5.4 5.3 5.8 - - - -
Nutrition (0-3 years old when enrolled) (0-59 months
b)
Stunting 47.2 44.4 43.3 41.3 42.7 42.9 53.7
Underweight 47.1 44.3 42.9 36.4 38.7 34.5 50.3
Wasting 27.8 23.9 22.9 15.6 16.0 13.2 17.5
Breastfeeding knowledge
c83.1 86.3 88.6 N/A N/A N/A N/A
a
: For consumption data, rural Rangpur only is displayed. For all other statistics, aggregated data for Rangpur (rural + urban) is shown.
b: nutrition data is taken from the Bangladesh Demographic and Health Survey (DHS) 2011.
c: Knowledge about breastfeeding is asked to any mother who had a child with the past 36 months.
d: Dietary diversity is measured on 6-60 month-old babies as the proportion of children having at least one of the 4+ food groups.
20
similar in terms of their observable characteristics, but treatment households are slightly bigger despite having the same number of young children (0-3 years of age). In both groups, household heads are on average 37 years of age, and over 90 percent of them are men. About half of the household heads are engaged in agricultural labor, and fewer than 10 percent hold non- agricultural jobs. Asset ownership is similar across the two groups (land, cattle, tube well, fan, television, bicycle, number of rooms) except for house ownership (slightly higher for the control group), and one in 7 households (treatment and control) receive remittances. Treatment and control houses have the same probability of having young infants, but control houses have less children on average (0.74 as compared to 1.27 for treatment families), leading to slightly smaller households (4.5 members on average as compared to 5 for treatment families).
Since much of the impact of any project depends on how well the project is implemented, it is important to also assess these processes if possible. Since the Shombhob project had a dual objective of setting up a local level cash transfer modality and improving poor children’s nutrition and education outcomes, the survey instruments included many questions related to these project processes. Therefore before assessing the impact of the project on the above outcomes variables, we first look at whether the processes such as registration and payments were implemented properly. Following which we assess the impact on: (ii) household consumption variables; (ii) school attendance of primary-school-aged children; and (iii) nutrition outcomes for children aged 0 to 36 months. However we limit the analysis to the Jaldhaka sample only, and use the first control group, C
1(i.e. those applied but were not selected).
4.2 Process Assessment
Results from the panel of Shombhob participants suggest that the project was implemented reasonably well. To select beneficiary households from Jaldhaka, the PMT eligibility threshold used for the rural areas was 660. This represented a cut-off at the 19
thpercentile on the actual expenditure distribution. An application booth was set up in each union
21
after a brief public information campaign. Field level staff hired under the project was responsible for collecting the information from interested applicants. The data was then entered into an automated Management Information System (MIS), the respective weights were applied to the different variables collected to construct each household level PMT score, following which eligibility was determined based on the eligibility cut-off score of 660.
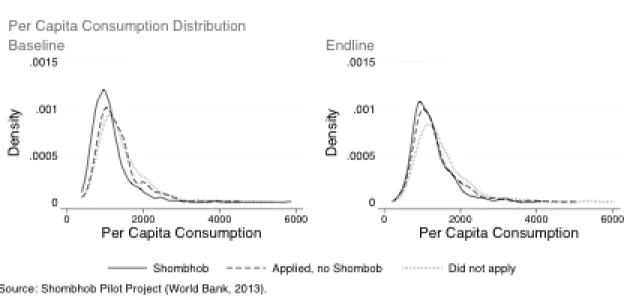
The panel data allows us to assess how well this mechanism performed in terms of identifying poorer sections of the society. The left panel in Figure 3 shows that the self-reported data generated relatively reasonable PMT scores: a majority of Shombhob beneficiaries had PMT scores below the 660 threshold, while a majority of non-beneficiary households had PMT scores above 660. Moreover, when we divide the control group between those who applied and were rejected from the program on the basis of their PMT score, and those who did not apply at all, we find that the latter group had a flatter distribution with more individuals in the upper part of the distribution. The data seems to suggest that the public information campaign and the PMT based targeting system worked well: the project was able to reasonably identify the most vulnerable.
That households who did not apply belonged to richer sections of the society and rightfully self- selected themselves out of applying is confirmed by the right panel in Figure 3 . B eneficiary households have lower per capita consumption levels than those who applied and were rejected.
This latter group has slightly lower per capita consumption levels than those who did not apply.
Thus it appears as though Shombhob beneficiary identification mechanism - comprised of a public information system and PMT based application system - was relatively successful in being able to target the right beneficiaries for the pilot.
22
Figure 3: PMT and per capita consumption - Treatment and Control – Baseline – Jaldhaka
The endline survey data suggests that a majority of non-recipients in the panel appeared to be quite satisfied with the application and selection process, with less than 20 percent who responded that the process to unfair. According to Table 5, the information campaign reached about 90 percent of the population in the five selected unions of Jaldhaka: half of the households heard about the program from a Shombhob officer, and the other half through their family members. Households had a general sense of the eligibility criteria. However, only 80 percent of the selected households came to the registration sessions with all the needed documents. This meant that families had to return with additional proofs or photocopies, and on average, it took about 8 days to complete the application process. There were some hidden costs to the application, mainly those who received the educational allowance: a third of the households had to pay for school certificates to complete the application. This was confirmed also during the implementation phase of Shombhob, as the majority of households with children attending primary school said they had difficulty getting an attendance certificate from the school, or that they had to pay a small fee for it. Some other costs that were incurred included taking pictures and getting other documents such as birth registration cards or child immunization cards (which was used in lieu of birth registration cards).
23
The payments mechanism also functioned well in Jaldhaka: 95 percent of the households received the payment transfer through the BPO mobile POS machines without any hassle. The processing time for the cash payments was affected by the large numbers of payments having to be made in one go – on average recipients had to wait 2.5 hours in queue. Even though households had the option of withdrawing their transfer amount at any time from the Upazila Post Office, to improve access by mostly poor mothers with limited access to public transport, the mobile withdrawal system was implemented. This significantly reduced the travel time to access the transfers: beneficiaries had to travel an average of 47 minutes to the BPO mobile set up whereas only about half of the households had access to the Post Office. Beneficiaries incurred a cost of about BDT 12 to receive their transfer.
Table 5: Shombhob Processes
Narayanganj Jaldhaka
Households who knew about Shombhob (%) 90.2 88.8
Households knowledge of following eligibility criteria (%):
- need to be poor 57.3 47.7
- need child aged 0-36 months 52.6 59.1
- need child going to primary school 42.7 51.4
Paid for picture (%) 46 61.4
Paid for school certificate (%) 12.6 29.4
Paid for birth certificate (%) 34.3 48.3
Paid for other documents (%) 3.6 6.5
No. of days needed to complete application 10 8.0
Amount paid for additional school certificate (BDT ) 23.3 14.2
Travel time to collect the Shombhob cash transfer (minutes) 34.8 47.2 Waiting time to collect the Shombhob cash transfer (minutes) 131.9 154.4
Cost of collecting the Shombhob cash transfer (BDT ) 38.2 12.3
Needed a new PIN over the last 12 months (%) 1.7 6.8
Knowledge of payment day (%) 95 90.9
The data from Narayanganj show more or less similar performance in terms of these processes. While the time to collect the transfer was less, the costs associated with withdrawal were thrice the amount compared to beneficiaries in Jaldhaka. The costs of paying for school certificates were also higher in Narayanganj but less people had to pay for this service. It appears that mothers in Narayanganj were better able to manage the electronic payment process – four
24
times more mothers in Jaldhaka may have lost their PIN and had to seek another one. All mothers were aware of the paydays, suggesting that in general the payment mechanism even though new to them, worked well.
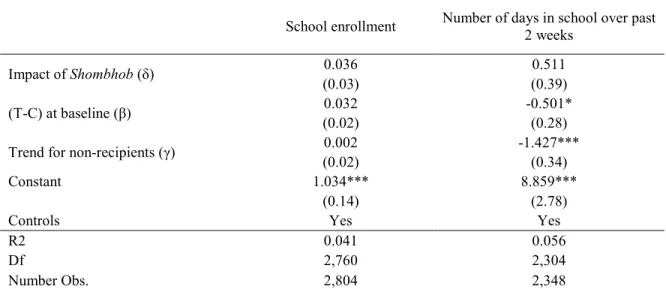
4.3 Impact on school attendance
The education transfer made under Shombhob was essentially aimed at improving school attendance. Transfers of BDT 400 were made to mothers of primary-school-aged children who were already enrolled. This design was motivated by the fact that the project implementation began in the middle of the school year, and thus it would have not been able to affect school enrollment. As expected we find no significant impact of Shombhob on school enrollment in Jaldhaka (See column one in Table 6). However, the impact of Shombhob on school attendance was also not significant (column two in Table 6 ). These results while are inconsistent with other evaluations that show significant positive impacts on school attendance resulting from both unconditional and conditional cash transfers (Saavedra and Garcia, 2012; Akresh et al, 2013), they are consistent with the implementation bottlenecks faced by the project discussed earlier.
The process evaluation report of Shombhob (World Bank, 2013c) elaborates on a number of challenges faced by the education component during implementation. Due to limited ability of the project personnel to supervise the large number of schools and monitor school attendance, the compliance monitoring of the education transfer was loose. To receive their transfers, primary- school-aged children were supposed to attend school at least 80 percent of the time, but in reality it was very challenging for program administrators to collect that information for the large numbers of schools where the beneficiary children attended. In addition, due to flooding during the months of September/October of 2012, the transfers were made regardless of the attendance rate. The lack of consistency in the implementation of the education transfer could have clouded the understanding of the beneficiary households on their co-responsibilities.
25
Table 6: Impact of Shombhob on education – Children aged 6-15 years old
School enrollment Number of days in school over past
2 weeks
Impact of Shombhob (δ) 0.036 0.511
(0.03) (0.39)
(T-C) at baseline (β) 0.032 -0.501*
(0.02) (0.28)
Trend for non-recipients (γ) 0.002 -1.427***
(0.02) (0.34)
Constant 1.034*** 8.859***
(0.14) (2.78)
Controls Yes Yes
R2 0.041 0.056
Df 2,760 2,304
Number Obs. 2,804 2,348
Significance levels: * p<0.10, ** p<0.05, *** p<0.01.Controls include: household head gender, age, education, household size, housing characteristics, asset ownership, remittances. Note: the difference in the number of observations is due to missing data.
It is also possible that these results are picking up the initial lag that has been found in other CCTs linked to enrollment. Akresh et al (2013) find that a CCT in Burkina Faso did not have a significant impact on enrollment in the first year (possibly due to similar delays in implementation as in the case of Shombhob) but that it had a positive impact in the second year.
Another possibility is that given other existing education CCT programs that operate nationwide, e.g. the Primary Stipend Program and the Reaching Out of School Children Program, the additional incentive provided by the Shombhob pilot was not sufficient to have an impact on school attendance.
4.4 Nutrition knowledge and outcomes
The Shombhob pilot was designed to have an impact on children’s nutrition through two channels. First, beneficiary mothers were required to attend monthly growth monitoring sessions, during which their children below the age of three were weighed and measured. Mothers also received a monthly nutrition counseling session on how best to care and feed their children so that they are better able to link nutrition with child growth. Second, mothers received a cash transfer
26
of BDT 400 per child per month to allow them to improve the feeding practices of their children based on the knowledge they gained through these sessions.
Three standard indices of physical growth used to describe the nutritional status of children
17include (i) height-for-age or stunting; (ii) weight-for-height or wasting; and (iii) weight-for-age or underweight. Each of these indices provides different information about the growth and body composition that reflects a child’s nutritional status. For instance,
• Stunting - or height-for-age - measures linear growth. A child who is more than two standard deviations below the median (-2 SD) of the WHO reference population in terms of height-for-age is considered short for his or her age, or stunted. This condition reflects the cumulative effect of chronic malnutrition. Stunting reflects a failure to receive adequate nutrition over a long period of time and is worsened by recurrent and chronic illness. Height-for-age, therefore, reflects the long-term effects of malnutrition in a population and does not vary appreciably according to recent dietary intake.
• Wasting - weight-for-height - describes current nutritional status. A child who is more than two standard deviations below (-2 SD) the reference median for weight-for-height is considered to be too thin for his or her height, or wasted. This condition reflects acute or recent nutritional deficit.
• Underweight - or weight-for-age - is a composite index of weight-for-height and height- for-age. Thus, it does not distinguish between acute malnutrition (wasting) and chronic malnutrition (stunting). A child can be underweight for his age because he or she is stunted, because he or she is wasted, or both. Children whose weight-for-age is below two standard
17For the purposes of this evaluation, the nutritional status of children in the survey population is compared with the World Health Organization (WHO) Child Growth Standards, which are based on an international sample of ethnically, culturally, and genetically diverse healthy children living under optimum conditions that are conducive to achieving a child’s full genetic growth potential. The WHO Child Growth Standards identify breastfed children as the normative model for growth and development and document how children should grow under optimum conditions and with optimum infant feeding and child health practices. These standards can be used therefore to assess the nutritional status of the beneficiary children in our sample.
27
deviations (-2 SD) from the median of the reference population are classified as underweight.
Weight-for-age is an overall indicator of a population’s nutritional health.
Generally compared to wasting, stunting and underweight outcomes are more difficult to affect in the short-term. Nevertheless, despite the fact that the length of the impact evaluation period is only 13 months, we assess the impact of the intervention on all three indicators. In addition to the above indicators, a few indicators related to nutrition knowledge and practices were collected, including dietary diversity for children aged 6 months and above, and introduction of solid foods for children aged 6-9 months. The following outcome indicators were thus constructed and assessed:
• Semi-solid food intake is the proportion of children 6 to 9 months who had semi-solid foods over the past 24 hours.
• Knowledge on infant feeding practices is the proportion of mothers who know that they should exclusively breastfeed their infants until the age of 6 months.
18• Minimum dietary diversity is the proportion of children 6 months and above fed from at least four food groups. Consumption of food from at least four food groups means that the child has a high likelihood of consuming at least one animal source of food and at least one fruit or vegetable in addition to a staple food (grains, roots, or tubers) (WHO, 2008). The four food groups should come from a list of seven food groups: (i) grains, roots, and tubers; (ii) legumes and nuts; (iii) dairy products (milk yogurt, cheese); (iv) flesh foods (meat, fish, poultry, and liver/organ meat); (v) eggs; (vi) vitamin A-rich fruits and vegetables; and (vii) other fruits and vegetables.
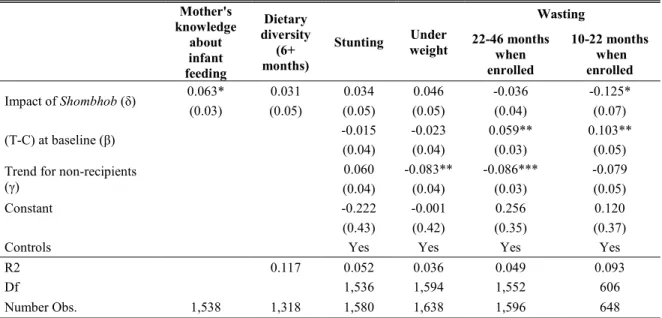
Table 7 presents the results on the above-mentioned nutrition outcomes. Mothers’
knowledge about best breastfeeding practices improved significantly more in Shombhob households: 6.3 percentage points more mothers know that they should breastfeed their children
18 Additional indicators were initially tested as well but did not yield any results: proportion of mother who immediately breastfeed their newborn, frequency of feeding for children aged 9-12 months.
28
exclusively until they reach the age of 6 months (see Column 1). Given that initially 83.1 percent of the mothers knew about breastfeeding practices, this represents an increase of 8 percent.
Dietary diversity or consumption of more than four out of the seven food groups
19among children older than 6 months also improved but not significantly. We find a significant improvement in the incidence of wasting – or weight-for-height – among the cohort of children aged 10 to 22 months at the time of enrollment:
20wasting was reduced by 12.5 percentage points, which is a reduction of about 40 percent of wasted children in this age group. On the other hand for children aged between 22 to 46 months years of age at the time of enrollment,
21the impact was not significant. We do not find any significant impact on the incidence of stunting and underweight, neither at the aggregate level, nor by age group. These results are consistent with studies that suggest that even if wasting outcomes are affected in the short-term, the incidence of stunting and underweight need a longer-term intervention (UNICEF, 2013).
Table 7: Impact of Shombhob on nutrition outcomes
Mother's knowledge
about infant feeding
Dietary diversity
months) (6+
Stunting Under weight
Wasting 22-46 months
when enrolled
10-22 months when enrolled
Impact of Shombhob (δ) 0.063* 0.031 0.034 0.046 -0.036 -0.125*
(0.03) (0.05) (0.05) (0.05) (0.04) (0.07)
(T-C) at baseline (β) -0.015 -0.023 0.059** 0.103**
(0.04) (0.04) (0.03) (0.05)
Trend for non-recipients
(γ) 0.060 -0.083** -0.086*** -0.079
(0.04) (0.04) (0.03) (0.05)
Constant -0.222 -0.001 0.256 0.120
(0.43) (0.42) (0.35) (0.37)
Controls Yes Yes Yes Yes
R2 0.117 0.052 0.036 0.049 0.093
Df 1,536 1,594 1,552 606
Number Obs. 1,538 1,318 1,580 1,638 1,596 648
Significance levels: * p<0.10, ** p<0.05, *** p<0.01.Controls include: household head gender, age, education, household size, housing characteristics, asset ownership, remittances.
These results also lend some support to the widely held view that nutrition interventions
19
A standard practice recommended by Infant and Young Child Feeding Practices (IYFP).
20
Due to delays in program implementation, children aged 0-12 months at the time of the baseline survey were 10-22 months when the pilot implementation actually started.
21
Similarly, these children were 12-36 months old at the time of the baseline survey.
29
are perhaps most effective when given to children in the first 1,000 days of their lives covering pregnancy and the child’s first two years.
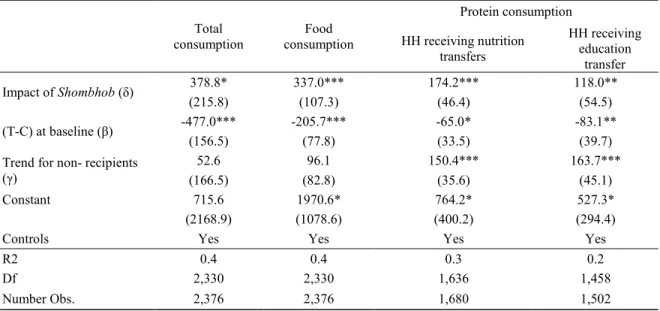
4.5 Impact on household welfare
We also estimate the impact of the project on household welfare. Out of the total sample, 65 percent received a single benefit of BDT 400 per month while the remaining households received two benefits amounting to BDT 800. On average, beneficiaries received a transfer of BDT 542 per month. In Table 8 we analyze the impact of cash transfers on per capita consumption, total household consumption, food consumption, as well as the consumption of the food with high protein content. The results are presented in Table 8. First, we find that there is a significant increase in the household consumption of beneficiaries of about BDT 379, or about 95 percent of the benefit size of BDT 400 or 70 percent of the average size of transfers received by the sample.
Table 8: Impact of Shombhob on consumption
Total
consumption Food
consumption
Protein consumption HH receiving nutrition
transfers
HH receiving education
transfer
Impact of Shombhob (δ) 378.8* 337.0*** 174.2*** 118.0**
(215.8) (107.3) (46.4) (54.5)
(T-C) at baseline (β) -477.0*** -205.7*** -65.0* -83.1**
(156.5) (77.8) (33.5) (39.7)
Trend for non- recipients
(γ) 52.6 96.1 150.4*** 163.7***
(166.5) (82.8) (35.6) (45.1)
Constant 715.6 1970.6* 764.2* 527.3*
(2168.9) (1078.6) (400.2) (294.4)
Controls Yes Yes Yes Yes
R2 0.4 0.4 0.3 0.2
Df 2,330 2,330 1,636 1,458
Number Obs. 2,376 2,376 1,680 1,502
Significance levels: * p<0.10, ** p<0.05, *** p<0.01.Controls include: household head gender, age, education, household size, housing characteristics, asset ownership, remittances.