IHS Economics Series Working Paper 278
December 2011
Minimum Wages, Labor Market Institutions, and Female Employment: A Cross-Country Analysis
John T. Addison Orgul Demet Ozturk
Impressum Author(s):
John T. Addison, Orgul Demet Ozturk Title:
Minimum Wages, Labor Market Institutions, and Female Employment: A Cross-Country Analysis
ISSN: Unspecified
2011 Institut für Höhere Studien - Institute for Advanced Studies (IHS) Josefstädter Straße 39, A-1080 Wien
E-Mail: o ce@ihs.ac.atffi Web: ww w .ihs.ac. a t
All IHS Working Papers are available online: http://irihs. ihs. ac.at/view/ihs_series/
This paper is available for download without charge at:
https://irihs.ihs.ac.at/id/eprint/2099/
Minimum Wages, Labor Market Institutions, and Female Employment:
A Cross-Country Analysis
John T. Addison, Orgul Demet Ozturk
278 Reihe Ökonomie Economics Series
278 Reihe Ökonomie Economics Series
Minimum Wages, Labor Market Institutions, and Female Employment:
A Cross-Country Analysis
John T. Addison, Orgul Demet Ozturk December 2011
Institut für Höhere Studien (IHS), Wien Institute for Advanced Studies, Vienna
Contact:
John T. Addison
Department of Economics Moore School of Business University of South Carolina 1705 College Street Columbia, SC 29208, U.S.A.
: ++1 803-777-4608 email: ecceaddi@moore.sc.edu Orgul Demet Ozturk
Department of Economics Moore School of Business University of South Carolina 1705 College Street Columbia, SC 29208, U.S.A.
: ++1 803-777-4904 email: odozturk@moore.sc.edu
Founded in 1963 by two prominent Austrians living in exile – the sociologist Paul F. Lazarsfeld and the economist Oskar Morgenstern – with the financial support from the Ford Foundation, the Austrian Federal Ministry of Education and the City of Vienna, the Institute for Advanced Studies (IHS) is the first institution for postgraduate education and research in economics and the social sciences in Austria. The Economics Series presents research done at the Department of Economics and Finance and aims to share ―work in progress‖ in a timely way before formal publication. As usual, authors bear full responsibility for the content of their contributions.
Das Institut für Höhere Studien (IHS) wurde im Jahr 1963 von zwei prominenten Exilösterreichern – dem Soziologen Paul F. Lazarsfeld und dem Ökonomen Oskar Morgenstern – mit Hilfe der Ford- Stiftung, des Österreichischen Bundesministeriums für Unterricht und der Stadt Wien gegründet und ist somit die erste nachuniversitäre Lehr- und Forschungsstätte für die Sozial- und Wirtschafts- wissenschaften in Österreich. Die Reihe Ökonomie bietet Einblick in die Forschungsarbeit der Abteilung für Ökonomie und Finanzwirtschaft und verfolgt das Ziel, abteilungsinterne Diskussionsbeiträge einer breiteren fachinternen Öffentlichkeit zugänglich zu machen. Die inhaltliche Verantwortung für die veröffentlichten Beiträge liegt bei den Autoren und Autorinnen.
Abstract
The authors investigate the employment consequences of minimum wage regulation in 16 OECD countries, 1970-2008. Their treatment is motivated by Neumark and Wascher’s (2004) seminal cross-country study. Apart from the longer time interval examined, a major departure is the authors’ focus on prime-age females, a group often neglected in the minimum wage literature. Another is their deployment of time-varying policy and institutional regressors. The average effects they report are consistent with minimum wages causing material employment losses among the target group. Their secondary finding is that minimum wage increases are more associated with (reduced) participation rates than with elevated joblessness. Further, although the authors find common ground with Neumark and Wascher as regards the role of some individual labor market institutions and policies, they do not observe the same patterns in the institutional data. Specifically, prime-age females do not exhibit stronger employment losses in countries with the least regulated markets.
Keywords
Minimum wages, minimum wage institutions, prime-age females, disemployment, participation, unemployment, employment protection, labor standards, labor market policies, unions
JEL Classification
J20, J38, J48, J58, J88
Comments
John T. Addison is Professor of Economics at University of South Carolina; Orgul Demet Ozturk is Assistant Professor of Economics at University of South Carolina. Sequential iterations of this paper were presented at the May 2011 Sixteenth Annual Meetings of the Society of Labor Economists in Vancouver, and seminars at the Institut für Höhere Studien (IHS) in Vienna, and the Institut für Arbeitsmarkt- und Berufsforschung (IAB) of the Bundesagentur für Arbeit (BA) in Nürnberg. The authors are indebted to participants for their insightful comments. In addition, they owe special thanks to David Neumark and William Wascher for supplying the data from their 2004 study, to Chris Ruhm for country data on parental leave, and to Per Skedinger for series on the ratio of the minimum wage to the aver 1. Introduction age wage in various Swedish industries.
Contents
1. Introduction 1
2. Previous Research 2
3. Theoretical Backdrop and Econometric Specification 7
4. Data 10
5. Findings 18
5.1 Basic Regression Results ... 18 5.2 The Augmented Model ... 25
6. Concluding Remarks 39
7. References 41
8. Appendix Tables 1 – 6 45
1. Introduction
There is comparatively little cross-country evidence on the effects of minimum wages on employment. This contrasts with the truly enormous literature on minimum wages. What evidence we have is contained in just two main empirical inquiries: an early study by the Organisation for Economic Co-operation and Development (OECD, 1998) looking at the effect of minimum wages on the employment-to-population ratio of both teenagers and young persons (as well as adults) for a sample of between 7 and 9 OECD countries, 1975-1996, and Neumark and Wascher‟s (2004) expanded analysis in this Review of 17 OECD nations, 1975-2000, focusing on teenagers and young adults (aged 15 to 24 years) but again looking at the employment-to-population ratio.
By contrast, the parallel and burgeoning literature on employment protection is largely rooted in cross-country comparisons. And importantly Neumark and Wascher‟s minimum wage study draws heavily (and presciently) on arguments from this literature that might be expected either to amplify or moderate the employment consequences of minimum wages (on which more below).1 Their study does not share the same breadth of outcome indicator, however, focusing instead on disemployment and eschewing consid- eration of labor-force participation and unemployment rates or other outcome indicators such as average hours worked.
In the present treatment, while further updating the period of analysis, we also seek to link the minimum wage and employment protection literatures. But our target group differs critically from that traditionally examined in the two literatures and espe-
1 This is an oversimplification to the extent that the existence of a minimum wage is sometimes present in the employment protection literature, where it is aggregated in a general measure of labor market (in)flexibility.
cially the minimum wage literature. That is, we will look at the labor market effects of minimum wages on workers other than teenagers and youths that are also at risk from wage minima, namely females aged 25 to 54 years. To the extent that this group of prime-age females includes low-productivity labor – reflecting their historically lower human capital accumulation due to interruptions in labor market experience and more limited access to education and training – the bite of minimum wages can also be expected to be material, and presumably more so in developing nations (Ozturk, 2006).
The impact of minimum wages may be underscored by the higher-valued outside options of females, which in turn suggests that a wider range of outcomes other than employment might usefully be considered, to include participation rates. Furthermore, the existence of youth subminima that have been found to ameliorate the adverse consequences of mini- mum wages among that target group might be expected to have just the opposite effect among adult females.
„Policy complementarities‟ invoked by the wider literature are also examined. To this end, we examine all the labor market institutions considered by Neumark and Wascher (2004) in their innovative analysis.2 As an additional refinement, we introduce time-varying measures of most such arguments. Only labor standards and in part the mechanics of minimum wage setting are one-off measures.
2. Previous Research
As mentioned earlier, despite the plethora of research on the employment and other consequences of minimum wages (see Neumark and Wascher, 2007), there is scant
2 We also considered the role of other labor market institutional and policy variables such as the tax wedge and the degree of coordination in collective bargaining, as well as some other mainstream arguments such as the output-gap. These proved mostly statistically insignificant and are not further discussed here.
cross-country analysis exploiting the tremendous variation in minimum wages by nation state.3 As further noted, the two principal analyses using panel data for industrialized nations are those of the OECD (1998) and Neumark and Wascher (2004).
The OECD study looks at the effect of minimum wages on the employment of teenagers, young adults, and prime-age adults for a small sample of countries, 1975- 1996.4 The countries are Belgium, Canada, France, Greece, Japan, the Netherlands, Portugal, Spain, and the United States. However, for the gender analysis, the sample is reduced to seven counties because of the lack of adequate series of average wages for Portugal and Spain.
The regressions follow the state-level panel data specifications now standard in the U.S. minimum wage literature. The dependent variable for the full sample is the em- ployment-to-population ratio for teenagers aged 15 to 19 years, youths aged 20 to 24 years, and adults aged 25 to 54 years. For the reduced seven-country sample, separate male and female subsamples of each group are used. The key minimum wage ratio is cal- culated separately for each group using the relevant average wage and allowing for youth rates where applicable. The employment population ratio is regressed on the ratio of minimum to median wages with controls for the business cycle (the prime-age male un- employment rate and/or the output gap), different institutional features (but see below), country trend effects, and fixed country effects.
Increases in the minimum wage measure are reported to have a negative impact on teenage employment across all specifications, albeit in some instances attendant upon the exclusion of Portugal and Spain. For the full (partial) sample of countries, in the
3 Although, for meta-analyses, see Card and Krueger (1995) and Boockmann (2010).
4 Note that the OECD study ranges further afield to investigate the impact of minimum wages on poverty and the income distribution and on wages and the wage distribution.
study‟s preferred specifications – with corrections for first-order autocorrelation for the error terms and heteroscedasticity across countries – a 10 percent increase in the mini- mum wage is associated with a fall in teenage employment of between 1.5 and 2 (2.7 and 4.1) percent. On the other hand, for young adults aged 20 to 24 years and for adult prime age males and females the elasticities are seldom statistically significant.5
The OECD study does not consider the role of labor market institutions/policies other than union density, the unemployment insurance (UI) replacement rate, and non- wage labor costs as a proportion of total costs (i.e. the tax wedge). (Nor for that matter does it report the respective coefficient estimates, just a summary of the estimated employment elasticities, partially documented above.) Of course, empirical analysis of the consequences of employment protection in particular has mushroomed since Lazear‟s (1990) pioneering study. Now-familiar institutions examined in addition to employment protection include active labor market policies, coordination in collective bargaining, and labor standards (e.g. Scarpetta, 1996; Nickell and Layard, 1999). More recent develop- ments have allowed for interactions between institutions and economic shocks and between the institutions themselves (e.g. Blanchard and Wolfers, 2000; Addison and Teixeira, 2003; Nickell, Nunziata, and Ochel, 2005).6 Yet more recent innovations have included the role of product market and business regulation, quality of industrial rela- tions, and even family ties and religion (see, inter al., Busse and Hefeker, 2007; Fiori et al., 2007; Addison and Teixeira, 2009, Alesina et al., 2010; Feldmann, 2007). Unlike the minimum wage literature, most such analyses have focused on cross-country differences.
5 Among teenagers, female elasticities always exceeded those of males but no such gender pattern obtained in the cases of youths and adults.
6 Coe and Snower (1997) were the first to provide the theoretical basis for expecting complementarities between the various labor market policies including the minimum wage.
The study by Neumark and Wascher (2004) is notable in attempting to bridge the gap between these two literatures, even if minimum wages have sometimes figured in the armory of labor market policies investigated in aggregate. Specifically, Neumark and Wascher investigate the effect of minimum wages on teenage and youth employment for seventeen countries over the (maximum) sample period 1976-2000. These countries include, in addition to those examined by the OECD (1998), Italy, Australia, Germany, Denmark, Sweden, Luxembourg, New Zealand, and the United Kingdom.
The dependent variable is the employment-to-population ratio for the particular demographic, although the minimum wage argument – the ratio of the minimum wage to the median wage – uses the adult minimum wage in the numerator and the all-worker average in the denominator. Neumark and Wascher‟s basic equation regresses the employment measure on a one-year lag of the minimum-to-median wage ratio, and con- trols for aggregate economic conditions and supply-side forces in the form of the adult unemployment rate and the ratio of the youth population to the adult population, respec- tively. The authors provide results for a simple OLS specification, fixed effect models with and without controls for year effects and time trends, and a dynamic version of the model estimated using the GMM technique. In all cases, including the latter, they obtain well-determined negative coefficient estimates for the minimum wage variable. For young adults the minimum wage elasticities range from -0.13 to -0.28, and for teenagers from -0.09 to -0.31.
The authors then augment their basic estimating equations with variables representing (a) characteristics of the minimum wage system, and (b) other labor market policies and institutions. Included under (a) a bargained minimum wage (the omitted
category is statutory minimum wage determination), subnational industry/regional wage minima, and youth subminima. Abstracting from the independent effects of the different types of minimum wage machinery, and focusing on the interaction terms from the authors‟ fixed effect and GMM specifications, it is reported that bargained minima are associated with a smaller negative employment impact of minimum wages and conversely where there are industry or geographic wage floors. As expected, youth sub- minima reduce the adverse effects of minimum wages on young persons‟ employment, especially in the case of teenagers.
The institutions included under (b) are labor standards, employment protection, active labor market policies, the unemployment insurance (UI) replacement rate, and union density.7 Again focusing on results from the preferred fixed effect and GMM specifications, the authors find evidence of certain complementarities. Thus, more restrictive labor standards and higher union density tend to exacerbate the disemployment effects of minimum wages, while stricter employment protection and active labor market policies appear to have the opposite effect. Of the institutional variables, only UI replacement rates appear to bear no relation to minimum wages – even if their indepen- dent effect is seemingly to reduce employment.
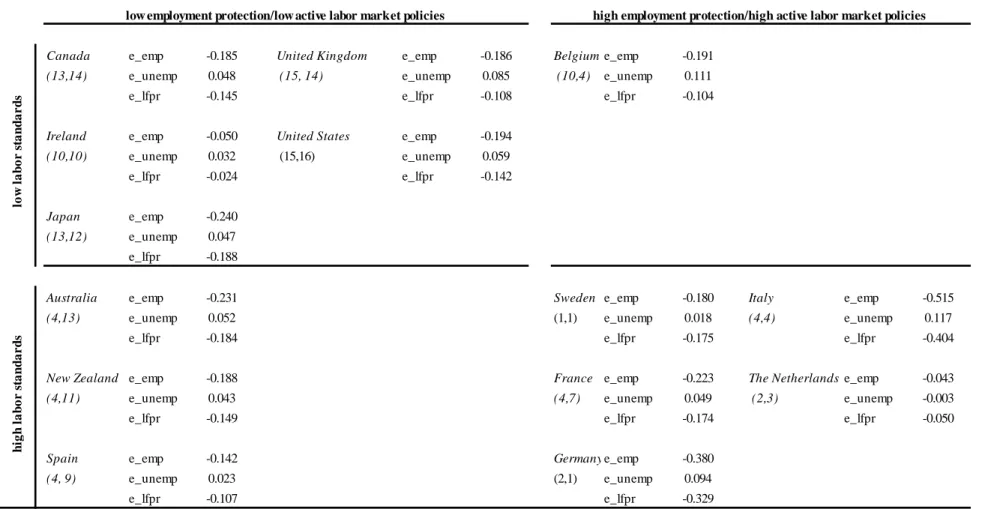
In a final application, Neumark and Wascher seek to erect a typology of minimum wage countries and investigate their component minimum wage elasticities. The catego- ries are fourfold: high employment protection/active labor market policies in combination with either high or low labor standards and low employment protection/active labor mar- ket policies again in combination with either high or low labor standards. It emerges that
7 The authors exclude from these regressions the prior institutional arrangements centering on the mechanics of minimum wage setting.
negative employment minimum wage effects are strongest for the group of countries having the least regulation, namely Canada, Japan, the United States and the United Kingdom.
3. Theoretical Backdrop and Econometric Specification
The theoretical model in this paper is implicit. It is in the spirit of Cahuc and Zylberberg (1999) and Coe and Snower (1997). Cahuc and Zylberberg offer a dynamic search and matching model with wage negotiations and employment protection (viz.
severance payments and limitations on dismissals), and introduce minimum wage setting into this framework to study its impact on job creation and job destruction. Their model implies that employment protection may strongly elevate unemployment of lower skilled workers when the minimum wage is high but have little impact where the minimum wage is low (or when wages are flexible). For their part, Coe and Snower develop a model of policy complementarities and show that policies/institutions that affect the bargaining power of incumbent employees, or that influence the search behavior of the unemployed, or that influence barriers to job creation can have complementary effects on unemploy- ment such that minimum-wage like measures that cost jobs can be magnified or ameli- orated according to the restrictiveness of the ruling labor market environment. Both models, then, capture the interaction of minimum wages with labor market rigidities and labor force characteristics, and imply that minima will be less disruptive when policies are less rigid.8
8 For theoretical implications based on the conjunction of wage rigidity and mandated benefits, see Kahn (2010).
The more obvious component of the model is the extent to which the minimum wage is effective. When the minimum wage is binding, the demand curve determines the level of employment for the given minimum wage; otherwise, equilibrium employment is a function of both demand and supply. We do not model the determinants of the proba- bility that the minimum wage will bind (see, inter al., Neumark and Wascher, 2002;
Addison et al., 2011) but simply attempt to capture its bite here by expressing the mini- mum wage as a ratio of the median wage.9 (As the latter argument is only available for all workers, we supplement it with a measure of the gender wage gap interacted with the minimum wage. The argument here is that the smaller the gap between males and females, the greater the implied relative skill level of females and the less likely they are to be adversely impacted by hikes in the minimum wage, although we will subsequently address the potential endogeneity of this variable.) Use of the minimum to median wage ratio also reduces the bias arising from the correlation between minimum wage levels and macroeconomic events affecting minimum wage levels.
Our econometric specification is as follows:
39 , , 1
; 16 , , 1
1 1
1
T t
I i
Z MW X
MW Z
X MW
t
Yit i t i it it i it it it i it
(1) where Yit is the prime-age female employment rate in country i and time t; MWit-1 is the minimum-to-median wage ratio; Xit and Zi are the time-varying and time-invariant supply, demand, and institutional arguments, respectively; αi indexes fixed country effects and λt
fixed year effects; θi captures the time trends in the outcome indicator for country i; and
it is an error term. The data cover 16 countries and the time frame is 1970 to 2008.
9 On the superiority of expressing the minimum wage as a ratio of the median as opposed to the average wage in international comparisons, see OECD (1998: 38).
Observe that although our primary focus is upon the adult female employment rate, we will also consider the corresponding labor force participation and unemployment rates as in the employment protection literature.10
The time-varying arguments in the vector Xit comprise our three base regressors and four conventional institutional regressors. The former comprise the adult male unem- ployment rate, the fertility rate, and the wage gap. The latter include employment protec- tion, union density, the unemployment insurance (UI) replacement rate, and active labor market policies. Finally, the time-invariant arguments in the vector Zi are two-fold: the labor standards index and the presence of a youth subminimum wage. Were it not for changes in the way minimum wages are fixed in the United Kingdom all three component measures of the minimum wage machinery would also have been time invariant. Given those changes, however, both bargained minimum wages and the presence of wage floors differentiated by region and/or industry are now time varying, albeit identified by the British changes alone, leaving only the youth subminimum component time invariant.
But note that all institutional components of the vectors Xit and Zi are interacted with the lagged minimum wage measure.
OLS and fixed effect versions of equation (1) were run. Additionally, we esti- mated our preferred dynamic version of the model by including the (relevant) lagged dependent variable as a regressor. As noted earlier, the Generalized Method of Moments (GMM) technique developed by Arellano and Bond (1981) is used to estimate the dynamic model.
10 After Lazear (1990), we contemplated also using average hours as a dependent variable but did not proceed with this indicator because female hours were available for just one-half of our sample.
4. Data
The data used in this inquiry are gathered from OECD online databases and pub- lished resources, and from the CEP-OECD Institutions Data Set (Nickell, 2006). The data in question cover employment-to-population ratios, unemployment rates, labor force participation rates, adult male unemployment rates (as a business cycle control), mini- mum wages and minimum wage rules, measures of labor market rigidity, the gender wage gap, and the fertility rate. OECD data on minimum wages are available where a national minimum wage is set by statute or by a national collective bargaining agreement.
For countries where no national minimum exists, but where industry- or occupation- specific minima are set by legislation or collective bargaining agreements, we use sum- mary estimates constructed by Dolado et al. (1996) as our base measure, following Neumark and Washer (2004). These estimates relate the minimum wage to average wages whereas the corresponding OECD values are based on the minimum-to-median wage ratio. However, a referee suggested that the data for the Nordic countries – here Sweden, Denmark, and Finland – were inappropriately low. In response to this concern, we re-estimated our employment models (a) dropping the Nordic group and (b) since most of the observations for the Nordic group pertain to Sweden, retaining the Nordic group but substituting four separate „sectors‟ for that country drawing on data kindly provided by Per Skedinger.11 The sectors in question are retail trade, hotels and restau- rants, food and bakeries, and an across-sector measure obtained by averaging in the cor- responding ratios for engineering, construction and slaughter houses to data from the three aforementioned sectors. However, in order to preserve ready comparisons with the earlier literature, our main tables preserve the Dolado et al. data, remitting our sensitivity analysis and the new estimations to appendix tables.
11 See Skedinger (2010).
First Observation Last Observation Average
Australia 0.65 (1985) 0.52 0.60 no no yes <21
Belgium 0.54 (1975) 0.5 0.54 yes no yes <21
Canada 0.48 0.41 0.41 no yes Province no
Denmark 0.55 0.54 (1994) 0.54 yes yes Industry yes <18
Finland 0.52 (1993) 0.52 (1993) 0.52 yes yes Industry yes <18
France 0.42 0.62 0.54 no no no Limited
Germany 0.57 0.58 (1994) 0.59 yes yes Industry no Some
Ireland 0.67 (2000) 0.52 0.54 no no yes <18
Italy 0.78 (1976) 0.71 (1991) 0.73 yes yes Industry no Some
Japan 0.78 (1975) 0.34 0.31 no yes Prefecture no
The Netherlands 0.58 0.42 0.52 no no yes <23
New Zealand 0.6 0.59 0.52 no no yes <20
Spain 0.7 0.44 0.43 no no yes <18
Sweden
0.53 (1975) 0.51
0.53
(0.79/0.80/0.83/0.73) yes yes Industry yes <24
United Kingdom 0.365 0.46 0.44 yes/no
Wages Councils [up to 1993] / statute
(after 1999)
yes /no [Industry] yes <21
United States 0.49 0.34 0.38 no yes State no Limited
Note: The information in the first and second columns refers to minimum-to-median (or minimum-to-mean) wage ratios in 1970 and 1978, respectively, unless otherwise stated. The figures in the third column give average values for the relevant ratio. The higher values shown here in parentheses for Sweden are taken from Skedinger (2010) and give minimum-to-mean wage ratios for four separate sectors (see text). The series from which the latter are drawn are used in our sensitivity analysis.
Sources: Minimum-to-median wage ratios are taken from the OECD online database for all countries, other than Denmark, Germany, Italy, Sweden, and the United Kingdom (before 1933) where we use estimates constructed by Dolado et al. (1996) as our base measure following Neumark and Wascher (2004). Minimum wage rules are from Neumark and Wascher (2004: 228) and the ILO TRAVAIL Legal database.
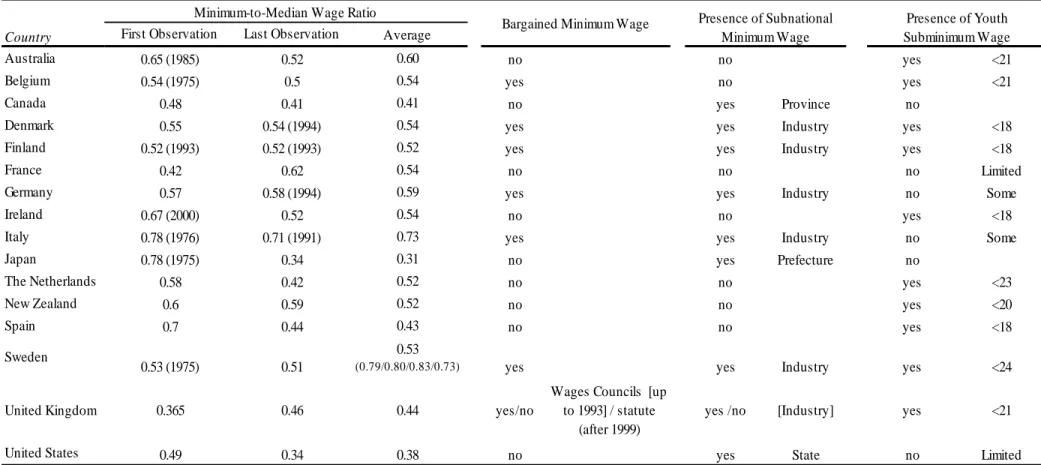
Table 1. Minimum Wage Levels and Rules
Country
Bargained Minimum Wage Presence of Subnational Minimum Wage
Presence of Youth Subminimum Wage Minimum-to-Median Wage Ratio
Most OECD countries have some sort of minimum wage policy. Table 1 provides information on these minima, as well as the machinery of minimum wage determination, for those countries for which we have been able to assemble consistent data on all variables. As is immediately evident, the countries differ not only in terms of the relative level of minimum wages – and hence in the potential bite of minimum wages – but also in rule setting. The first two columns of the table give the relative values of the minimum wage at two points in time, namely 1970 and 2008, unless otherwise stated. For most countries, minimum-to-median (or minimum-to-mean) wage ratios declined through time; the principal exceptions being France and the United Kingdom. European countries generally have higher relative values of the minimum wage than their non-European counterparts, including the United States. This empirical regularity has of course been noted in the wider literature and, taken in conjunction with the greater degree of labor market regulation obtaining in Europe, cited as a principal cause of that region‟s high un- employment rates (e.g. Siebert, 1997). We also give average values of the minimum wage in the third column of the table. The figures in parentheses for Sweden are taken from Skedinger (2010) and give the ratio of the minimum wage to the average wage in the four sectors mentioned earlier. As is evident, each value exceeds the Dolado et al.
measure.
The last three columns of Table 1 describe the minimum wage fixing machinery.
The first indicates how minimum wages are determined. Here „yes‟ signifies that the minimum wage is negotiated (i.e. set via bipartite or tripartite negotiations), while „no‟
signifies the wage is set by statute. For the United Kingdom we observe a switch in regimes from bargained (via tripartite wages councils) to statutory minimum wages over
the sample period. The fourth column shows whether the minimum wage is national in scope or instead varies across industries or regions; for example, in Japan the minimum wage varies across prefectures, whereas in the United States each state can set its own minimum exceeding the federal level.12 For our sample of countries, regional and industry variation is more common than a unified national minimum. The final column of the table indicates whether there are any subminimum wages for younger persons and, if so, the age at which they apply.13
12 The „new minimum wage research‟ in the United States has used this geographic variation to help identify employment effects, albeit in quite different ways (cf. Neumark and Wascher, 1992; Card and Krueger, 1994).
13 As noted by Neumark and Wascher (2004: note 18), the classification of minimum wage systems is inevitably open to some discretion, especially with respect to youth subminima. We follow their convention in treating the cases of Italy, France, Germany and the United States, where there is some such limited wage differentiation as having no such differentiation. On the broader question of Germany, where the differentiation stems from its famous apprenticeship system, there is of course the very much wider issue of whether that nation is properly classified as having minimum wages at all – at least prior to the recent posted workers act and latterly the introduction of minima for individual sectors such waste disposal. As a practical matter, the exclusion of Germany did not materially affect any of the major findings reported below or earlier; full results are available from the authors upon request.
Country Australia Belgium Canada Denmark Finland France Germany Ireland Italy Japan
The Netherlands New Zealand Spain Sweden
United Kingdom United States Total
correlation with the lagged minimum wage measure
0.068 (0.044)
0.287 (0.070) 0.225 (0.090)
-0.716 Sources: The labor market indicators (including unemployment rates) are taken from the OECD.Stat online data base. Fertility rates are from the OECD Family data base. The wage gap is the difference between median male and female wages expressed as a percentage of the male median wage. This variable is generated using OECD data. The mean wage ratio is used instead for The Netherlands, downloaded from www.oecd.org/dataoecd/9/59/39606921.xls. The fertility rate and wage gap variables are standardized for the regressions.
0.042 0.155 0.508 0.773
0.619 (0.152) 0.664 (0.156)
0.806 (0.066) 0.836 (0.072) 0.036 (0.022) 1.778 (0.174) 0.172 (0.019)
1.814 (0.400) 0.653 (0.088) 0.688 (0.089) 0.052 (0.012) 1.968 (0.149)
0.691 (0.036) 0.726 (0.031) 0.048 (0.014) 2.152 (0.330) 0.162 (0.069)
0.701 (0.045) 0.742 (0.033) 0.057 (0.021) 1.829 (0.175) 0.307 (0.075) 0.603 (0.050) 0.621 (0.058) 0.028 (0.012) 1.619 (0.272) 0.379 (0.038)
0.403 (0.131) 0.479 (0.164) 0.145 (0.085) 1.765 90.630) 0.231 (0.060) 0.469 (0.162) 0.509 (0.161) 0.084 (0.051) 2.523 (0.702) 0.190 (0.045)
0.518 (0.184) 0.548 (0.193) 0.054 (0.033) 1.682 (0.223) 0.237 (0.046) 0.643 (0.076) 0.705 (0.098) 0.084 (0.033) 1.903 (0.203) 0.164 (0.058)
0.444 (0.097) 0.490 (0.117) 0.088 (0.039) 1.561 (0.394) 0.166 (0.011) 0.792 (0.023) 0.848 (0.018) 0.066 (0.021) 1.719 (0.171) 0.132 (0.012)
0.611 (0.091) 0.657 (0.112) 0.066 (0.027) 1.442 (0.163) 0.252 (0.022) 0.609 (0.087) 0.678 (0.077) 0.104 (0.031) 1.709 (0.170) 0.122 (0.031)
0.785 (0.040) 0.831 (0.042) 0.055 (0.035) 1.727 (0.086) 0.227 (0.026) Table 2a. Means (Standard Deviations) of Labor Market Outcomes, and Gender Variables
Employment-to- Population Ratio
Labor Force Participation
Rate (LFPR) Unemployment Fertility
0.672 (0.087) 0.726 (0.088) 0.075 (0.015) 1.679 (0.174) 0.271 (0.129) Wage Gap 0.586 (0.094) 0.619 (0.101) 0.052 (0.015) 1.969 (0.295) 0.170 (0.026)
There are also significant cross-country differences in the extent of labor market regulation, socio-demographics, and labor market activity, as charted in Tables 2a and 2b.
Beginning with the outcome indicators in Table 2a, although the observed changes in female labor force participation rates are consistent with the general worldwide trend (in- creasing in all of the countries over the thirty-nine year period), participation rates vary sometimes quite considerably. Thus, at any point in time, Italy, and Spain have signifi- cantly lower participation rates when compared with other countries, and especially the Nordic nations of Finland, Denmark, Norway and Sweden. Participation rates are one of the margins investigated in the present treatment because minimum wages, and other rigidities, may inhibit low productivity workers from actively seeking employment once unemployed. On the other hand, they may encourage the labor market entry of other such individuals (see, for example, Mincer, 1976).
Employment-to-population ratios rose significantly in all countries other than Sweden and Finland, where the observed changes were modest. Although employment rates do vary markedly across countries – from just 40.3 percent in Spain to 80.6 percent in Sweden – it is unemployment rates that show the greatest variance over the sample period. Even if by the early 2000s unemployment rates were close to their 1980 values, most European countries experienced very high unemployment in the intervening years.
And the female unemployment rate actually rose from 1.7 percent in 1970 to 6.6 percent in 2009.
In general, fertility rates declined significantly over the sample period; the excep- tions being Norway, the United Kingdom, the Netherlands, and Sweden. In the 1980s the fertility rate averaged 2.5 children per woman cross all OECD countries. By 2004 this
average had declined to 1.8 children (and was even as low as 1.6 children during the late 1990s). Child birth is the main reason for interruptions in a woman‟s work life and caring for young children either keeps women off the market or directs them to careers that permit flexibility to balance work and family. Such interruptions and career choices imply lower wages for women vis-à-vis men of the same age and education.
The wage gap given in the last column of Table 2a is the difference between median male and female wages expressed as a percentage of the median male wage. As noted earlier, this variable was included to capture the existence of gender differences in occupational choice and education that might be expected to affect the bite of minimum wages in the case of females. Historically, females have had lower rates of labor market attachment and have tended to concentrate in lower-paying occupations, both of which tendencies make them susceptible to minimum wage-induced disemployment. As can be seen from the table, the wage gap averaged 22.5 percent over the period, ranging from 12.2 percent in Belgium to 37.9 percent in Japan.
Country
Labor Standards
Index Employment Protection Active Labor Market Policies Union Density Unemployment Insurance Replacement Rate
Australia 3 0.335 (0.048) 5.685 (0.667) 5.468 (9.443) 23.12 (3.368)
Belgium 2 0.955 (0.159) 15.04 (1.924) 12.87 (23.23) 42.45 (2.556)
Canada 1 0.270 (0.000) 6.026 (0.369) 7.381 (13.21) 17.58 (2.339)
Denmark 2 0.655 (0.146) 24.58 (6.306) 25.96 (34.85) 50.11 (8.053)
Finland 3 0.733 (0.043) 15.41 (5.129) 17.99 (32.49) 30.98 (7.488)
France 3 0.929 (0.105) 10.04 (1.480) 2.318 (4.070) 33.82 (6.257)
Germany 4 0.970 (0.128) 18.76 (4.020) 5.370 (9.493) 28.45 (1.101)
Ireland 2 0.297 (0.052) 16.34 (6.526) 13.48 (17.99) 29.09 (6.312)
Italy 3 1.049 (0.235) 11.11 (0.533) 7.949 (14.14) 13.19 (14.45)
Japan 1 0.677 (0.049) 4.787 (1.120) 4.683 (8.306) 9.988 (1.793)
The Netherlands 4 0.845 (0.090) 30.64 (12.36) 5.197 (9.212) 51.32 (2.803)
New Zealand 3 0.350 (0.088) 11.69 (2.849) 5.249 (9.226) 29.01 (1.814)
Spain 3 1.184 (0.141) 4.105 (1.222) 3.241 (5.853) 30.17 (8.196)
Sweden 5 0.889 (0.268) 48.72 (19.13) 18.19 (32.66) 23.86 (6.379)
United Kingdom 0 0.202 (0.022) 7.582 (1.484) 7.155 (12.56) 19.86 (3.361)
United States 0 0.070 (0.000) 3.587 (0.349) 2.949 (5.170) 12.86 (1.301)
Total 2.434 (1.370) 0.651 (0.359) 14.63 (13.15) 9.090 (19.02) 27.87 (13.32)
correlation with the lagged
minimum wage measure 0.658 -0.119 0.436 0.031 0.711
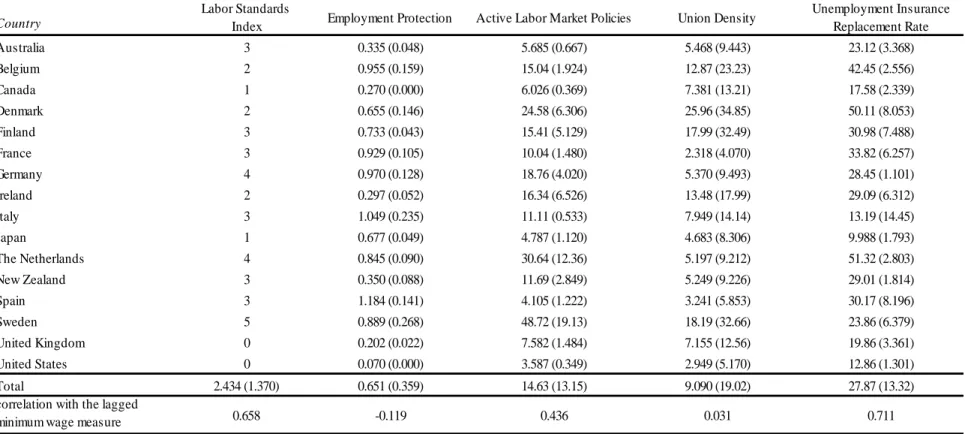
Table 2b. Means (Standard Deviations) of Labor Market Structural Variables
Sources: The labor standards index is as described by Neumark and Wascher (2004: 237). It refers to the situation as of 1993 and is taken from the OECD Jobs Study (1994) and specifically excludes the contributions of minimum wages and employment protection policies. The employment protection variable is taken from Nickell (2006) and is the employment protection legislation data from the OECD.Stat using Version 1of that indicator: the strictness of employment protection legislation. Nickell (2006) extends this data using Blanchard and Wolfers (2000). These data are available only until 2004, with 2004 values being used for later years. The union density measure is again taken from Nickell (2006) and is calculated as union membership divided by employment, using administrative and survey data from the OECD labor market statistics data base. This base measure is then extended by splicing in data from Visser (2006). These data are available only until 2004, with 2004 values being used for later years. The unemployment insurance replacement rate is the original benefit replacement rate data published by the OECD. These data are also available only until 2004, with 2004 values again being used for later years. The active labor market policies variable is taken from Nickell (2006). It is calculated as expenditures divided by the unemployment rate. These data are available only until 2004; missing values are now interpolated using unemployment and GDP measures. All variables are standardized for the regressions.
Finally, there are striking differences in the labor market conditions and institu- tions of countries in the data, which can potentially shape the manner and the intensity with which minimum wages affect the outcome indicators. Thus, for example, one can readily envisage how any (dis)employment effects of minimum wages might be ampli- fied by other labor market rigidities, such as national restrictions on hours adjustment or the use of flexible contracts. However, if there are also institutions in place that help the unemployed locate jobs, the frictions resulting from the impedimenta of minimum wage changes may be considerably attenuated. For these reasons, as noted earlier, we include in the model measures of labor standards, of the strictness of employment protection laws, of the extent of active labor market policies, of the generosity of UI replacement rates, and of the degree of unionization rates. Table 2b provides the descriptive statistics.
5. Findings 5.1 Basic Regression Results
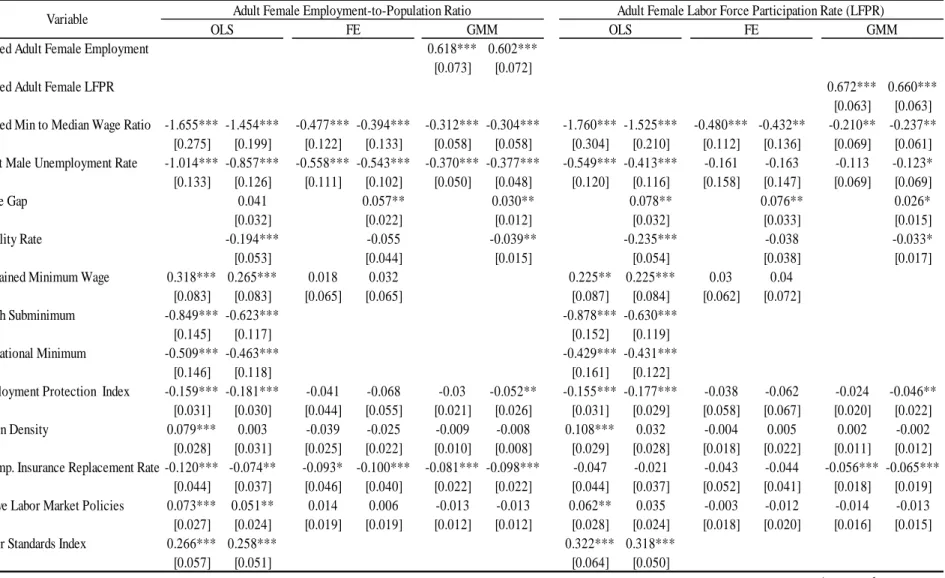
Our initial cet. par. results are provided in Table 3 for the adult female employ- ment-to- population ratio and the adult female labor force participation rate, although we shall focus on the former. (Results for the adult female unemployment rate are remitted to Appendix Table 3.) Each of the OLS results given in the first three columns of the table excludes country fixed effects. The results in the first column include our wage gap and fertility arguments but no country-specific trend and year fixed effects. This specification reveals a well-determined negative association between the minimum wage argument and female employment and the expected negative coefficient estimate for the general labor demand measure, namely the adult male unemployment rate. For their part, and less and
more obviously perhaps, the coefficients for the wage gap and fertility are also negative, but their interaction terms are both positive. The implication is that the net effect of the wage gap (fertility rates) on employment is negative if the ratio of the minimum wage to the media wage is less than 2.29 (0.34). But as a practical matter, the diagnostics at the foot of the table indicate that we can reject the restriction that the year and country con- trols and time trends are excludable.
0.704*** 0.681***
[0.070] [0.072]
0.708 0.699***
[0.000] [0.075]
-0.306*** -0.477*** -0.279*** -0.139 -0.114*** -0.063*** -0.062*** -0.328*** -0.313*** -0.485*** -0.134 -0.109** -0.037 -0.035**
[0.063] [0.088] [0.067] [0.088] [0.034] [0.022] [0.020] [0.067] [0.067] [0.095] [0.078] [0.041] [0.000] [0.017]
-0.614*** -0.966*** -0.588*** -0.645** -0.622*** -0.355*** -0.367*** 0.085 -0.125 -0.481** -0.182 -0.183 -0.101 -0.111*
[0.204] [0.186] [0.182] [0.134] [0.122] [0.052] [0.049] [0.201] [0.185] [0.189] [0.162] [0.152] [0.000] [0.059]
-0.096*** -0.02 0.071*** 0.017** -0.085*** -0.025 0.071*** 0.013
[0.020] [0.022] [0.016] [0.009] [0.021] [0.022] [0.018] [0.009]
-0.202*** -0.579*** 0.012 0.009 -0.196*** -0.665*** 0.007 -0.001
[0.046] [0.093] [0.032] [0.016] [0.045] [0.097] [0.037] [0.017]
Lagged Minimum-to-Median Wage Ratio interacted with:
Wage Gap 0.042 -0.064 -0.160*** -0.035* 0.001 -0.059 -0.158*** -0.030*
[0.049] [0.054] [0.034] [0.018] [0.053] [0.054] [0.041] [0.017]
Fertility Rate 0.586*** 1.325*** 0.042 -0.016 0.526*** 1.432*** -0.002 -0.013
[0.095] [0.173] [0.076] [0.040] [0.096] [0.186] [0.090] [0.040]
Constant 0.843*** 0.640*** 0.681*** 0.454*** 0.416*** 0.165*** 0.167*** 0.853*** 0.696*** 0.692*** 0.455*** 0.431*** 0.146 0.151***
[0.026] [0.039] [0.035] [0.046] [0.022] [0.024] [0.025] [0.027] [0.039] [0.039] [0.039] [0.026] [0.000] [0.024]
-0.394*** -0.463** -0.279*** -0.139 -0.106* -0.063*** -0.056*** -0.403*** -0.513** -0.485*** -0.134 -0.095 -0.037 -0.030***
[0.096] [0.222] [0.067] [0.088] [0.065] [0.022] [0.014] [0.086] [0.239] [0.095] [0.078] [0.063] [0.000] [0.012]
Country Fixed Effects NO NO NO YES YES YES YES NO NO NO YES YES YES YES
Year Fixed Effects NO YES YES YES YES YES YES NO YES YES YES YES YES YES
Country Specific Time Trends NO YES YES YES YES YES YES NO YES YES YES YES YES YES
Observations 339 339 339 339 339 307 307 339 339 339 339 339 307 307
R-squared 0.527 0.889 0.847 0.982 0.985 0.514 0.882 0.834 0.983 0.985
Number of Countries 16 16 14 14 16 16 14 14
Hausman / Sargan tests (p-values) 0.000 0.000 0.000 0.000 0.000 0.000 - 0.000 0.000 0.000 0.000 0.000 0.000 -
Notes:Hubert-White robust standard errors are given in parenthesis. The STATA xtreg command reports a constant for the fixed effects regressions: It is the mean of all country-specific effects. The Hausman specification test is for the exclusion of year and country controls and time trends in the first specification, for the exclusion of the country fixed effect in the second specification, and for the exclusion of the wage gap and fertility variables and their minimum wage measure interactions in the third, fourth and sixth specification for each outcome variable. We also use the Hausman test to determine whether the assumption of no correlation between the error terms and the independent variables is correct. As this restriction is rejected in all specifications, we only report the fixed effects regression
*Statistically significant at the .10 level, ** at the .05 level, *** at the .01 level.
FE GMM FE GMM
Lagged Adult Female LFPR Lagged Min-to-Median Wage Ratio Adult Male Unemployment Rate Wage Gap
Variable
Fertility Rate
Minimum Wage Elasticity
Table 3. Estimates of the Standard Minimum Wage Model Using International Data
Adult Female Employment-to-Population Ratio Adult Female Labor Force Participation Rate (LFPR)
OLS OLS
Lagged Adult Female Employment
Turning therefore to the results in the second column of the table, the coefficient estimate for the minimum wage variable is somewhat higher in absolute terms than before. The same is true of the other coefficients with the exception of the wage gap.
Moreover, the wage gap-minimum wage interaction term is now also negative – as is to be expected if the wage gap is an inverse measure of the skill level of the female work- force with a greater wage gap implying an increased bite of the minimum wage – sug- gesting that wage gap effects are reinforcing in reducing female employment. As before, higher fertility is associated with reduced employment but the interaction term is positive.
In this case, the net effect of higher fertility rates on female employment is negative if the minimum-to-median wage ratio is less than 0.44. The estimated minimum wage elastic- ity, computed as the coefficient on the minimum wage variable plus each of the coeffi- cients on the interaction terms multiplied by the standardized values of the corresponding covariates, indicates that a 10 percent increase in the lagged minimum wage variables minimum wage gap variable is associated with a 4.6 percent fall in female employment, which is of course a high value for developed nations. But again the bottom line diagnos- tic is that the exclusion restriction (here an absence of country fixed effects) is again contraindicated.
In the third column of the table, we report results from dropping the fertility and wage gap variables on the grounds of their potential endogeneity. For example, if mini- mum wage hikes narrow the wage gap, this should lead to an understatement of the effect of minimum wages on employment in equations containing both arguments (see, in par- ticular, Blau and Kahn, 2003, on the effect of wage floors on female relative wages).
Observe however that in this specification excluding both arguments reduces rather than increases the absolute magnitude of the lagged minimum wage coefficient.
Given the indication that country effects are important, what are the consequences of controlling for country fixed effects as well as year fixed effects and country specific time trends? The results are given in the fifth column of Table 3. The most obvious effect is of course a marked fall in the coefficient estimate for the minimum wage variable, indicating that a sizable part of the effect obtained earlier does, as expected, reflect country-specific factors. But the lagged minimum wage argument remains highly significant, even if the estimated minimum wage elasticity (of -0.106) on this occasion is only marginally statistically significant. The coefficient estimate for the demand argu- ment (the adult male unemployment rate) remains highly significant albeit reduced in absolute magnitude. Interestingly, the own effect of the wage gap variable effect is now positive and well determined, while its effect when interacted with lagged minimum wage is strongly negative. The implication is that the net effect of the wage gap on employment is negative if the minimum wage ratio exceeds 0.44. The own and interac- tion effects of fertility are positive and reinforcing although neither coefficient estimate is statistically significant. On this occasion, the results of dropping the wage gap and fertility rate variables – shown in the fourth column of the table – are more modest than before. That is, the absolute magnitude of the lagged minimum wage coefficient increases rather modestly in absolute magnitude.
Our preferred estimates are given in the seventh column of the table for the dynamic employment model. These GMM estimates do indicate a further diminution in the point estimate of the lagged minimum wage coefficient but both it and the minimum