Research Collection
Journal Article
Impact of a split injection strategy on mixing, ignition and
combustion behavior in Premixed charge compression ignition combustion
Author(s):
Doll, Ulrich; Barro, Christophe; Todino, Michele; Boulouchos, Konstantinos Publication Date:
2021-06-15 Permanent Link:
https://doi.org/10.3929/ethz-b-000474261
Originally published in:
Fuel 294, http://doi.org/10.1016/j.fuel.2021.120511
Rights / License:
Creative Commons Attribution 4.0 International
This page was generated automatically upon download from the ETH Zurich Research Collection. For more
information please consult the Terms of use.
Fuel 294 (2021) 120511
Available online 8 March 2021
0016-2361/© 2021 The Author(s). Published by Elsevier Ltd. This is an open access article under the CC BY license (http://creativecommons.org/licenses/by/4.0/).
Full Length Article
Impact of a split injection strategy on mixing, ignition and combustion behavior in Premixed charge compression ignition combustion
Ulrich Doll
a,*, Christophe Barro
b,c, Michele Todino
d, Konstantinos Boulouchos
baPaul Scherrer Institute, Experimental Thermal-Hydraulics Group, Forschungstrasse 111, CH-5232 Villigen PSI, Switzerland
bETH Zürich, Institute for Energy Technology, Laboratory for Aerothermochemistry and Combustion Systems, Sonneggstrasse 3, CH-8092 Zürich, Switzerland
cVir2sense GmbH, Sihlbruggstrasse 109, 6340 Baar, Switzerland
dIstituto Motori, IM-CNR, Viale Marconi, Napoli, Italy
A R T I C L E I N F O Keywords:
Low temperature combustion Premixed Charge Compression Ignition Split injection schedule
High-speed laser-optical diagnostics Mixing dynamics
Ignition dynamics
A B S T R A C T
Mixing, ignition and combustion behavior in a rapid compression and expansion machine operated under Pre- mixed Charge Compression Ignition (PCCI) relevant conditions are investigated by combined passive optical and laser-optical high-speed diagnostics. The PCCI concept is realized using a split injection schedule consisting of a long base load injection and two closely separated short injections near top dead center. Previous studies of close- coupled double injections under constant ambient conditions showed an increased penetration rate of the sub- sequent fuel spray. However, the aerodynamic gain from the preceding injection is counteracted by the density rise during the compression stroke under transient engine conditions. The study confirms that the rate of mixing of the subsequent fuel spray is significantly increased. Regarding combustion behavior, the thermodynamic analysis exhibits contributions of low temperature oxidation reactions of more than 20% to the total heat release, with a notable amount of unburnt fuel mass varying from 25 to 61%. The analysis of the optical data reveals the multi-dimensional impact of changes in operating parameters on the local mixture field and ignition dynamics.
The onset of low temperature reactivity of the first short injection is found to be dominated by the operating strategy, while the location is strongly related to the local mixing state. Low temperature ignition of the consecutive fuel spray is significantly promoted, when upstream low temperature reactivity of the preceding injection is sustained. Likewise, it is shown that high temperature ignition is accelerated by the entrainment of persistent upstream low temperature reactivity.
1. Introduction
The need both to reduce CO2 emissions as well as to meet aggravated pollutant emission targets poses significant challenges to the mobility sector. In this context, low temperature combustion (LTC) concepts for direct-injection diesel engines are of great interest, since they have the potential to increase overall engine efficiency while at the same time reducing pollutant NOx and soot emissions [1]. In contrast to the mixing controlled combustion in conventional diesel engines, promising LTC concepts such as Homogeneous Charge Compression Ignition (HCCI) employ extensive premixing to create a homogeneous lean fuel–air cylinder charge. This charge then simultaneously auto-ignites at multi- ple spots towards the end of the compression stroke, resulting in faster heat release and pressure rise at significantly lower peak temperatures [2]. Being beneficial in terms of emissions and efficiency, however, a
potential drawback of the HCCI concept lies in the challenging control of the combustion process. Other than in fuel mixing controlled conven- tional diesel or spark-ignited gasoline combustion, the HCCI rate limiting process is reaction kinetics, which are influenced by a complex interplay of mixture preparation and temperature control of ignition timing through intake air heating, exhaust gas recirculation (EGR) or exhaust valve closing timing [1,3–6]. In this context, hybrid combustion concepts such as Premixed Charge Compression Ignition (PCCI) offer a huge potential to combine high efficiency/low emission characteristics of HCCI with the superior operability of conventional diesel combustion [5]. In PCCI, the rate limiting processes from conventional diesel (mixing) and HCCI (reaction kinetics) are approaching similar levels.
This can either be achieved by the choice of the fuel, which affects the reaction kinetics or by the choice of the injection strategy, which affects the mixing. The current work focuses on the injection strategy.
The PCCI combustion strategy involves fuel injection early in the
* Corresponding author.
E-mail address: ulrich.doll@psi.ch (U. Doll).
Contents lists available at ScienceDirect
Fuel
journal homepage: www.elsevier.com/locate/fuel
https://doi.org/10.1016/j.fuel.2021.120511
Received 12 October 2020; Received in revised form 6 January 2021; Accepted 16 February 2021
compression stroke allowing for a certain degree of in-cylinder pre- mixing in order to keep combustion temperatures low and, thereby, avoiding NOx and soot formation. In general, ignition control in PCCI is achieved through high EGR rates [7] or variations of initial conditions such as varying temperature, pressure or fuel reactivity by blending with low cetane fuels [5]. In addition to above control mechanisms influ- encing combustion chemistry and in contrast to the HCCI approach, PCCI implementations retain the coupling between start of injection and start of combustion [5,8]. The latter is especially attractive since it offers the opportunity to use standard injection systems instead of specialized hardware. The current study aims at investigating the mixing and igni- tion fundamentals of PCCI combustion in applying multiple injections.
Fuel split by multiple injections is an established strategy to reduce pollutant emissions in diesel combustion while increasing fuel economy [9–12]. Additionally, multiple injections can be applied to tailor fuel–air mixing [13–15] and ignition timing [14,15] as well as to reduce un- burned hydrocarbons (UHC) and CO by preventing fuel wetting and flame quenching at the piston wall [14,16,17]. However, understanding of the complex interplay between the relevant operational parameters, fuel–air mixing and combustion chemistry affecting the PCCI combus- tion process is still scarce and optical diagnostics play a crucial role in providing detailed spatially and temporally resolved insights into the underlying mechanisms. A detailed study of the mixing and combustion behavior of short double diesel injections in a constant volume cell (CVC) was carried out by Bruneaux and Maligne [18]. The authors observed significantly enhanced mixing at the spray tip of the second jet caused by the flow field of the preceding injection. In addition, it was found that low-temperature combustion intermediates of the first in- jection were entrained by the subsequent jet, leading to an accelerated high-temperature ignition process. In [19], the study of double in- jections of n-dodecane by Schlieren imaging and planar laser induced fluorescence (PLIF) of formaldehyde within a CVC confirmed faster penetration and mixing rates of the second jet by entering a kind of
“slipstream”, thus benefiting from the sustained momentum and tur- bulence of the previous injection. In support of the findings of [18], the authors conclude that the ignition delay of the second jet is significantly reduced by the interaction with cold-flame reaction products of the first injection. At varying ambient temperatures from 900 K to 750 K, com- bustion efficiency was reduced from 95% to 75% and a persistent formaldehyde PLIF signal was associated with an incomplete high-
temperature combustion process. By investigating the spray tip pene- tration of double injection schemes in an optical two-stroke engine using Schlieren diagnostics, Desantes et al. [20] confirmed the “slipstream” hypothesis and found a distinct relationship of faster penetration rates and shorter dwell times between injections as well as reduced ignition delays of the second compared to the preceding jet.
Even though above works provided valuable insights into how multiple injections influence mixing and combustion processes, dis- cussed results were predominantly obtained at constant ambient den- sities and, therefore, lack the transient behavior of a full engine cycle. In addition, the studies focus on the interaction between the consecutive injections or mixing behavior of single injections rather than providing necessary operational characteristics for PCCI strategies such as mixture preparation. In this context, the current study aims at providing detailed insight into mixing and combustion behavior within an optically accessible rapid compression and expansion machine (RCEM) operated on a split injection PCCI strategy by means of passive optical and laser- optical high-speed diagnostics. In a first measurement campaign, igni- tion and combustion were characterized by performing combined OH*
chemiluminescence, Schlieren and formaldehyde (CH2O) planar laser induced fluorescence (PLIF) measurements. While from the first appearance of OH* kernels the onset of high-temperature (HT) com- bustion is determined, CH2O serves as an indicator for preceding low temperature (LT) fuel oxidation reactions. In a second experimental campaign, TMPD1 tracer PLIF under inert conditions was used to study the effect of applying multiple injections on pre-ignition fuel–air-mix- ing. In order to identify a pertinent liquid core and the boundaries of the fuel spray, tracer PLIF was combined with Mie scattering and an addi- tional Schlieren setup. The optical data is used to extract global jet metrics, to explore the influence of varying operational parameters on the in-plane mixing state and to discuss the resulting ignition and combustion dynamics. The analysis of optical data is complemented by a comparison of the jet metrics with literature correlations as well as a comprehensive thermodynamic analysis of global heat release rates and fuel consumption, finally linking the observed findings to engine oper- ation and efficiency.
Abbreviations
BDC Bottom Dead Center
CFD Computational Fluid Dynamics CVC Constant Volume Cell EGR Exhaust Gas Recirculation
HCCI Homogeneous Charge Compression Ignition HRR Heat Release Rate
HT High Temperature LT Low Temperature
LTC Low-Temperature Combustion MFB Mass of Fuel Burnt
OP Operating Point
PCCI Premixed Charge Compression Ignition PDF Probability Density Function
PLIF Planar Laser Induced Fluorescence RCEM Rapid Compression and Expansion Machine rms root mean square
SOI Start Of Injection TDC Top Dead Center UHC Unburned Hydrocarbons
List of Symbols
Φ,〈Φ〉,Φ Equivalence ratio, ensemble averaged, cross-sectional average
ρair Air density [kg/m3] ρa Charge density [kg/m3]
ϕ TMPD fluorescence quantum yield
AFRstoich Stoichiometric air–fuel-ratio for n-heptane-air mixtures
I Background corrected CH2O-PLIF intensity I0 Incident laser energy
Iff Flat-field image
K PLIF-intensity to fuel density conversion factor P Probability
Pa Charge pressure [Pa]
Pf Fuel pressure [Pa]
S Spray penetration length [mm]
T Temperature [K]
x,r Axial, radial coordinate [mm]
t Time after start trigger [ms]
a0 Spray model calibration parameter d0 Nozzle reference diameter [mm]
p Pressure [Pa]
1 n,n,n’,n’-tetramethyl-1,4-phenylenediamine
2. Experimental setup and evaluation methodology 2.1. Rapid compression and expansion machine
The RCEM used herein is a free-floating piston test rig with excellent optical accessibility and flexible operating parameters such as compression ratio, charge pressure and temperature with the capability to perform a compression and expansion cycle similar to an engine. The working principle of the RCEM is illustrated in Fig. 1. Pressurized air moves the mass balance piston, which in turn pushes the working piston towards the cylinder head. The free-floating working piston is acceler- ated until it approaches top dead center (TDC) and, thereby, compresses the combustible fuel–air mixture. Expanding gases in the combustion chamber are then forcing the working piston back towards bottom dead center (BDC). Both, TDC and BDC are depending on the driving pressure, the charge pressure and the converted energy as well as the combustion strategy. The machine’s main bore has a diameter of 84 mm, the maximum stroke can be varied and was set to 245 mm. A solenoid injector with a 100 µm single conical coaxial nozzle was mounted on the cylinder periphery (5 mm below the flat cylinder head, 42.5 mm from the cylinder axis and inclined 5◦ towards the piston). The cylinder pressure is measured with a combination of an absolute pressure sensor in a switch adapter (recording the pressure until 5 bar) and a relative pressure sensor, which is pegged during the beginning of the cycle. The cylinder pressure and the piston position are recorded at a rate of 100 kHz during operation. Piston, liner and cylinder head walls are heated to the specified temperature with multiple heating elements and the set temperature is feedback controlled using thermocouples at different positions. Optical accessibility to the combustion chamber is realized by means of a mirror within the slotted shaft of the working piston (a transparent flat piston bowl with 4 mm depth), a window at the cylinder head (diameter 52 mm) and another window with 40 mm in diameter at the side. A more detailed description of the machine and further oper- ational characteristics can be found in [21–24].
2.2. Operating strategy and heat release rate analysis
In order to achieve the desired conditions for PCCI operation with multiple injections, it was found that the most suitable strategy con- sisted of a comparatively long first injection to provide the necessary base mixture, followed by two short pulses closely spaced to TDC. The main goals were to avoid high temperature combustion before the last injection was partially premixed as well as to remain within the visible domain, so that mixing and ignition could be observed by the optical
diagnostics. N-heptane was selected as mono component surrogate diesel fuel because of the similar cetane numbers. The fuel injection pressure was set to 600 bar for all operating points (OPs). In case of the non-reactive measurements, the liquid fuel was blended with the TMPD tracer substance at a concentration of 1.5 g/l.
The resulting operating strategy is summarized in Fig. 2. All injection sequences as well as the optical data acquisition were started by a trigger event initiated during the compression stroke as soon as the accelerating working piston reached a distance of 190 mm with respect to the cyl- inder head. Unless stated otherwise, time axes within the manuscript are referring to that instance in time. Ten repetitions at each OP were car- ried out. The top panel of Fig. 2 shows representative time traces of ensemble averaged piston pressure and piston clearance at reactive OP1.
Below, the injection schedules and further operational details of the four investigated OPs are summarized. Piston, liner and cylinder head tem- perature as well as charge pressure were the same for OPs 1, 2 and 4, whereas OP3 featured a slightly elevated charge pressure resulting in a reduced global equivalence ratio. In case of OPs 1, 3 and 4 the same amount of fuel was injected, while for OP2 the energizing time of the first injection was doubled to increase the base load. For OPs 1, 2 and 3, the first base load injection occurred early in the compression stroke, allowing for a prolonged dwell aiming at enhanced premixing, while for OP4 the first injection was delayed by 10 ms. Timing and duration of second and third injections were selected to be the same for all OPs. It has to be noted that due to the free-floating piston design of the RCEM, above modifications to operational characteristics affected the overall compression ratio, which was 10.5 for OPs 1 and 4, 9.9 for OP2 and 8.7 for OP4, respectively. The thermodynamic analysis has been performed with an in-house written software [25], which was already used in previous works [23,24,26]. From the in-cylinder pressure signal and an estimation for heat transfer using the approach of Woschni [27], the heat release rate was obtained.
Fig. 1.Schematic view of the RCEM: Pressurized air moves the mass balance piston towards the stroke adjustment piston, accelerating the working piston towards the cylinder head.
Fig. 2. (Top) Ensemble averaged time traces of piston clearance and pressure at reactive OP1. Shaded areas denote cycle-to-cycle variations of the RCEM.
(Bottom) Injection schedules for investigated OPs: Trigger pulses indicate injector energizing times with respect to the start trigger event at 190 mm piston clearance. Respective timings (start of injection/duration) are stated below. Further characteristics for each OP are summarized on the right.
2.3. Optical diagnostics
As indicated above, two successive test campaigns were carried out.
In a reactive study, the effect of multiple injections on ignition and combustion behavior were investigated while in a non-reactive campaign, the impact of the split injection schedule on fuel–air mixing was explored. The first setup combined Schlieren, OH* chem- iluminescence as well as CH2O PLIF imaging, the second Schlieren, Mie scattering as well as tracer (TMPD) PLIF measurements.
A schematic drawing of the optical arrangement is shown in Fig. 3.
The same Schlieren setup was applied for both reactive and non-reactive campaigns. Schlieren illumination was implemented based on a Cavitar CaviLux Smart diode laser (690 nm, pulsewidth 1 µs). The laser output was collimated by a combination of an aspherical (L4, 2′′, f =40 mm) and a spherical lens (L5, 4′′, f =400 mm). A 4′′bending mirror (M2) was used to direct the collimated beam into the RCEM. Behind the machine, a second spherical lens (L6, 4′′, f =400 mm) was placed to focus the outgoing laser light onto a circular Schlieren cutoff aperture (diameter 1 mm). Schlieren images were recorded using a LaVision HSSX camera equipped with a Nikkor VIS lens (f =105 mm, f/2.8). Both formalde- hyde as well as TMPD PLIF signals were excited using the third harmonic output of an Edgewave IS400 high-speed laser at 355 nm. Operated at 10 kHz repetition rate, the laser’s output power was about 75 W with a pulse width of 6.5 ns. The laser beam was formed into a collimated sheet of 32 mm height using a combination of cylindrical lenses (L1, f =-25 mm; L2, f =250 mm) and a diaphragm. A 2′′dichroic mirror (M1) was used to direct the light sheet into the RCEM through the lateral window.
The beam waist was adjusted by a third cylindrical lens (L3, f =1000 mm), resulting in a sheet width <1 mm throughout the visible domain.
As indicated in Fig. 3, the light sheet was slightly tilted to match the 5◦ injector inclination. Since the fuel spray is pushed towards the piston head during the compression stroke, Srna et al. [28] found that the effective symmetry axis of the spray cone has an angle of 3.5◦, which was adopted for the arrangement of the light sheet in the present experi- ments. In both setups, LIF signals were directed towards a LaVision HSS6 high speed camera equipped with a high speed image intensifier (HS- IRO, gate width 150 ns, gain 62) using the same dichroic mirror (Bs1, 4′′, HR 45 300–450 nm). For CH2O LIF detection, a Nikkor VIS lens (f =105 mm, f/2.8) and a Hebo color glass filter (B05) were mounted, while in case of TMPD LIF a Sodern Cerco UV lens (f =100 mm, f/2.8) combined with a bandpass filter (Edmund optics, 400 ±25 nm) were used. OH*
chemiluminescence was recorded by means of a LaVision HSS6 high speed camera with high speed image intensifier HS-IRO (gate width 75 µs, gain 60), equipped with a Sodern Cerco UV-lens (f =100 mm, f/2.8) and a bk Interferenzoptik bandpass filter (313 ±7 nm). A dichroic beamsplitter (Bs2, Eksma, 4′′, HR 45 305–320 nm) was used to deflect
the back-scattered OH* signal towards the detection system while the Schlieren laser illumination passed. For the non-reactive tests, in order to detect Mie scattering from the liquid fuel spray excited by the Edge- wave laser, the image intensifier was removed and the camera lens as well as the bandpass filter were replaced (lens: Coastal optics, f =105 mm, f/4.5; filter: bk Interferenzoptik, 355 ±10 nm). Additionally, a different dichroic beamsplitter (Bs2, CVI, 4′′, HR 45 351 nm) was mounted to deflect the back-scattered Mie signal.
For both reactive and non-reactive campaigns, the start of image acquisition was externally (position) triggered when the working piston reached a distance of 190 mm to the piston head. A second position trigger was used to activate the image intensifier at 60 mm to prevent over-exposure of the intensifier caused by highly fluorescent liquid fuel components pertinent in the 1st injection. At an acquisition rate of 10 kHz, each acquisition channel acquired 400 images and 10 repetitions were carried out at each OP. Since the study focuses on pre-ignition mixing of 2nd and 3rd injection and the combustion behavior near TDC, image processing is limited to time steps 15 ms to 30 ms after the initial trigger event. In a first evaluation step, all acquired images are mapped to a common grid defined by a transparent dot-pattern target using the LaVision Davis software’s built in image dewarping and mapping routines. The origin refers to the injector nozzle tip, the resulting resolution is 0.075 mm/pix. All images are multiplied with a circular mask to account for the viewing windows diameter of 52 mm.
OH* chemiluminescence measurements are used to asses the onset of auto-ignition as well as the duration of the HT combustion event. Images are background corrected and Gaussian smoothing is applied. Mie scattering data has been carefully examined and it has been found that the core of the liquid jet does not enter the visible range in any operating condition. Therefore, no Mie scattering results are presented. Schlieren images are flat-field corrected in a first step. In order to extract the contours of the fuel jet, images are further processed by applying an adaptive background subtraction method [29,30]. The contrast of the jet area in the background corrected image is further enhanced by applying two-dimensional median filtering, threshold filtering and automated removal of remaining spurious objects, so that eventually the spray contours are obtained as the boundary of the fuel spray area. Jet pene- tration length and spray angle are then extracted from the spray con- tours. CH2O PLIF images suffer from background structures related to spurious light from the Schlieren laser, which is partially reflected by the dichroic beamsplitter. Other background sources involve secondary re- flections of the LIF signal and fluorescence exited at the injector head, both illuminating the moving working piston surface. The background is corrected by scaling and subtracting an average background image generated from multiple frames near the end of the acquisition cycle when the formaldehyde fluorescence has disappeared. A second circular mask of 36 mm in diameter is used to remove remaining piston head artifacts. Finally, Gaussian smoothing and threshold filtering are applied to each image.
The evaluation of the tracer PLIF images is initiated by moderate Gaussian smoothing. This is followed by several processing steps to remove background artifacts caused by secondary fluorescence scat- tering off surfaces and reflections. The quantitative interpretation of the processed tracer PLIF images as equivalence ratio fields relies on the procedures outlined in [22,31,32]. The interpretation of measured tracer PLIF intensities as equivalence ratio Φ is governed by the following equation
Φ(x,r,t) = I(x,r,t)
I0(t)Iff(x,r)⋅ AFRstoich
ϕ(T)Kρair(p,T,t), (1)
where I denotes the background corrected PLIF intensity per spatial resolution element (x,r)at time step t. Pulse-to-pulse variations of the laser energy are represented by I0 and were not recorded during the measurements, since low fluctuation amplitudes below 3% (rms) were expected based on previous experiments [22]. Due to some unknown Fig. 3. Optical setup for simultaneous high speed CH2O-PLIF, Schlieren, and
OH*-chemiluminescence imaging (reactive) and TMPD tracer PLIF, Schlieren, and Mie scattering imaging (non-reactive).
reason, the pulse energy varied by 20% (rms) in the current experiments, which has significant impact on the measurement accuracy as will be shown below. To account for the efficiency of the acquisition arrange- ment as well as the spatial distribution of the incident laser light, a flat- field correction is performed: By flooding the combustion chamber with low concentration fuel/tracer vapor and in assuming a homogenous vapor distribution, remaining intensity variations within the field of view can be attributed to the efficiency of the detection devices and the laser beam profile, the latter being assumed temporally constant. A flat- field image Iff is then generated by averaging over an ensemble of 1000 individual images. While the first expression on the right side of Eq.(1) introduces image operations that are specific to the present setup, the second term contains parameters referring to the conversion to equiv- alence ratio. The temperature dependent TMPD fluorescence quantum yield is denoted by ϕ and is obtained from an empirical model based on available literature data [30,33–35]. The bulk piston temperature T as well as the air density ρair at each time step are calculated from measured piston pressures p in presuming adiabatic compression/expansion. In assuming rotational symmetry of the fuel spray, the proportionality constant K links the injected fuel mass to the volume integrated intensity and is used to transform the quantum yield corrected fluorescence in- tensity to local fuel density [31,32]. The operation inherently assumes a low tracer concentration so that absorption of laser energy can be neglected and that the excitation energy of the probed transition stays below the saturation limit. The image at 18.9 ms after the start trigger is selected to perform the procedure, since at this time step the fuel spray of the 2nd injection is visible to its full extend within the camera’s field of view. The constant is then used to normalize the respective image series. Finally, the expression is multiplied by the stoichiometric air- –fuel-ratio AFRstoich for n-heptane-air mixtures.
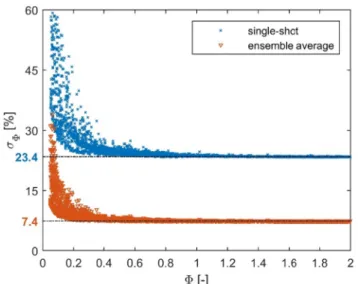
Precision of measured equivalence ratios is analyzed by applying the principle of propagation of uncertainty to Eq.(1) and calculating the respective standard deviations. Relevant sources of uncertainty are camera noise, deviation of the fuel jet volume from rotational symmetry and the pulse-to-pulse variation of laser energy. The precision analyzed for a representative field of instantaneous equivalence ratios is sum- marized in Fig. 4, where each symbol represents a single camera pixel.
For values of Φ<0.3, the precision is determined by camera noise and, therefore, standard deviations grow towards lower Φ. At higher equiv- alence ratios an asymptotic decrease of the resulting standard deviation is observed, which reaches a minimum value of 23.4% and is mainly dominated by the 20% pulse-to-pulse variation of the laser energy.
Ensemble averaging over ten repetitions increases the precision by a factor of 3 by converging to a standard deviation of 7.4% for Φ>0.3.
3. Jet metrics and mixing dynamics 3.1. Penetration length analysis
The temporal evolution of the jet penetration length and the spray angle of the 2nd and the 3rd injection are extracted from the Schlieren contours of the non-reactive measurement campaign. The injections are of short duration, so that both are completed before the respective fuel spray enters the visible area after 0.2 ms. The penetration length data is reported in Fig. 5 (top). It develops almost identical for all OPs and for both injections. Differences between the curves are well within the experimental spread over the ten repetitions marked by the gray shaded area. The same holds true for the spray angles associated with the 2nd and the 3rd injection, which approach an average value between 21◦ and 22◦. From these results it is apparent that the parameter changes according to the operating strategy outlined above have no significant impact on the global jet metrics. In contrast to previously discussed results obtained from optical investigations of multiple injections in CVCs [19], no faster penetration of the subsequent (3rd) injection is observed in our data. On the contrary, an opposing effect is evident in jet tip penetration differences depicted in Fig. 5 (bottom), leading to
decreased penetration rates of the 3rd injection before 1 ms after el. SOI for all OPs. An explanation lies in the transient nature of RCEM ambient conditions compared to CVC experiments: Since the chamber pressure rises during the compression stroke, the momentum gain caused by the
“slipstream” effect is counteracted by the associated density increase and, therefore, results in an overall reduced penetration length instead.
At later stages, differences in jet penetration for OPs 2 and 4 stabilize around 1 mm, while in case of OPs 1 and 3 the 3rd injection gains on the preceding jet so that it eventually reaches similar penetration distances.
While the penetration length exhibits a pronounced behavior in connection with the engine cycle, no conclusive trends can be deduced from the spray angle data.
Fig. 6 shows in solid the measured penetration length of the spray of OP1 (black 2nd injection, red 3rd injection, similar for the other OPs).
The black dashed line indicates the penetration length from a spray model governed by the following equation
Fig. 4.Single-shot (blue, ✕) and ensemble averaged (red, ▽) precision of equivalence ratio.
Fig. 5.(Top) Ensemble averaged jet penetration length. Black solid curves represent the respective average over all OPs, shaded areas indicate the average spread over the ten repetitions. Dashed-dotted vertical lines mark the ener- gizing time of 2nd and 3rd injection. (Bottom) absolute difference of ensemble averaged jet penetration length of 2nd minus 3rd injection.
S=a0
̅̅̅̅̅̅̅̅̅̅̅̅̅̅̅̅̅̅̅̅̅̅̅̅̅̅̅̅̅̅̅̅̅̅̅̅̅̅̅̅̅̅̅̅̅
Pf− Pa
ρa
√
⋅d0⋅t
√√
√√ (2)
where S is the spray penetration length, a0 is a parameter to be cali- brated and the term under the double square root is the similar to the spray models from [36–38]. Pf and Pa are the fuel respectively the charge pressure, ρa is the charge density, d0 is the nozzle reference diameter and t the time. The parameter a0 has been calibrated to match the experimental data from the 2nd injection. The red dashed line uses the same model with the same parameter a0, but with the charge pres- sure and density evolution from the 3rd injection. The graph shows, that the estimated penetration length for the 3rd injection (red, dashed) differs significantly from the experiment (red, solid). This behavior has already been reported in a constant volume chamber [19], where the penetration of the second of two consecutive sprays penetrates faster due to the discussed aerodynamic effects. However, it is important to note, that in an engine environment, even though the consecutive spray
“benefits” from the preceding jet, the penetration does not necessarily need to be faster, since the consecutive spray is injected into a higher pressure and density environment as long as the injection timing is during the compression stroke.
3.2. Local mixing phenomena
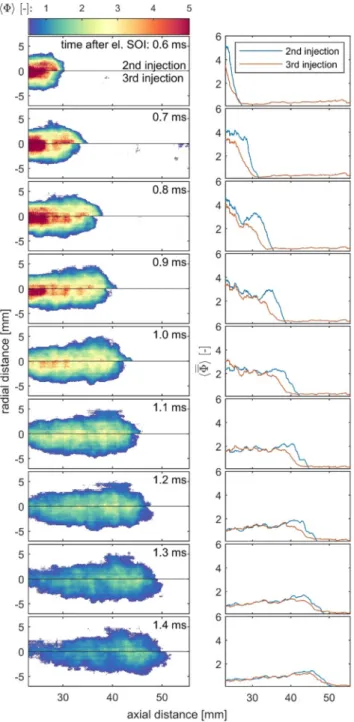
The section targets at revealing the complex local mixing dynamics between the 2nd and the 3rd injection and to establish a relation to the matrix of operating points. Owing to the limited precision of the single- shot equivalence ratio maps, the following analysis will rely on ensemble averaged results, denoted by 〈Φ〉. Ensemble averaged equiv- alence ratio maps of 2nd and 3rd injections for OP1 are compared in Fig. 7 (left). A threshold of 〈Φ〉 =0.5 is used to remove the base load contributions and to enhance the contrast of the jet boundaries. The mixing fields confirm the faster penetration of the 2nd jet compared to the 3rd injection. Corresponding cross-sectional average equivalence ratio profiles in Fig. 7 (right) develop a steep gradient at the spray head of injection 2, which is related to the formation of a stagnation plane and is typical for pulsed jets emerging into a quiescent medium [19,39]. In contrast, corresponding profiles of the 3rd injection exhibit a signifi- cantly smoother decay of the equivalence ratio at the spray tip, indi- cating enhanced mixing at the head of the post-injection due to the turbulence induced by the preceding jet [13,18,19].
The enhanced spray tip mixing of the 3rd fuel jet is further quantified by integrating the ensemble and cross-sectional averaged equivalence ratio of 2nd and 3rd injection at the spray head (xtip− 5mm) and by calculating the ratio between these quantities. Values below unity indicate a faster spray head mixing during the 3rd injection and vice versa. The resulting curves for all investigated operating conditions are summarized in Fig. 8 (top). Until 0.9 ms, ratios are within a range of 0.6 to 0.8, indicating a stable improved mixing rate at the spray head of the 3rd fuel jet for all OPs. While OP1 and OP3 ratios stay within that range for all time steps, OP2 values gradually grow until reaching unity beyond 1.3 ms, indicating similar spray head mixing rates of the 2nd and the 3rd injection. The OP4 curve instead begins to fall steadily after 1 ms and finally approaches a minimum value of about 0.4. This suggests a Fig. 6.Ensemble averaged jet penetration length for 2nd and 3rd injection
compared with calibrated 2nd and expected 3rd injection derived from Hir- oyasu’s model for OP1.
Fig. 7.(Left) Comparison of ensemble averaged equivalence ratio 〈Φ〉maps of 2nd (upper half) and 3rd (lower half) for several time steps after el. SOI for OP1.
(Right) Corresponding ensemble and cross-sectional average equivalence ratio 〈 Φ〉profiles.
continuous increase of the spray head mixing rate of the 3rd injection.
As opposed to the markedly different spray head structure of the 2nd and the 3rd injection, the upstream distributions of the ensemble aver- aged equivalence ratio maps as shown in Fig. 7 (left) for OP1 are of similar shape and magnitude. The corresponding cross-sectional average equivalence ratio profiles confirm this observation by presenting com- parable slopes and absolute values in the upstream regions. A compar- ison of the ratio of integrated cross-sectional average equivalence ratios of the remaining visible spray body in Fig. 8 (bottom) reveals an almost constant offset between 2nd and 3rd injection over all time steps. This leads to the conclusion, that the flow field induced by the 2nd injection results in a stable increase in the upstream mixing rate of the 3rd jet, independent of global parameter changes associated with the operating matrix.
3.3. Global mixing state
To analyze the global mixing state, probability density functions (PDFs) from each single-shot equivalence ratio map are produced and ensemble averaged over the corresponding ten repetitions. The results of the analysis are summarized in Fig. 9. Each column of the displayed PDF maps represents the distribution of equivalence ratio within the area illuminated by the laser light sheet at a certain time step. The likelihood of a particular equivalence ratio to occur is indicated by the coloring. At times before 18.1 ms, the distributions show the mixing state resulting from the base load (1st) injection, with all of them displaying a varying degree of stratification. The mixing at OP1 is the most advanced with a maximum probability around Φ=0.2 and no discernable contributions beyond Φ =1.2. OP2 exhibits a similar distribution, but slightly shifted to higher equivalence ratios due to the doubled duration of the base load injection. Even though being globally leaner, the mixing state prior to the 2nd injection of OP3 appears even more stratified with equivalence ratios exceeding Φ=1.7. The increase in stratification might be related to the higher charge pressure and the thereby reduced penetration depth, which changes the mixing dynamics of the base load injection.
Finally, the base load stratification is most pronounced in the case of OP4, which is strongly related to the delayed 1st injection and the, therefore, considerably shortened time for fuel–air premixing. Starting with portions of the 2nd jet coming into view at 18.1 ms (0.5 ms after el.
SOI2), all maps are governed by a peak structure related to the 2nd in- jection. The steep rise at the beginning points to the wide range of
equivalence ratio magnitudes contained in the initial jet. Momentum- driven mixing leads to rapid decrease in equivalence ratio, resulting in a moderately stratified fuel–air mixture with absolute values below Φ= 2.2. For time steps after 19.5 ms (0.5 ms after el. SOI3), the 3rd injection starts to contribute accordingly. Finally, the in-plane mixing state ap- proaches a similar degree of stratification for all OPs.
To further investigate characteristics of the global mixing state within the laser sheet area, the accumulated probabilities over all equivalence ratios are plotted against time and compared for all OPs in Fig. 10 (left). The resulting curves reveal, that only a fraction of the probed area is actually filled with fuel–air mixture and that there are pronounced differences between the OPs: While OPs 2 and 3 reach an initial filling state around 50% and 55% at 18 ms, respectively, OP1 reduces to 35% of fuel–air mixture, whereas OP4 drops below 25%.
However, as time progresses, the double injection causes the light sheet plane to gradually fill up until all OPs reach a similar level around 65–70% of the investigated area.
To give a first implication from the mixing state towards the onset of LT oxidation reactions, Fig. 10 (right) summarizes the accumulated probabilities in the range between 0.6≤Φ≤2 that are prone to initiate a LT combustion event [40]. In contrast to accumulating over all prob- abilities, confining the analysis to the specified equivalence ratio range Fig. 8. Ratio of integrated ensemble and cross-sectional average equivalence
ratio between 2nd and 3rd injection (top) at the spray head (xtip−5mm) and (bottom) for the remaining visible spray body.
Fig. 9.PDF maps of the light sheet area: Each column represents an average PDF obtained by ensemble averaging the PDFs derived from single-shot equivalence ratio distributions at the corresponding time step. The probabil- ity of a certain equivalence ratio (y-axis) to occur at a specific time step (x-axis) is indicated by the color map in logarithmic scale.
results in similar distributions for all OPs. All curves start at a level around 5% or below, which is followed by a steep growth caused by the contributions of the 2nd injection. After reaching a first maximum around 18.7 ms, leaning of the fuel-rich portions causes the accumulated probability to decrease again. The pattern repeats as soon as the 3rd injection enters the field of view, until the progression of mixing leaves 10–15% of the global fuel–air mixture in a state that favors the onset of LT oxidation reactions.
Above findings reveal that, even though there are marked differences in the degree of premixing as well as fuel deposition after the 1st in- jection, all OPs approach a similar state of mixing after the 3rd injection.
This leads to the conclusion, that the in-plane mixing state is primarily
determined by the two post-injections, which are identical for all OPs, and not by the applied changes to the operating strategy. Since mixture preparation is essentially the same for all OPs, it is expected that dif- ferences in ignition and combustion behavior will be determined by local effects rather than by the global mixing state.
4. Combustion analysis
4.1. Thermodynamic analysis and global combustion metrics
The results of the thermodynamic analysis are summarized in Fig. 11. As a reminder, timing, duration and fuel pressure of 2nd and 3rd injection are always the same, while mass (OP2) and timing (OP4) of the 1st injection as well as air charge pressure (OP3) are varied. For OP1, the average heat release rate (HRR) exhibits a steady increase starting in- between the two injection pulses. This is followed by a steep rise shortly after the 3rd injection is completed. The HRR curve reaches its maximum at about 21 ms and drops rapidly, finally showing a long lasting tail extending until 25 ms. The cumulative heat release stays well below the level of injected energy with an average mass of fuel burnt (MFB) of 66%. The HRR curve of OP2 displays a similar development.
Compared to OP1, the richer base load after the 1st injection results in increased entrainment of fuel into the 2nd and 3rd spray, thereby forming a larger amount of combustible mixture, so that the absolute amount of fuel burnt is higher and the HRR is faster. However, since also the amount of fuel below the flammability limit (assumed at Φ0.6) is higher, the MFB of OP2 is only 55%. OP3 has a higher charge pressure and, thus, a reduced global equivalence ratio. The further reduction of Fig. 10.Accumulated probabilities (excluding zero) ∑
P(Φ)within the light sheet area over all Φ (left) and within the range 0.6≤Φ≤2 (right).
Fig. 11.Thermodynamic analysis: Temporal development of single repetition (black) and ensemble averaged (red) heat release rate for OP1 (top, left), OP2 (top, right), OP3 (bottom, left) and OP4 (bottom, right). In addition, electronic injection actuation signals (green), cumulative heat release (blue dashed) and the level of total injected energy (blue solid) are displayed. (For interpretation of the references to color in this figure legend, the reader is referred to the web version of this article.)
the equivalence ratio also reduces the amount of combustible mixture available, resulting in a low MFB of 39%. In addition, OP3 does not show a steep rise in HRR like the other OPs, but only a gradual increase. OP4 has a later timing of the 1st injection, which means that the mixture at the start of the second injection is less homogeneous. This has the consequence that less fuel is entrained into the trailing edge of the second injection (Fig. 10, left). However, a mixture of richer charge is entrained at the tip of the 2nd and 3rd spray (Fig. 10, right), which eventually leads to a larger MFB and a steeper HRR. Unlike the other OPs, the HRR curve of OP4 does not develop a long lasting tail but quickly drops to zero.
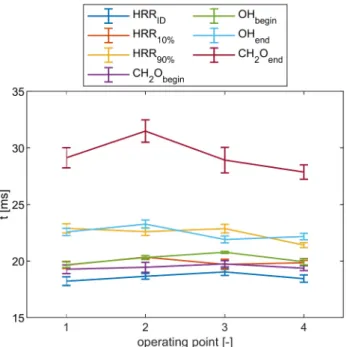
To link the observations of Fig. 11 to the combustion phenomenol- ogy, relevant timings extracted from the thermodynamic analysis and optical measurements (i.e. start and end timing of the OH* and CH2O PLIF signals) are compared in Fig. 12. The thermodynamic begin of the HRR is the earliest detected value in all cases and marks the onset of LT combustion. The first appearance of formaldehyde is slightly delayed because LT reactions outside the light sheet plane are not detected. In addition, the CH2O PLIF signal was contaminated with background ar- tifacts, which, although corrected, decrease the signal-to-noise ratio and thereby raise the lower detection limit. On the other hand, the onset of the OH* signal agrees very well with the 10% heat release for three of the four OPs. This leads to the conclusion that 10% of the HRR can be attributed to LT reactivity even before the onset of HT combustion, which is consistent with the significant change in slope of the HRR at about 20 ms for OPs 1, 2 and 4 in Fig. 11. The 90% point of the HRR matches well with the end of the OH* signal, marking the end of HT combustion. Since temperatures are still high, remaining unburned lean fuel–air mixtures are converted in the LT combustion regime and the decay of the formaldehyde signal is significantly delayed, so that HRR curves of OPs 1, 2 and 3 in Fig. 11 exhibit the aforementioned tail. For OPs 1 and 2, a significant change of rate is visible, whereas for OP3, the difference between LT and HT combustion is too weak. OP4 has the highest MFB and shows no significant HRR after 22 ms, indicating that post-combustion LT reactivity is lowest, which is supported by the earliest disappearance of the formaldehyde signal.
4.2. Ignition characteristics
The characterization of the ignition behavior in relation to the operating strategy relies on a combined analysis of high-speed Schlieren, CH2O PLIF and OH* chemiluminescence measurements. Representative sequences of the ignition behavior for a single measurement run out of the ten repetitions for each OP are summarized in Fig. 13. Regarding OP1, a first spot of formaldehyde within the 2nd fuel spray is formed 1.4 ms after el. SOI2 about 30 mm downstream from the nozzle tip. At this time step, the mixing and thermodynamic state appear to be ideal to promote LT ignition, as rapid mixing at the trailing edge of the spray results in higher temperatures than at the richer spray tip. In addition, the global structure of the mixing field exhibits large portions of equivalence ratio prone to undergo LT oxidation (Fig. 10, right). The first LT ignition spot then grows rapidly in the downstream direction to finally cover the entire span of the 2nd fuel jet at 1.8 ms. When the head of the 3rd fuel spray comes into view at 1.9 ms after el. SOI2, the LT reactivity related to the 2nd injection already appears to decline, until at 2 ms only small portions at the spray head remain. At the same time, however, first HT ignition kernels appear at a similar axial location between 50 and 60 mm and merge into a single reaction zone, which then expands over several time steps, is transported downstream and disappears again 2.5 ms after el. SOI2. In contrast to the 2nd injection, the 3rd fuel spray exhibits a distinctly different LT ignition behavior, as portions at the spray head immediately undergo LT oxidation reactions 0.6 ms after el. SOI3. The shortened LT ignition delay between 2nd and 3rd injection agrees well with earlier observations and is related to the entrainment of hot LT reaction products from the preceding by the subsequent jet [18,19]. In addition to this established explanation, the enhanced mixing at the head of the 3rd spray due to the slipstream effect leads to leaner mixtures in comparison to the rich stagnation plane structure of the 2nd jet (compare Fig. 7, right at 0.9 ms), which are more susceptible to undergo LT oxidation reactions. Formaldehyde fills the cross-section of the 3rd jet, until at 1 ms after el. SOI3, a HT ignition kernel related to the arrival of the 3rd injection develops 40 mm downstream from the injector nozzle. In the following time steps, the HT ignition kernel expands in all directions and partially consumes the formaldehyde. The HT reaction zone reaches its maximum extend at 1.4 ms after el. SOI3 and is then transported in downstream direction, whereby an intense formaldehyde signal develops in its wake. A similar observation of post-combustion formaldehyde was also made in [19]
and is related to an incomplete consumption of the available fuel during the HT reaction.
In comparison to OP1, OP2 exhibits a corresponding LT and HT ignition behavior, however, the first appearance of formaldehyde as well as OH* is delayed by about 0.3 ms. Furthermore, LT reactivity is initially limited to the 2nd injection’s upstream half. The explanation to both the delayed onset of LT and HT ignition as well as the postponed LT reac- tivity in the jet’s lower half is twofold: First, the lower compression ratio results in a reduced rise rate of the ambient temperature, so that it takes longer to trigger LT and HT reactivity. Second, the higher base load leads to richer mixtures, such that in the lower half of the 2nd spray the equivalence ratio is still
too high (and temperature is too low) to undergo LT oxidation. LT reactivity of the 2nd fuel spray is still on-going when the 3rd jet enters the visible domain 0.5 ms after el. SOI3 and seems to be partially quenched at 0.7 ms due to colder portions of the 3rd spray mixing with the LT combustion products of the 2nd injection. The 3rd fuel spray further expands and quickly fills with formaldehyde, until it reaches the outline of the HT reaction zone of the 2nd jet 1 ms after el. SOI3. In contrast to the initially small and then gradually growing HT ignition kernel development of OP1, a large HT reaction zone appears centered around that area. Similar to OP1, the incomplete fuel consumption during HT combustion leads to post-combustion LT reactivity devel- oping throughout the visible area. In case of OP3, both LT and HT ignition deviate significantly from the previously described behavior.
Fig. 12. Global combustion metrics: Ignition, 10% and 90% cumulative heat released (relative to the converted and not to the injected fuel, dark blue, or- ange and yellow), start and end of formaldehyde appearance (purple and red), start and end of OH* appearance (green, light blue). (For interpretation of the references to color in this figure legend, the reader is referred to the web version of this article.)
Fig. 13.Time-resolved ignition dynamics: Each OP occupies two rows and is introduced by a Schlieren image. Subsequent images contain the simultaneously acquired in-plane CH2O PLIF signal (red) and the line-of-sight integrated OH* chemiluminescence (green). Superimposed are the jet contours of 2nd (solid white) and 3rd injections (solid yellow) extracted from the simultaneously acquired Schlieren image data. Jet contours become dotted when tracking in the Schlieren data is no longer feasible. The last detectable contour is kept and translated along the jet axis by an amount related to the average jet tip velocity extracted from the non- reactive Schlieren data. Numbers at lower right denote the time after el. SOI2 (white) or SOI3 (yellow) in ms. (For interpretation of the references to color in this figure legend, the reader is referred to the web version of this article.)
The low global equivalence and compression ratio lead to a significant delay in LT reactivity of the 2nd injection until 2 ms after el. SOI2. Unlike OPs 1 and 2, where first LT oxidation reactions are located in the downstream half of the 2nd jet, the initial LT reactivity of OP3 appears at the tip of the 2nd spray at an axial distance between 50 and 60 mm from the injector. This is due to the fact that, as soon as ambient temperatures are sufficiently high to trigger LT reactivity, the upstream mixing is further advanced so that mixtures are too lean, while equivalence ratios at the spray head have reached a level suitable to promote LT oxidation reactions. LT reactivity then spreads in the upstream half of the 2nd spray, but without HT ignition to occur. In the following, the absence of LT combustion products from the 2nd fuel spray fails to trigger LT reactivity inside the boundaries of the 3rd jet (small spots from 0.5 to 1 ms after el. SOI3 are most likely background artifacts). The 3rd fuel spray
eventually undergoes LT oxidation reactions 1.1 ms after el. SOI3 and merges with the still persisting LT reaction zone of the 2nd jet. The onset of HT combustion then occurs 1.4 ms after el. SOI3 at the head of the 3rd fuel spray. The resulting HT reaction is less intense compared to OPs 1 and 2 and its location is less persistent, so that it rapidly extinguishes when transported downstream with the flow, leaving a reduced LT reactivity in its wake. Both the decreased intensity and duration of the HT combustion event as well as the lowered pre- and post-combustion LT reactivity explain the lowest MFB of OP3 with 39% of the injected fuel mass only. Regarding OP4, the delayed 1st injection leads to a different mixing pattern, since only 25% of the light sheet plane is filled with fuel–air mixture prior to the 2nd injection (Fig. 10, left). This means that less fuel is entrained by the 2nd jet in the upstream regions of the spray so that equivalence ratio stays below the LT ignition limit. First
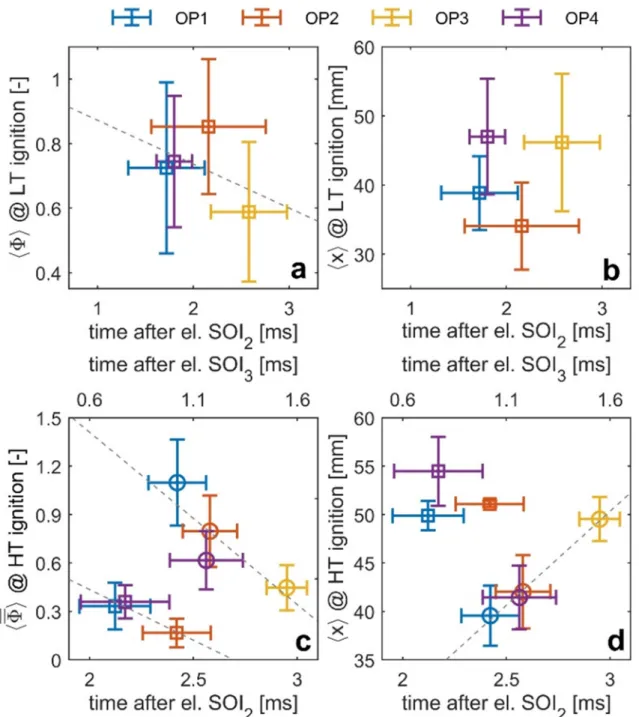
Fig. 14. Ignition statistics: Spatially averaged (a) equivalence ratio and (b) axial distance from the injector at LT ignition locations plotted against LT ignition delay.
(c) Cross-sectional average equivalence ratio and (d) axial distance from the injector at HT ignition locations plotted against HT ignition delay related to SOI 2nd (bottom x-axis) and 3rd (top x-axis) injection. Symbols □ and ○ are used to discriminate between ignition events related to 2nd or 3rd injection, errorbars indicate the spread of the corresponding variable over the ten repetitions. Dashed grey lines show respective trends and are inserted to orient the reader.
LT oxidation reactions eventually occur at the richer head of the 2nd spray 1.6 ms after el. SOI2. In the following, LT reactions are restricted to the head of the 2nd spray and do not spread further upstream, until HT ignition occurs at a similar location 2 ms after el. SOI2. The resulting reaction zone consumes the combustible mixture at the spray head and extinguishes quickly 2.4 ms after el. SOI2. Even though LT combustion products are absent in the near nozzle region, unlike OP3, high tem- peratures due to the elevated compression ratio and the already started HT combustion of the 2nd jet provoke LT reactivity within the limits of the 3rd jet immediately after it becomes visible. This is quickly followed by two auto-ignition kernels emerging between 30 and 40 mm down- stream from the nozzle, which gradually grow into a single expanding reaction zone. The then progressing HT combustion event is very similar in intensity and duration to OP1 and eventually leaves a post- combustion formaldehyde signal in the wake of the downstream trans- ported HT reaction zone.
To further substantiate above findings, LT and HT ignition timings as well as ignition locations are analyzed for all measurement runs and combined with respective results of the ensemble averaged mixing field in Fig. 14. Although rising temperatures with respect to LT fuel oxida- tion will lead to local expansion of the flow field and thus change the local equivalence ratio distribution, it is argued that the following analysis nevertheless will display the qualitative trends in relation to the operating strategy. LT ignition timings and associated average equiva- lence ratios in Fig. 14 (a) follow the operating strategy and are domi- nated by the varying compression ratio and the associated differences in ambient temperature, so that OPs 1 and 4 have a similar LT ignition delay, while LT oxidation reactions of OPs 2 and 3 are delayed. The average axial distances of LT ignition events from the injector nozzle in Fig. 14 (b) confirm the trends found in the previous analysis, whereby the local structure of the mixing field promotes LT reactivity at the spray tail for OPs 1 and 2 and at the spray head for OPs 3 and 4. In order to link HT ignition timings to the local mixing state, planar equivalence ratio fields measured by tracer PLIF cannot be used right away, since the depth position of the in-plane fuel–air distribution and the line-of-sight integrated OH* chemiluminescence signal might differ. As the axial coordinates of OH* and tracer PLIF are the same, cross-sectional average equivalence ratios are used for the analysis. HT ignition of OPs 1, 2 and 4 can be separated in two distinct events related to the arrival of the 2nd and the 3rd fuel spray. In case of OP3, HT ignition is characterized by a single event only. When comparing ignition delay and local mixing state between the two HT events for OPs 1, 2 and 4, the first ignition occurs at very lean conditions with ignition delays twice as long, which is well in line with previous findings in the literature [19,20]. In contrast to the LT reactions, HT ignition shows a stronger dependence on the equivalence ratio and, in particular for the second HT ignition event, is significantly influenced by a combination of flow and chemistry related mechanisms:
OP1 has the shortest second HT ignition delay and ignites at the smallest axial distance. This behavior has its origin in an increased upstream LT reactivity within the 2nd fuel spray, which generates hot reaction products that are entrained by the expanding 3rd injection, combined with a relatively high compression ratio and, thus, ambient temperature.
In terms of upstream LT reactivity, the 3rd injection of OP2 experiences similar conditions compared to OP1. However, as ambient temperatures are reduced due to the lower compression ratio, the second HT ignition event is slightly delayed and is located further downstream in a leaner mixing state. OP4 on the other hand has similar ambient conditions compared to OP1, but lacks the upstream LT reactivity of the 2nd fuel spray, leading to a similar second HT ignition delay, position and mixing state compared to OP2. Finally, due to the low compression ratio com- bined with the leanest fuel–air mixtures, HT ignition of OP4 is signifi- cantly delayed and shifted downstream.
5. Conclusion
In this study, mixing, ignition and combustion behavior in an
optically accessible RCEM operated under PCCI relevant conditions were investigated by combined passive optical and laser-optical high- speed diagnostics. The Schlieren technique was applied to extract fuel spray contours and jet metrics. In a reactive campaign, this was com- bined with CH2O PLIF and OH* chemiluminescence imaging to detect LT and HT ignition delay and location and to further characterize combustion. Corresponding equivalence ratio fields were obtained from tracer PLIF measurements under inert conditions. In order to achieve the balance between fuel–air mixture stratification and premixing that is required for the PCCI combustion mode, a split injection schedule con- sisting of a first long base load injection early in the compression stroke and two short injections close to TDC was used. The applied operating strategy resulted in only minor changes in engine metrics such as global equivalence ratio or compression ratio. Nevertheless, distinct differ- ences in local fuel–air mixing and ignition behavior as well as com- bustion efficiency were observed. In focusing on the short double injection, the analysis of the optical data revealed several key findings:
1. Previous experimental and numerical studies of closely coupled double injections under constant ambient conditions showed an increased penetration and mixing rate of the subsequent fuel spray caused by the persistent momentum and turbulence of the preceding jet. Under transient RCEM conditions, however, the aerodynamic gain from the preceding injection is counteracted by the density rise during the compression stroke, eventually leading to shorter pene- trations of the consecutive jet. Although shorter penetration lengths of the subsequent jet are revealed, an enhanced mixing rate of the second fuel spray is found for all OPs.
2. Although marked differences in premixing after the first base load injection are observed, all OPs approach a similar mixing state at the end of the following double injection event. It is concluded that the in-plane mixing state is not determined by the operating strategy but dominated by the double injection event, the latter being identical for all OPs.
3. Even though variations in operating parameters are small, the ther- modynamic analysis reveals a distinctly different combustion behavior between the OPs. All HRR curves display a gradual increase associated with LT fuel oxidation, followed by a steep rise as a consequence of HT combustion. Three out of four OPs display post- combustion heat release by a persistent LT reactivity, so that more than 20% of the overall heat release can be attributed to LT oxidation reactions.
4. The onset of LT reactivity is found to be dominated by the operating strategy and the resulting variation in bulk temperature. Regarding the location of LT ignition, a distinct relationship to the local mixing state is revealed: Whereas richer upstream mixtures favor the onset of LT reactivity, the absence of base load fuel in the near nozzle area results in fast leaning of the spray tail, so that LT ignition is shifted towards the richer spray head. Immediate onset of LT reactivity is observed when the subsequent fuel spray expands into hot LT com- bustion products from the previous one, while in the absence of these products, LT reactivity is triggered by suitable ambient conditions. In addition, the transition of the mixing field at the spray head of the subsequent spray from a stagnation plane structure to a smoothly decaying equivalence ratio distribution further accelerates the onset of LT reactivity.
5. The HT ignition process is observed to be influenced by the local mixing state, aerodynamics and combustion chemistry. For three out of four OPs, an individual HT ignition event can be assigned to each pulse of the short double injection: The first occurs at very lean conditions with ignition delays twice as long and at a notably larger axial distance from the injector nozzle. In the presence of upstream LT reactivity, the second HT ignition event is significantly promoted.
Above findings provide a conclusive analysis of mixing, ignition and combustion characteristics related to PCCI operation using a split