Composition-dependent magnetic response properties of Mn 1 − x Fe x Ge alloys
S. Mankovsky, S. Wimmer, S. Polesya, and H. Ebert
Dept. Chemie/Phys. Chemie, LMU Munich, Butenandtstrasse 11, D-81377 Munich, Germany
(Received 23 October 2017; published 3 January 2018)
The composition-dependent behavior of the Dzyaloshinskii–Moriya interaction (DMI), the spin-orbit torque (SOT), as well as anomalous and spin Hall conductivities of Mn
1−xFe
xGe alloys have been investigated by first-principles calculations using the relativistic multiple scattering Korringa–Kohn–Rostoker (KKR) formalism.
The D
xxcomponent of the DMI exhibits a strong dependence on the Fe concentration, changing sign at x ≈ 0.85 in line with previous theoretical calculations as well as with experimental results demonstrating the change of spin helicity at x ≈ 0.8. A corresponding behavior with a sign change at x ≈ 0.5 is predicted also for the Fermi-sea contribution to the SOT, because this is closely related to the DMI. In the case of anomalous and spin Hall effects it is shown that the calculated Fermi-sea contributions are rather small and the composition-dependent behavior of these effects are determined mainly by the electronic states at the Fermi level. The spin-orbit-induced scattering mechanisms responsible for both these effects suggest a common origin of the minimum of the anomalous Hall effect and the sign change of the spin Hall effect conductivities.
DOI: 10.1103/PhysRevB.97.024403
I. INTRODUCTION
During the last decade skyrmionic magnetic materials have moved into the focus of scientific interest because their unique properties hold promise for various applications in magnetic storage and spintronic devices [1]. The key role for the formation of a skyrmion magnetic texture is played by the Dzyaloshinskii–Morirya interaction (DMI) [2,3]. Its competition with the isotropic exchange interaction, magnetic anisotropy, and the Zeeman interaction in the presence of an external magnetic field determines the size of skyrmions and the region of stability in the corresponding phase diagram.
Another important characteristic feature of skyrmions is their helicity (i.e., the spin spiraling direction), which is determined by the orientation of the involved Dzyaloshinskii–Morirya interaction vectors and can be exploited as an additional degree of freedom for the manipulation of skyrmions [4–6]. The correlation between the skyrmion helicity and crystal chirality has already been discussed in the literature [7,8]. Recent experiments have demonstrated in addition a change of the skyrmion helicity with the chemical composition in the case of B20 alloys [9,10] while the crystal chirality was unaltered. This finding opens an alternative possibility for DMI engineering in order to manipulate the skyrmion helicity.
This holds particularly true for the Mn 1− x Fe x Ge alloy system which is in the center of interest for the present investigation. Experimentally, it was found [9,11] that the size of skyrmions in this material can be tuned by changing the Fe concentration, reaching a maximum at x ∼ 0.8 [11], i.e., at the concentration when the skyrmion helicity changes sign without a change of the crystal chirality. This behavior was investigated theoretically [12,13] via first-principles calculations of the DMI and analyzing the details of the electronic structure that may have an influence on it. Gayles et al. [12] have demonstrated that the sign of the DMI in Mn 1− x Fe x Ge can be explained by the relative positions in energy of the d xy ↑ and d x ↓
2− y
2states of Fe which change
when the Fe concentration increases above x ∼ 0.8. As a consequence, a flip of the chirality of the magnetic texture occurs. Similar conclusions have been drawn by Koretsune et al. [13]. While these calculations have been done by treating chemical disorder within the virtual crystal approximation (Ref. [12]) or even by employing the rigid-band approximation (Ref. [13]), the present work is based on the coherent-potential approximation (CPA) alloy theory, which should give more reliable results for the electronic structure of disordered alloys.
In addition we investigate the concentration dependence of the response properties connected to spin-orbit coupling (SOC) in the presence of an applied electric field, i.e., the spin-orbit torque (SOT), the anomalous Hall effect (AHE), and the spin Hall effect (SHE), because these are important for practical applications. Especially, we focus on the SOT, expecting common features with the DMI according to recent findings by Freimuth et al. [14].
This article is organized as follows: We start with theoretical details on the formalisms employed to calculate DMI param- eters and linear-response coefficients from first principles in Sec. II. Results for the Mn 1 − x Fe x Ge alloy system are presented and discussed in Sec. III, subdivided into Dzyaloshinskii–
Morirya interaction (III A), spin-orbit torque (III B), anoma- lous and spin Hall conductivity (III C), and symmetry consid- erations (III D). We conclude with a brief summary in Sec. IV.
Additional derivations connected to the expressions in Sec. II are given in the appendix.
II. THEORETICAL DETAILS
All calculations were performed by using the fully rel-
ativistic Korringa–Kohn–Rostoker (KKR) Green’s function
method [15,16] within the framework of local spin-density
approximation (LSDA) to density functional theory (DFT) and
the parametrization scheme for the exchange and correlation
potential as given by Vosko et al. [17]. A cutoff l max = 3
was used for the angular-momentum expansion of the Green’s function. The chemical disorder was treated within the coherent-potential approximation (CPA) alloy theory [18,19].
To investigate the composition-dependent behavior of the skyrmion size and helicity observed in experiment, we have calculated the D xx element of the micromagnetic DMI tensor as a function of Fe concentration x. As was demonstrated previously [20], this quantity can be calculated in two dif- ferent ways: Either by performing a direct evaluation of the expression
D μν = 1 π Re Tr
E
FdE(E − E F )
× 1 BZ
d 3 k
O(E)τ (k,E)T μ (E) ∂
∂k ν
τ (k,E)
− T μ (E)τ (k,E)O(E) ∂
∂k ν τ (k,E)
, (1)
with the overlap integrals and the matrix elements of the torque operator ˆ T μ = β[ σ × z] ˆ μ B xc (r) [21],
[O]
=
d 3 rZ × (r,E)Z j (r,E),
(2) [T μ ]
=
d 3 rZ × (r,E) ˆ T μ Z j (r,E), or by using the interatomic D ij μ interactions
D μν =
ij
D ij μ (R j − R i ) ν , (3) which are calculated in an analogous way [20].
The current-induced torkance [22] and the anomalous [23]
and spin [24] Hall conductivities were calculated within the Kubo linear-response formalism using the expression
R μν = R I μν + R I I μν
= − h ¯ 4π
∞
−∞
df (E)
dE Tr B ˆ μ ( ˆ G + − G ˆ − ) ˆ A ν G ˆ −
− B ˆ μ G ˆ + A ˆ ν ( ˆ G + − G ˆ − ) dE + h ¯ 4π
∞
−∞ f (E)
×Tr
B ˆ μ G ˆ + A ˆ ν
d G ˆ + dE − B ˆ μ
d G ˆ + dE A ˆ ν G ˆ +
− ([· · · G ˆ − · · · ]) dE, (4) where R I μν and R I I μν are the Fermi-surface and Fermi-sea contributions, respectively. The operator ˆ A ν representing in all three cases the perturbation is the electric current-density operator ˆ j ν = −| e | cα ν . For the calculations of the anomalous Hall conductivity one has for the response ˆ B = A, for the ˆ spin Hall conductivity ˆ B = P ˆ A ˆ with the relativistic spin- polarization operator ˆ P [25,26], while for the calculations of the spin-orbit torkances t μν the torque operator ˆ B μ = T ˆ μ has to be used. Additional calculations for the Fermi-sea torkance have been performed by following the relationship between this quantity and the DMI parameters as suggested by Freimuth et al. [14]. In line with Eq. (2), these calculations were based
on the expression t μν sea = − e
π Re Tr E
FdE
× 1 BZ
d 3 k
O(E)τ (k,E)T μ (E) ∂
∂k ν
τ (k,E)
− T μ (E)τ (k,E)O(E) ∂
∂k ν
τ (k,E)
, (5)
which obviously differs, apart from prefactors, from Eq. (2) only by the weighting factor (E − E F ). Both expressions for t μν sea should be equivalent, as can be demonstrated for the particular case of a translationally invariant system. In this case the relationship between Eq. (6) and the Fermi-sea term t μν sea in Eq. (4) can be established by using the expression for the group velocity suggested by Shilkova and Shirokovskii discussed below [27–29] (see Sec. A).
Alternatively, we have t μν =
ij
t μ ij (R j − R i ) ν , (6) with the interatomic torkance terms
t μ ij = − e 2π
Im Tr
E
FdE
1
2
3
4
× O j
4
1
(E)τ j i
12
(E)T μ, i
23
(E)τ ij
34
(E)
− O i
41
(E)τ ij
12
(E)T μ, j
23
(E)τ j i
34
(E) , (7) which are obtained in analogy to the interatomic DMI param- eters.
III. RESULTS AND DISCUSSION A. Dzyaloshinskii–Moriya interaction
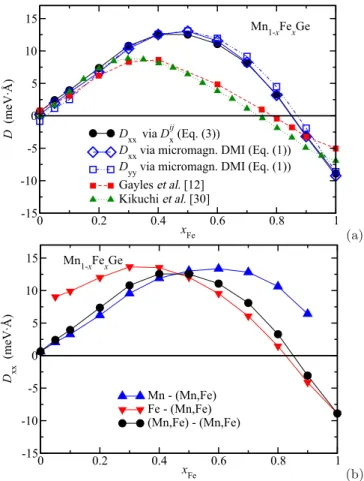
In the following we first focus on the behavior of the DMI in Mn 1 − x Fe x Ge as a function of Fe concentration x. The dependence of the DMI parameter D xx (x ) on x is plotted in Fig. 1(a) in comparison with available theoretical results from other groups [12,30]. The results calculated by using an explicit expression for D xx derived recently [20] are given by open diamonds, while those based on the interatomic interaction parameters D ij are given by solid circles. Although the latter value has contributions only from the D ij Fe-Fe , D ij Mn-Mn , and D ij Fe-Mn interatomic DMI pair interaction terms, both results are in very good agreement with each other. They also fit reasonably well to the theoretical results by other groups shown by dashed [12] and dashed-dotted [30] lines. The deviations between these and the present work are most likely caused by the different approach used to treat the chemical disorder in the alloy. As was mentioned above, the CPA alloy theory was used in the present work, while the previous results [12,30]
have been obtained by using the so-called virtual crystal
approximation. As follows from Fig. 1(a), D xx (x) changes sign
at x ≈ 0.8, in line with the experimental observation [11]. A
very similar concentration dependence is also observed for the
D yy (x) component (open squares). The deviation from D xx (x),
which is allowed by crystal symmetry (see Sec. III D), is itself a
function of x but small throughout. From the element-projected
plots shown in Fig. 1(b) one can see that D xx Fe (x) and D xx Mn (x)
0 0.2 0.4 0.6 0.8 1 x
Fe-15 -10 -5 0 5 10 15
D (meV·Å)
D
xxvia D
xij(Eq. (3))
D
xxvia micromagn. DMI (Eq. (1)) D
yyvia micromagn. DMI (Eq. (1)) Gayles et al. [12]
Kikuchi et al. [30]
Mn
1-xFe
xGe
(a)
0 0.2 0.4 0.6 0.8 1
x
Fe-15
-10 -5 0 5 10 15
D
xx(meV·Å)
Mn - (Mn,Fe) Fe - (Mn,Fe) (Mn,Fe) - (Mn,Fe) Mn
1-xFe
xGe
(b) FIG. 1. (a) Results for D
xx(x) in Mn
1−xFe
xGe calculated by using Eq. (3) (circles) and for D
xx(x) (diamonds) and D
yy(x) (empty squares) calculated by using using Eq. (2) in comparison with the results of other calculations from Ref. [12] (filled squares) and Ref. [30] (triangles). (b) The element-resolved Dzyaloshinskii–
Moriya interaction in Mn
1−xFe
xGe D
xxMn(triangles up) and D
Fexx(triangles down). The total D
xx(x) function is again shown as circles as in panel (a).
have their maxima at a different Fe concentration, i.e., at x ≈ 0.3 and x ≈ 0.6 for Fe and Mn, respectively. As one notes, D Fe xx (x ) changes its sign at x ∼ 0.8 if x increases, while D xx Mn (x) does not change sign. In the case of the DMI strength approaching zero, the system exhibits a ferromagnetically (FM) ordered structure. Grigoriev et al. [11] have reported the experimentally measured Curie temperature T C = 234.3 K for the Mn 1 − x Fe x Ge alloy at x = 0.75. The Curie temper- ature calculated via Monte Carlo simulations in the present work for x = 0.8 is T C ≈ 290 K, slightly overestimating the experimental value. Note however, that these calculations are based on exchange coupling parameters calculated for the FM reference state at T = 0 K, while more accurate results require calculations based on the magnetically disordered state, which can be performed within the so-called disordered local moment (DLM) scheme [31,32].
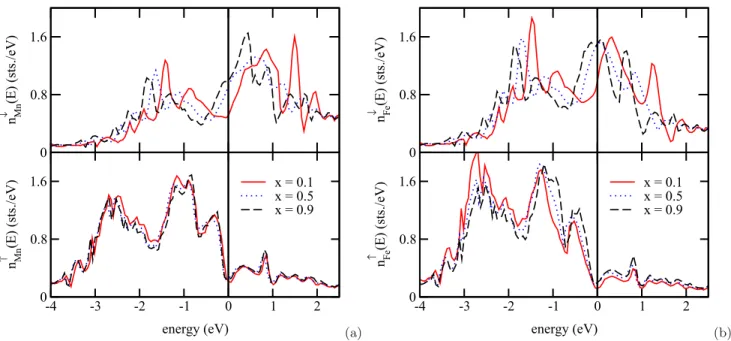
The observed concentration dependence of the DMI was associated in the literature [12,13,30] with specific features of the electronic structure and their modification with the Fe concentration x. Figure 2 shows corresponding results of electronic structure calculations making use of the CPA alloy theory, i.e., the spin- and element-resolved density of
states (DOS) on Mn [Fig. 2(a)] and Fe [Fig. 2(b)] sites in Mn 1− x Fe x Ge for the three different concentrations x = 0.1, 0.5, and 0.9. As one can see in the bottom panels, the occupied majority-spin states of Mn and Fe are very close to each other and hardly depend on the Fe concentration.
Obviously, chemical disorder has only a weak impact for this spin subsystem, leading to a rather weak disorder-induced smearing of the energy bands. This can be seen as well in Figs. 3(c) and 3(d), which show the Bloch spectral function for majority-spin states in Mn 0.9 Fe 0.1 Ge and Mn 0.1 Fe 0.9 Ge, respectively. On the other hand, the different exchange splitting for the electronic states on Mn and Fe sites leads to different positions for their minority-spin states and as a consequence to a pronounced disorder-induced smearing of the energy bands for the disordered Mn 1− x Fe x Ge alloys. Again this can be seen in the upper panels of Figs. 2(a) and 2(b), as well as in Figs. 3(a) and 3(b), showing the Bloch spectral function for minority-spin states in case of x = 0.1 and 0.9, respectively.
Moreover, the exchange splitting for Fe and Mn both decreases upon increasing the Fe concentration. As a consequence, the Fe and Mn spin magnetic moments decrease simultaneously, as can be seen in Fig. 4.
Figure 2 indicates that the concentration-dependent modi- fication of the electronic structure has twofold character. First, the Fe minority-spin d x ↓
2− y
2states move down in energy from their position above the Fermi level at small Fe concentration [x = 0.1, solid line in Fig. 2(b)] to a position below the Fermi energy at high Fe content [x = 0.9, dashed line in Fig. 2(b)].
Additionally, a weak shift of the majority-spin d xy ↑ states of Fe towards the Fermi energy can be observed. This behavior, as discussed previously [12,13], leads to a sign change of the Fe- projected as well as the total DMI at x ∼ 0.8. At the same time, Fig. 2(a) shows that the minority-spin d x ↓
2− y
2states of Mn stay essentially unoccupied over the whole concentration range. As a consequence, D xx Mn (x ) does not exhibit any sign changes. As the positions of the element-projected minority-spin states of Fe and Mn are rather different (see Fig. 2), the increase of the contributions of minority-spin Fe states with increasing x in parallel with the decreasing contribution of corresponding Mn states leads for the alloy system to an apparent shift of the electronic energy bands. According to Refs. [12,13], this should also lead to a sign change of the DMI parameter.
Finally, it is worth mentioning that there are different trends
in the behavior of the DMI parameter in the Mn-rich limit when
comparing theoretical results (both present and previous) with
experimental data [11]. As was remarked by Gayles et al. [12],
the origin of this difference is not clear and the authors suggest
certain mechanisms to be responsible for that. We would
like to add here that the micromagnetic DMI components
are the results of a summation of pair interactions over all
neighbors. Although the Mn-Mn DMI have in general even
larger magnitude than the Fe-Fe interactions, their summation
leads to a small total DMI due to their oscillating behavior
as a function of distance. This leads in the case of MnGe to
a significant compensation of all contributions. For a more
realistic description of the experimental situation at finite
temperature, involving in particular noncollinear spin texture,
Monte Carlo simulations based on atomistic spin models might
be important [33].
-4 -3 -2 -1 0 1 2 energy (eV)
0 0.8 1.6
n
↑ Mn(E) (sts./eV) 0 0.8 1.6
n
↓ Mn(E) (sts./eV)
x = 0.1 x = 0.5 x = 0.9
(a)
-4 -3 -2 -1 0 1 2
energy (eV) 0
0.8 1.6
n
↑ Fe(E) (sts./eV) 0 0.8 1.6
n
↓ Fe(E) (sts./eV)
x = 0.1 x = 0.5 x = 0.9
(b) FIG. 2. The spin- and element-resolved DOS on (a) Mn and (b) Fe atoms in Mn
1−xFe
xGe for x = 0.1, 0.5, and 0.9.
B. Spin-orbit torque
The torkance tensor element t xx (x) representing the spin- orbit torque (SOT) calculated for Mn 1 − x Fe x Ge within the Kubo formalism [22] is represented in Fig. 5(a) by filled squares. In contrast to D xx (x), it changes sign three times when x increases. However, one has to note that this behavior is caused by two contributions to the torkance, showing a quite different concentration dependence: the Fermi-surface contribution from electronic states at the Fermi energy (open circles) and the Fermi-sea contribution due to all states below the Fermi energy (filled circles). Both contributions vary nonmonotonically with x and both change sign at x ∼ 0.5,
having however an opposite slope in the vicinity of this point. As a consequence, their combination leads to a partial cancellation in the total torkance that has a completely different concentration dependence when compared with the individual contributions.
Despite similarities in the behavior of D xx (x) and the Fermi- sea torkance t xx sea (x), they change sign at different x values (0.8 and 0.5, respectively). To make a more detailed comparison, we calculate the Fermi-sea torkance by using the expressions in Eqs. (5) and (6). The results are plotted in Fig. 5(b) (triangles and squares, respectively) in comparison with the results based on the linear-response expression Eq. (4) (circles), demonstrating good agreement between all three types of
FIG. 3. The spin-resolved Bloch spectral function in Mn
0.9Fe
0.1Ge and Mn
0.1Fe
0.9Ge for (a), (b) minority- and (c), (d) majority-spin states,
respectively.
0 0.2 0.4 0.6 0.8 1 x
Fe0 0.5 1 1.5 2 2.5 3
m
spin( μ
B/atom)
Mn Fe
average per site (Mn,Fe) expt. [34]
Mn
1-xFe
xGe
FIG. 4. Spin magnetic moments of Mn (circles) and Fe (squares) in Mn
1−xFe
xGe alloy, and the average magnetic moment per site (diamonds). Experimental results of Kanazawa et al. [34] are shown as green triangles.
calculations. The difference in the concentrations when the D xx (x ) and t xx sea (x ) functions change sign can obviously be attributed to the weighting factor (E − E F ) in the expression for the DMI [20], which results in a different energy region
0 0.2 0.4 0.6 0.8 1
x
Fe-1.5
-1 -0.5 0 0.5 1 1.5 2
t
xx(10
-30C m)
Fermi surface Fermi sea total
(a)
0 0.2 0.4 0.6 0.8 1
x
Fe-1
-0.5 0 0.5 1 1.5 2
t
xx(10
-30C m)
Fermi sea of Eq. (4) via micromag. DMI (Eq. (5)) via interatomic DMI (Eqs. (6) & (7)) t
xxMn
t
xx Fe(b) FIG. 5. (a) Total torkance per unit cell (solid squares) as well as its Fermi surface (empty circles) and Fermi sea (filled circles) contributions in Mn
1−xFe
xGe calculated via the Kubo–Bastin for- malism [Eq. (4)]. (b) Comparison of Fermi-sea contribution to the torkance calculated via Eq. (4) (circles) with results obtained using the expressions (5) (triangles) and (6) (squares).
-2 -1.75 -1.5 -1.25 -1 -0.75 -0.5 -0.25 0 -2
0 2 4 6
d
xx(E)
x
Fe= 0.3 x
Fe= 0.9
-2 -1.75 -1.5 -1.25 -1 -0.75 -0.5 -0.25 0 E - E
F(eV)
-90 -60 -30 0 30
t
xx(E )
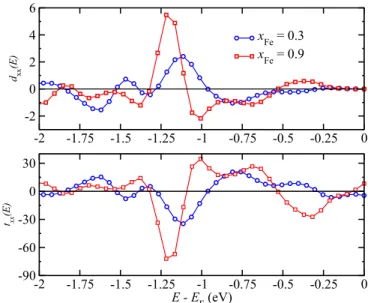
FIG. 6. Energy dependence of the DMI parameter D
xx(E) (upper panel) and the torkance t
xx(E) (lower panel) in Mn
0.7Fe
0.3Ge (circles) and Mn
0.1Fe
0.9Ge (squares). Integrated up to the Fermi energy E
F, these functions give t
xxand D
xx.
for the dominating contributions to the D xx (x) function when compared with the torkance term t xx sea (x ). This is demonstrated in Fig. 6, which gives the energy-resolved DMI parameter and the Fermi-sea torkance for two different Fe concentrations.
In addition, note that the contributions to t xx sea (x) associated with the alloy components Mn and Fe, shown in Fig. 5(b) by dashed and dash-dotted curves, change sign at different concentrations x. Nevertheless, because of the strong exchange interaction between these two components located on the same sublattice, one has to discuss the component-averaged torkance when considering the SOT in the alloy.
Finally, considering the Fermi-surface and Fermi-sea con- tributions to the SOT separately in the pure limits, i.e., for the MnGe and FeGe compounds [see Fig. 5(a)], one finds a different sign for these contributions. This allows us to conclude that the intrinsic torkance is mainly responsible for the sign change of the SOT when the Fe concentration changes from 0 to 1. It is determined by the characteristics of the electronic structure discussed above. On the other hand, in the case of disordered Mn 1 − x Fe x Ge alloys the extrinsic contributions to the SOT cannot be completely neglected.
Although small and only relevant at the Fermi surface, they are responsible together with the intrinsic contribution for the concentration dependence of the SOT and jointly determine the exact composition at which the torkance changes its sign.
C. Anomalous and spin Hall conductivity
To have a more complete picture of the SOC-induced
response to an external electric field in Mn 1− x Fe x Ge, we briefly
discuss the corresponding results for the transport-properties
anomalous Hall effect (AHE) and spin Hall effect (SHE) (see,
e.g., Refs. [35,36], respectively). As is the case for the current-
induced spin-orbit torkance, these phenomena are caused by
a SOC-induced spin asymmetry in the electron scattering.
0 0.2 0.4 0.6 0.8 1 x
Fe0 100 200 300
S
H= σ
xy/μ ( f. u. Ω
−1cm
−1μ
−1 B)
this work
Kanazawa et al. [34]
0 0.2 0.4 0.6 0.8 1
(a)
(b) x
Fe0 200 400 600
σ
xy(10
2Ω
−1m
−1)
this work Gayles et al. [12]
Kanazawa et al. [34]
FIG. 7. (a) Anomalous Hall conductivity calculated for Mn
1−xFe
xGe via the CPA–Kubo–Bastin formalism (circles), compared with calculations using the Berry-curvature approach and the virtual crystal approximation [12] (triangles), and with low-temperature experimental data (squares) [34]. (b) Anomalous Hall coefficient calculated via the Kubo–Bastin equation (circles) compared with experimental data at 50 K (squares) [34].
Because of this, one can expect certain correlations concerning their composition-dependent behavior.
For the investigated alloy system Mn 1− x Fe x Ge, the anoma- lous Hall conductivity (AHC) σ xy calculated within the Kubo–
Bastin formalism [Eq. (4)] is given in Fig. 7(a) as full circles. As can be seen, σ xy does not change sign in going from MnGe to FeGe, in agreement with previous first-principles calculations [12] and experiment [34]. Note that the chemical disorder is treated on fundamentally different levels in the two theoretical approaches. While the present work employs the coherent- potential approximation, the results of Ref. [12] are based on the virtual crystal approximation. This difference should be mainly responsible for the deviations between the two sets of theory data visible in the upper panel of Fig. 7, which are most pronounced on the Fe-rich side of the concentration range where even the signs appears to differ. As shown later, however, this is not due to the extrinsic or incoherent contributions.
Unfortunately, reliable experimental data in this region could not be obtained because both the Hall and the longitudinal resistivity are small under the experimental conditions [34].
Comparison of the anomalous Hall coefficient S H = σ xy /μ to the experimental results of Kanazawa et al. [34] in the lower panel of Fig. 7 shows good agreement for the Mn-rich side of the concentration range (except for pure MnGe, see
0 0.2 0.4 0.6 0.8 1
x
Fe0 200 400 600
σ
xy(10
2Ω
−1m
−1)
surf
0(× − 0.1) surf
1(NV) surf
1(VC)
sea
0(×0.1) sea
1(NV) sea
1(VC)
tot (NV) tot (VC)
(a)
0 0.2 0.4 0.6 0.8 1
x
Fe−250 0 250 500
σ
z yx(10
2Ω
−1m
−1)
(b) FIG. 8. (a) Anomalous and (b) spin Hall conductivities σ
xyand σ
xyz, respectively, as functions of x in Mn
1−xFe
xGe calculated via the Kubo–Bastin formalism. Fermi- surface contributions are given in red, those from the Fermi sea in blue, and their sum in black.
The superscripts 0 and 1 indicate on- and off-site terms. Results for the latter are shown excluding (NV) and including vertex corrections (VC).
below), while deviations on the Fe-rich side are quite large.
Here one should note that the measurements were performed at 50 K while the calculations assume T = 0 K, meaning in particular perfect ferromagnetic order. As can be seen in Fig. 3 of Ref. [34], the temperature dependence of magnetization as well as anomalous Hall conductivity is quite substantial for MnGe and even more so for FeGe. As mentioned above for the anomalous Hall conductivity, the experimental uncertainty is in addition rather high in the pure-Fe limit. For a more detailed understanding of these discrepancies investigations including the effects of finite temperature, sample geometry, and noncollinear magnetic structure are necessary.
Having a closer look at the Kubo–Bastin equation (4), one can decompose the full response coefficient into several contributions with distinct physical meaning. Most obviously, the two terms R I xy and R I I xy differ in the absence or presence of contributions from occupied states below the Fermi level, i.e., these are the Fermi-surface and Fermi-sea terms, respectively.
They are plotted in Fig. 8(a) in red (Fermi surface) and blue
(Fermi sea), further decomposed into on-site (surf 0 and sea 0 ,
crosses) and off-site (surf 1 and sea 1 , squares and triangles,
respectively) contributions. For the latter results are shown once excluding (NV, empty symbols) and once including the so-called vertex corrections (VC, full symbols) arising from the difference in the product of configuration-averaged Green’s functions versus the configuration average of the product. These give rise to the so-called extrinsic or incoherent contribution and are connected to the scattering-in term of the Boltzmann equation [37].
Comparing now the various terms, one first of all notices that on-site terms are large [note that they are scaled by a factor of (−)0.1], opposite in sign and almost identical in magnitude, leading to an almost perfect cancellation. Turning to the off-site terms one observes a similar concentration dependence and a dominance of the Fermi-surface contribution, except for x 0.1 and at the Fe-rich side of the concentration range.
This means that the anomalous Hall conductivity is dominated by the states at the Fermi level, in particular for intermediate concentrations. Obviously, already for this reason a clear cor- relation between anomalous Hall coefficient and DMI strength, as suggested by Kanazawa et al. [34], is not supported by our findings. Finally, the vertex corrections are, as observed before [22,38,39], only relevant for the Fermi-surface term and in this system only noticeable in the dilute limits, particularly on the Fe-rich side. Note that, as discussed before, there the density of states at the Fermi level is largest and has predominantly d-like character. Interestingly, the seemingly diverging behavior for x → 0 (1) is not caused by the extrinsic contribution [24].
Because the same spin-dependent scattering mechanisms are responsible for the SHE and AHE, both, transverse spin and charge currents can be present in the FM-ordered Mn 1 − x Fe x Ge system. However, in contrast to σ xy , the transverse spin con- ductivity σ xy z shown in Fig. 8 (bottom) does change its sign at x ∼ 0.7. Thus, the total transverse current should be dominated by opposite spin characters in these limits. Interestingly, the AHC has a minimum of its absolute value close to the Fe concentration corresponding to the sign change of the SHC.
In fact, the Fermi-sea contributions to σ xy and σ xy z as well as both on-site terms behave very similarly over the entire concentration range, whereas the Fermi-surface contributions agree only on the Mn-rich side up to the minimum or sign change, respectively.
The spin Hall conductivity of the Mn 1 − x Fe x Ge alloy system presented in Fig. 8 (bottom) as a function of Fe concentration changes sign approximately at the same composition as the DMI parameter D xx and, accordingly, also the torkance t xx . However, one can again see a leading role of the Fermi-surface contribution to the spin Hall conductivity, in particular at the Fe-rich side after the sign change. This implies that the sign of the SHE conductivity is determined to a large extent by the character of the states at the Fermi energy and their spin-orbit coupling, which changes with concentration according to the discussion above. Note however, that in pure FeGe the Fermi- surface and Fermi-sea contributions are of equal magnitude but opposite sign, leading to their partial cancellation. Concerning the importance of the vertex corrections the spin Hall conduc- tivity behaves again similar to the AHC, in as much as they are only present at the Fermi surface and negligible over the entire concentration range considered here—again apart from the Fe-rich limit.
A more detailed analysis of the anomalous and spin Hall conductivities in terms of underlying scattering mechanisms based on their scaling behavior with respect to the longitudinal (charge) conductivity in the dilute limits has been so far precluded by the large numerical cost and is left for future work.
Note also, that the anomalous and spin Hall conductivities in the present work were calculated for the FM structure.
Introducing a chiral noncollinear spin texture, one can expect additional contributions from the topological anomalous [6]
and spin Hall [40] effects, most likely displaying different concentration-dependent features.
D. Symmetry considerations
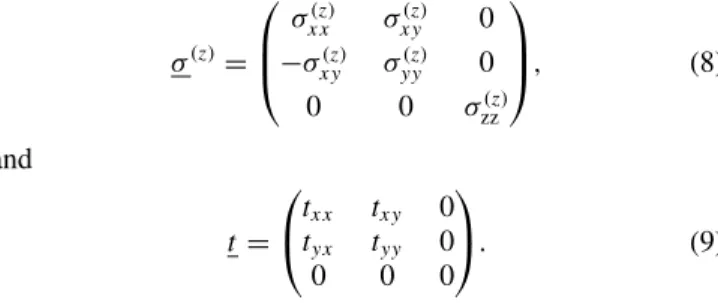
We conclude with a few remarks on magnetic symmetry and the corresponding shapes of the response tensors discussed above. The B20 structure of the Mn 1− x Fe x Ge alloy system has the (nonmagnetic) space group P 2 1 3, for ferromagnetic order with magnetization along z (one of the 2 1 axes), this leads to the magnetic space group (MSG) P 2 1 2 1 2 1 , the magnetic point group (MPG) 2 2 2, and finally the magnetic Laue group (MLG) m m m (or 2 2 2 in the convention of Ref. [41]). The corresponding symmetry-allowed tensor forms for electrical (σ) and spin (σ ξ ) conductivity [42] and the current-induced torkance [22] are 1
σ (z) =
⎛
⎜ ⎝
σ xx (z) σ xy (z) 0
− σ xy (z) σ yy (z) 0 0 0 σ zz (z)
⎞
⎟ ⎠ , (8)
and
t =
⎛
⎝ t xx t xy 0 t yx t yy 0
0 0 0
⎞
⎠. (9)
Note that this is not the highest symmetric FM-ordered structure because for m (111) (along the three-fold axes) one would have MSG R3, MPG 3, and MLG ¯3, leading to the tensor shapes
σ (z) =
⎛
⎜ ⎝
σ xx (z) σ xy (z) 0
− σ xy (z) σ xx (z) 0 0 0 σ zz (z)
⎞
⎟ ⎠ , (10)
and
t =
⎛
⎝ t xx t xy 0
− t xy t xx 0
0 0 0
⎞
⎠. (11)
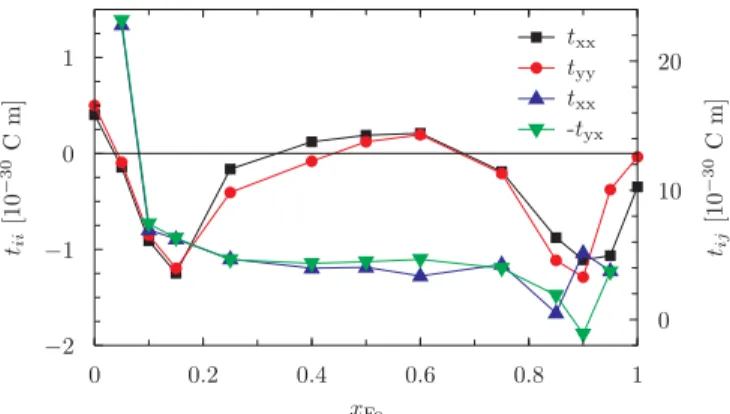
Figure 9 shows all nonzero tensor elements of t for m z as chosen in this work. Apparently, the deviations between the diagonal torkances t xx and t yy are negligibly small over the whole concentration range; the largest differences occur once more on the Fe-rich side. For the off-diagonal torkances, t yx − t xy holds as well with the above exception. Note, that these torkances, in contrast with t xx and t yy , only contain contributions from the Fermi surface, as discussed before [22]
1