of the Nasca Lines at Palpa, Peru: An Overview
Karsten Lambers
1, 2, Martin Sauerbier
1and Armin Gruen
11
ETH Zurich, Institute of Geodesy and Photogrammetry, ETH Hoenggerberg, CH 8093 Zurich, Switzerland, www.photogrammetry.ethz.ch
{lambers, sauerbier, agruen}@geod.baug.ethz.ch
2
University of Zurich, Department of Prehistory, Karl-Schmid-Str. 6, CH 8006 Zurich, Switzerland, www.prehist.unizh.ch
Abstract.
As part of a long-term project to investigate the cultural history of the Nasca region in southern Peru, the famous Nasca lines, or geoglyphs, have been documented since 1997 in a joint effort by archaeologists and geomatic engineers. The project aims on the one hand at a new interpretation of the geoglyphs based on solid field data. On the other hand, it is thought of as a contribution to the preservation of the geoglyphs. Prior to the start of the project, the geoglyphs had never been adequately recorded. In a new approach that combined aerial photogrammetry with archaeological fieldwork, we thoroughly documented more than 1 500 geoglyphs in the vicinity of Palpa. While different aspects of this work have been described in previous reports, this paper offers an overview of the technical procedures from data acquisition to processing, modeling, and visualization.
Keywords:
Photogrammetry, 3D Modeling, Conceptual Data Modeling, DBMS, Visualization, Nasca Lines
1. Introduction
The study area of the Nasca-Palpa project is the region around the modern town of Palpa, about 400 km south of Lima in the coastal desert at the foot of the Andes (Fig. 2). Along with a regional settlement survey (Reindel et al. 1999) and excavations at important sites (Reindel and Isla 2001), the investigation of the geoglyphs dating from Late Paracas to Nasca times (400 BC – AD 600) is a major task of the project (Reindel et al. 2003). The geoglyphs, generally associated with the Nasca culture (Silverman and Proulx 2002) are located on desertical ridges and plateaus (pampas) framing rivers that originate in the Andean highlands. The geoglyphs were created on the rocky desert surface by removing the upper level of dark stones – the desert pavement – to reveal the brighter sandy layer below (Aveni ed. 1990). The geoglyphs are distributed over a vast and hardly accessible terrain. Their documentation is therefore a challenging task. A novel approach for large-scale geoglyph documentation, which integrated both photogrammetric and archaeological procedures, enabled us to map more than 1 500 geoglyphs in the Palpa area, and furthermore to create a digital database – containing geometric as well as descriptive data – suitable for a GIS-based analysis of the geoglyphs and their environment (Gruen et al. 2003). This paper focuses on technical aspects of our work, while archaeological results will be presented elsewhere (Lambers 2004).
2. Photogrammetric-Archaeological Workflow
Prior to our project, photogrammetry (Mikhail et al. 2001) had only once been employed to document the geoglyphs in the Nasca region (Hawkins 1974), but with mixed success since the work did not involve archaeological expertise. Con se -
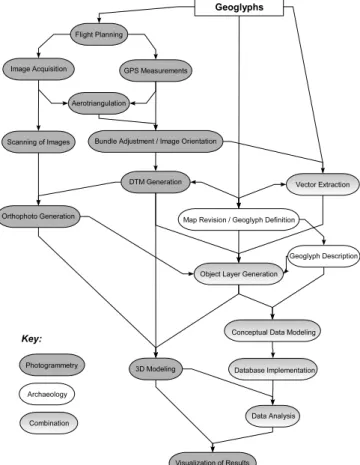
quently, the recording of the Palpa geoglyphs was ac comp - lished from the outset in close cooperation between geomatic engineers and archaeologists. While the former developed and im plemented the required technical tools, the latter conducted the actual geoglyph recording. The steps of the workflow (Fig. 1) are described in the following.
Fig. 1.
Workflow for geoglyph recording, modeling, and visualization.
2.1 Flight Planning
Geoglyph mapping was based on high resolution aerial images. Two image blocks were defined over the Palpa area so as to cover the zones with geoglyphs alongside the valleys.
The smaller block covered Cresta de Sacramento, a low ridge northwest of Palpa between Río Grande and Río Palpa that was the main study area when archaeological fieldwork started in 1997. The flight was planned so as to yield vertical aerial images at a scale of 1 : 5 000, organized in parallel strips with 60% overlap in both directions in order to allow full stereoprocessing. The original plan was to take color photographs. When the 1997 flight did not deliver good enough results (see chapter 2.2), it was decided to commission a second flight one year later in order to take b/w photographs of the same area. By then, the project area had been extended to include also the pampas of San Ignacio and Llipata, to the southeast of Palpa (Fig. 2). Thus, a second block was defined over that area. The flight height was defined according to the desired image scale, and the positions of the intended image centers were marked on a topographic map. This data was then passed on to Horizons Inc., Rapid City, SD, U.S., a private company that carried out the actual flights.
2.2 Image Acquisition
On May 1, 1997, the first photogrammetric flight was performed over Cresta de Sacramento. The flying height was approx. 750 m above ground. Using a calibrated Zeiss RMK A15/23 aerial camera with a focal length of 152.994 mm, 212 color photos were taken along 8 parallel strips. After the flight the images turned out to be partially scratched and blotchy.
Furthermore, their color was not ideal to discern the geoglyphs, and an intensity falloff was visible towards the image edges. Therefore, a second photo flight was undertaken
the following year. On May 23, 1998, 169 b/w images arranged along 8 strips over Cresta de Sacramento as well as 215 images along 11 strips over the pampas of San Ignacio and Llipata were taken. Since Cerro Carapo, to the northeast of Palpa between Río Palpa and Río Viscas (Fig. 2), had also to be covered by the aerial images, the first strips of the second block covered a good part of the floodplain and the town of Palpa, too. Thus, although not intended from the start, the photos of both blocks actually overlap slightly in the central part of the flown area (approx. 20% decreasing towards NE), which later on allowed to merge the two blocks into one. All in all, the b/w aerial images taken in 1998 cover a roughly rectangular, SW-NE oriented area of approx. 89 km2 around the town of Palpa. The average image scale turned out to be approx. 1 : 7 000, which was still good enough for our purposes. Unlike the color photos, the contrast of the b/w images allowed to discern even narrow lines, and the image quality was generally good. Thus, the 1998 images were used for analysis.
2.3 GPS Measurements
In order to obtain control data to orient the images spatially, GPS was used in two different modes. In 1997, nine signalized ground control points were evenly distributed over Cresta de Sacramento whose position had been determined with differential GPS. Furthermore, kinematic GPS measurements were performed onboard the plane that served as approximations for the positioning of the projective centers. During the second flight in 1998, kinematic GPS could not be used, and the signalized points were no longer available. The latter problem could be solved by performing a joint bundle adjustment of both the 1997 color images and the 1998 b/w images of the first block (see chapter 2.5). In the second block over San Ignacio and Llipata, however, no ground control points had been prepared. Therefore, in 1999 nine natural points were measured in that area, again using differential GPS. That way, solid GPS control data for both blocks was available for image orientation. All GPS coordinates were transformed to UTM zone 18 S projection with WGS 84 datum, on which the topographical maps of the area are based.
2.4 Aerotriangulation
For relative orientation, 5 to 10 tie points clearly identifiable
in the overlapping area of two adjoining images had to be
measured. Image matching is nowadays usually performed in
an automated mode. However, the Palpa aerial images show
largely the desert surface, which is very homogeneous in
texture and provides little contrast. As several tests showed,
matching algorithms implemented on different commercial
systems failed to produce acceptable results due to this lack of
texture (Gruen et al. 2000). Thus, tie point measurements had
to be done manually on the analytical plotters Wild AC3 and
S9. In the Sacramento block, not only tie points to link images
within the b/w series had to be measured, but also tie points to
link the b/w images to the color images in which the
signalized ground control points were visible. 211 images
Fig. 2.The Palpa area in southern Peru.
(134 b/w and 77 color images) were triangulated in this block.
In the San Ignacio block, tie points and ground control points were measured within the b/w image series. Here, 168 out of 215 images were triangulated. The lower number of images used for triangulation as compared to existing images is due to the fact that on block margins, mountainous areas without geoglyphs were omitted for the sake of efficiency.
2.5 Bundle Adjustment and Image Orientation
When all images had been tied together via tie points and linked to the ground control points, a joint bundle adjustment for each block was performed using the inhouse software BUN. As a result, all images were provided with orientations relative to each other and absolute in the UTM zone 18 coordinate system. Table 1 summarizes the triangulation characteristics of both blocks.
The achieved ground accuracy was good enough for the intended purpose. The oriented images were used in pairs of two overlapping images (stereopairs) for 3D measurements.
2.6 DTM Generation
As a prerequisite for the intended geoglyph study, a highly accurate digital terrain model (DTM) was needed. The matching problems described above meant that automatic DTM generation was not feasible. Therefore, measurements were undertaken again manually, which allowed to measure a DTM as opposed to a DSM (digital surface model). 72 stereopairs from Sacramento and 94 models from San Ignacio were used for measurements. Points were obtained along parallel profiles at a distance of 20 m.
Along these profiles, the distances between measured points depended on terrain shape: in flat areas less points were measured than in mountainous terrain. Special attention was paid to zones with geoglyphs. In addition to profiles, breaklines were measured along abrupt changes in the terrain.
In a first iteration, only the actual terrain surface was measured. Later on, points measured during vector extraction (see chapter 2.9) were added in order to enhance point density especially in areas with geoglyphs. All in all, approx. 1.4 million points were measured in an area of roughly 89 km2, corresponding to an average density of 1.6 points/100 m2.
Based on this data, the DTM was generated using DTMZ, another inhouse software that performs Delauney triangulation and bicubic finite element interpolation. Originally, two separate DTMs were generated that corresponded to the two original image blocks. Since the blocks overlapped slightly, they could later on be merged into a single, continuous DTM.
The file size is approx. 480 MB in ASCII xyz-format.
2.7 Scanning of Images
The analog images were scanned at high resolution on calibrated photogrammetric scanners in order to create an easily accesible photographic record of all geoglyphs and to produce an orthoimage as texture for the DTM. The Sacramento images were scanned at a resoultion of 21 µm pixelsize on the Agfa Horizon image scanner at IGP, whereas the San Ignacio images were scanned at the same resolution on the Zeiss SKAI scanner at the Swiss Federal Office of Topography (Swisstopo, Wabern). The resolution corresponds to a footprint of 15 cm on the ground, which ensures that even the most narrow lines are still visible. Like in the DTM measurements, marginal images showing only mountainous areas were omitted for the sake of efficiency. The images were stored in TIFF format. The file size is 2.15 Gbyte.
2.8 Orthophoto Generation
The scanned images could be oriented on the basis of the bundle adjustment. With the DTM as geometric reference, they were combined into an orthomosaic on Socet Set DPW 770 (LH Geosystems). Like the DTM, the orthophoto was initially generated in two blocks. Later, when all necessary data had become available, a complete orthophoto was generated covering the whole study area. According to different requirements, orthomosaics with different resolutions (25 cm to 2 m pixelsize) were produced.
2.9 Vector Extraction
The actual feature extraction, i.e. the 3D mapping of the geoglyphs, was accomplished again on analytical plotters using the XMAP software by Aviosoft. In each oriented stereopair, outlines of visible geoglyphs were marked with 3D vectors. Only actually preserved, or securely deducible, borders of geoglyphs were mapped. After a first iteration the vector data was revised in the field (see chapter 2.10) and then corrected and complemented in a second iteration. That way, 33 243 3D vectors were produced. A peculiarity of this dataset was that no given vector represented the entire outline of a single geoglyph; rather, it usually showed only a small part of its border (Sauerbier and Lambers 2004). This was due to the state of preservation of the geoglyphs: many borders were interrupted where erosion had washed them away or where geoglyphs had been partially covered by other geoglyphs. Furthermore, many geoglyphs did not have clearly defined borders on all their sides even if they were well preserved. Thus, the result of vector extraction was a huge number of unconnected 3D vectors. With this data, a vector layer was generated that could be exported into DXF format for further processing. The file size of the vector layer is 20 MB. In a separate step, modern elements (buildings, roads etc.) were mapped, too, in order to allow easier orientation. This was done in a generalizing way. The outlines of modern buildings, roads, bridges, etc. were marked and stored in a separate dataset. The corresponding DXF file has a size of about 9 MB.
Block Images used Control points
Kinematic
GPS m
Sacramento 134 b/w
77 color 8 signalized yes 13.3
San Ignacio 168 b/w 9 natural no 9.5
Table 1.
Triangulation characteristics of the image blocks over Palpa.
2.10 Map Revision and Geoglyph Definition
Maps derived from 3D data were revised in the field in order to improve their quality. Archaeological fieldwork started in 2000 and lasted eight months distributed over three field campaigns. To produce paper maps, different data sets were combined. Contour lines with an equidistance of 10 m were derived automatically from the DTM and shown as background of the geoglyph outlines. Furthermore, the modern element layer was added to allow easier orientation in the field. The datasets were combined in ArcView 3.2 and complemented with a coordinate frame. Maps in A3 format at scales ranging from 1 : 1 000 to 1 : 100 were taken into the field. Each geoglyph was located with the aid of these maps.
Since the maps showed only disconnected sections of borders, vectors belonging together had first to be determined. That way, approx. 1 500 geoglyphs were defined. Then, the maps were corrected. Although many details had been visible in the stereopairs, there was still more to see on the ground. Badly preserved parts of geoglyphs, like eroded edges, sections covered by other geoglyphs, or geoglyphs in sandy terrain were usually better discernable on the ground. Furthermore, footpaths or erosion channels erroneously identified as geoglyphs in the photos could be distinguished from actual geoglyphs in the field. Once the maps had been revised, they were taken back to the analytical plotter. Reviewing the stereopairs a second time, incorrect 3D vectors were deleted and missing 3D vectors added. The quality of the 3D recording could that way be enhanced considerably.
2.11 Geoglyph Description
The descripition of each mapped and defined geoglyph absorbed most of the time during fieldwork. A feature sheet was used whose standardized categories helped registering all geoglyphs in a comparable way. Categories that had to be filled out included description of the geoglyph itself, its surroundings, orientation, size, shape, stratigraphy, associated cultural remains, state of preservation, etc. The feature sheet was designed so as to structure the data as far as possible in order to enable its import into a database and its analysis using queries. However, the category “general description” also allowed a comprehensive textual description of each geogplyph in cases where the structured categories could not cover all aspects. Once the geoglyphs had been recorded in the field, the descriptive data was fed into a preliminary MS Access 2000 database.
During fieldwork, finds on or close to geoglyphs were surveyed, and their cultural affiliation based on stylistic traits was registered. A find inventory typically consisted of pot - sherds, while lithics, textiles and bones constituted con si - derable smaller parts of the whole repertoire. General re marks on the nature, composition, cultural affiliation and location of finds on each geoglyph were noted on the feature sheet.
Due to time constraints, only the geoglyphs on Cresta de Sacramento and Cerro Carapo could be described at large, whereas in the San Ignacio block, basically five geoglyph sites were registered in detail. Furthermore, there was no time to sample finds systematically. Nevertheless, due to the
photogrammetric mapping accomplished prior to the field campaigns, fieldwork proved to be much more efficient than in previous projects since no surveying work had to be carried out. The same applies to photos: since the aerial images already constituted a complete photographic record of all geoglyphs, only a few photos were taken in the field in order to show ground views of typical geoglyphs of different types.
2.12 Object Layer Generation
After the revision of the geoglyph vectors, these still represented only preserved or securely deducible border sections of geoglyphs. Thus, the next step was to combine vectors into closed polygons representing the most likely original shape of each geoglyph. The goal was to create 3D objects that could be linked with the corresponding geoglyph description. In a first step it was tried to convert the vectors into polygons in ArcView 3.2 (Sauerbier and Lambers 2004).
However, this procedure did not yield satisfactory results. The task could better be accomplished in ArcMap, a module of ArcGIS 8.3. Here, the revised vector layer (converted from DXF format to a 2D shapefile) was displayed with a high resolution orthoimage in the background. Based on what was visible in the orthoimage and what was known about the geoglyphs from fieldwork, the existing vectors were complemented in such a way that the most likely original outline of the geoglyph was marked by a continuous line.
Using the topology tools available in ArcMap, polygons could then be automatically generated from these polylines. The resulting polygons, however, still did not represent specific geoglyphs for three reasons:
●
During automatic calculation, all potential polygons were calculated, including unaltered surface areas completely surrounded by geoglyphs.
●
In all cases where geoglyphs overlapped, each polygon represented only a section of a given geoglyph.
●
For the same reason, some polygons formed a part of several geoglyphs. Where one geoglyph crossed another one, the overlapping area pertained to both geoglyphs.
In order to define which polygon pertained to which geoglyph, each polygon was assigned the corresponding geoglyph ID adopted from the feature sheet. This part of the work had to be done manually. Where geoglyphs overlapped, the corresponding polygons were assigned two geoglyph numbers. Finally, all redundant polygons could be automatically deleted. The result was a data layer with polygons clearly identifiable as pertaining to specific geoglyphs. These polygons were stored in a separate 2D shapefile (filesize: 2 MB). The height dimension was added to the polygons by intersecting them with the DTM.
2.13 3D Modeling
One aim of the documentation of the Palpa geoglyphs was to
produce a highly accurate and detailed virtual 3D model of the
geoglyphs and their environment that would allow to navigate
through it in real-time and in which each geoglyph would be
shown as 3D object. Four different elements were used to
generate the 3D model:
●
the DTM showing the topography of the area around Palpa,
●
the orthomosaic as photorealistic texture showing the environment,
●
the vector layer showing the preserved outlines of the geoglyphs, and/or
●
the polygon layer showing the most likely original shape of the geoglyphs.
The 3D model constitutes a complete, digital 3D docu - mentation of the geoglyphs and their environment as of 1998.
Its visualization is described in chapter 2.17.
2.14 Conceptual Data Modeling
Once descriptive, geometric and image data on the geoglyphs had become available, the next task was the development of a conceptual data model to organize the data. This was done in Rational Rose 2002, a software which allows to graphically structure hybrid datasets using the object-oriented Unified Modeling Language (UMLTM). All information was structured around a supertype containing attributes available for all geoglyphs (Lambers and Sauerbier 2003: Fig 3). The actual geoglyphs were assigned to subtypes arranged in hierarchical order corresponding to the descriptive geoglyph typology developed in the process of archaeological analysis (see chapter 2.16). These subtypes inherited all attributes defined for the supertype and may have additional attributes.
Chronological information was modeled in a twofold way.
Stratigraphic relations between overlapping geoglyphs were shown in a stratigraphy class assigned to the supertype.
Datable fineware ceramics, the main vehicle for geoglyph dating, were modeled similar to the geoglyphs themselves. A ceramic supertype related to the geoglyph supertype had several subtypes representing chronological phases which ceramics could be assigned to. Geometric information for each geoglyph (shape, coordinates) was stored in a geometry class containing the polygon layer. Further data not related to single geoglyphs – DTM, orthoimages, vector maps etc. – is also present in the conceptual data model, which has been described in more detail elsewhere (Lambers and Sauerbier 2003).
2.15 Database Implementation
While the conceptual data model was hard- and software independent, for the Nasca-Palpa project it was decided to implement it using an object-relational Oracle 9i DBMS that would serve as central data storage and management facility for all later work. The prerequisite was that the DBMS should provide versatile functionalities for data definition, editing and retrieval from different platforms using standard procedures like SQL, and its structure should be flexible enough so as to allow incorporation of additional data resulting from analyses of the original data. The database should also serve as basis of the GIS. Since ArcGIS 8.3 was chosen as GIS tool, the link to the database could be established using ArcSDE, ESRI’s server application that allows to connect ArcGIS to different DBMS. The object- oriented data structure based on the conceptual data model was implemented in an object-relational tablespace using
SQL data definition language (DDL). The archaeological data was then stored into the defined tables by first importing the MS Access tables into Oracle 9i and then distributing the attribute data into the table structure accordingly. For the import of geometric data, the ArcGIS toolbox was used to generate Oracle spatial data objects from the 2D polygon shapefile as well as DTM (2.5D) and images in Oracle raster format. To establish the predefined relations between geometric and archaeological data, as well as for visual error checking, scripts were developed in Visual Basic for Applications (VBA) that allowed convenient data editing via the graphical user interface of ArcGIS.
2.16 Data Analysis
Analysis of the data of the Palpa geoglyphs aimed at a new interpretation of the geoglyphs in their cultural context.
Starting from a recent hypothesis that explains the geoglyphs of the Nasca region in the framework of Andean traditions of social organization, religious concepts, and principles of spatial and temporal order (Aveni ed. 1990, Silverman and Proulx 2002), data of the Palpa geoglyphs was analyzed concerning geoglyph chronology, construction, formal development, spatial patterning, associated finds and structures, use, etc. The first analytical step, the elaboration of a descriptive typology, was accomplished in the process of data modeling (see chapter 2.14). Once the structured data was available in the DBMS, it could be analyzed in different ways:
●
Using SQL, information was queried according to specific research problems.
●
Using tools for spatial analysis available in ArcGIS 8.3, geoglyph data and terrain data were related and searched for recurrent patterns.
The results of these archaeological analyses will be presented elsewhere (Lambers 2004).
2.17 Visualization of Results
This step comprised on the one hand the visualization of the 3D model, on the other hand the illustration of results of analyses. This was accomplished by generating virtual 3D views and 2D paper maps.
The most advantageous way of visualizing the Palpa 3D model was the generation of virtual views (either static or dynamic). A virtual 3D model allows to review the situation in every given part of the study region on-screen, i.e. in the office during analysis. A major constraint was the amount of data to be processed. Due to the large amount of phototexture of the Palpa model, about 2.7 GB of data had to be visualized.
The aim was to achieve this on a common PC platform.
To generate synthetic still views of subsets of the 3D model at
high resolution, ERDAS Imagine Virtual GIS 8.4 by Leica
Geosystems was employed. This software yields good results
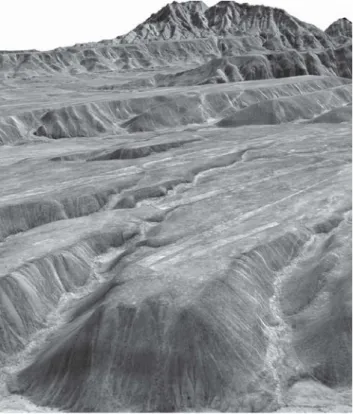
concerning the quality of the phototexture (see Fig. 3 and
examples in Reindel et al. 2003). The integration of vector
and polygon layers is possible, but vectors (albeit not
polygons) are often blurred. Furthermore, the capabilities are
rather limited concerning the size of the data set to be
processed. On the other hand, the ERDAS software allows the generation of short fly-throughs and offers some basic GIS functionalities like viewshed analysis.
In order to visualize the Palpa 3D model in its entirety in real- time, i.e. allowing interactive navigation through the model, high-end visualization software with Level-of-Detail capability (LoD) was needed. A prerequisite for such an approach was the generation of data pyramids (vector and raster data). For the Palpa model, commercial software with LoD capability was used for real-time visualization. In Terra Explorer 3.0 of Skylinesoft, the hybrid input data (2.7 GB of phototexture, DTM data, and vector data) was compressed to a single file of roughly 600 MB. The model could be edited by the user, and additional data (predefined 3D objects, tabular data etc.) could be integrated. The user interface allowed the incorporation of further elements, like overview maps or the project website. Free navigation through the 3D model was possible via keybord or joystick control. Fixed viewpoints could be defined and automatically approached, e.g. over certain geoglyphs. Flights through the model were interactively defined and recorded to an export file, e.g. in AVI format. A problem here was that image resolution was not as good as input data would allow, and in recorded flights, the limits of the area shown in highest resolution were clearly visible against areas displayed in lower resolution. Another major disadvantage was that objects from a vector layer were either blurred or not correctly mapped onto the surface. On the other hand, a pro of the Terra Explorer was that it allowed to integrate self-defined objects into the model, e.g. in the Palpa case virtual posts like those found in excavations on the geoglyphs. All in all, the Skyline software proved to be a comfortable tool for interactively exploring the photorealistic 3D model, but with certain limitations. The pros and cons of
the Skyline software have been discussed in more detail elsewhere (Sauerbier and Lambers 2003).
Another way to visualize the 3D model was the generation of 2D paper maps derived from available 3D data (see examples in Reindel et al. 2003). Although maps do not tap the full potential of the available data, the fact that reliable maps of the Palpa geoglyphs could be easily generated was a major step forward in Nasca archaeology, since the lack of good maps of the geoglyphs has hampered a serious analysis and interpretation of the Nasca lines for a long time. The Palpa data is available in digital form and organized in layers with different content. According to the required purpose, this allowed on the one hand free data scaling, and on the other hand the combination of different layers. While geoglyph layers (polygons and vectors) and the layer containing modern elements (roads, buildings etc.) were shown largely unaltered on the maps, the DTM was replaced by a contour line layer derived from it. The orthophoto layer may also be integrated into the map design. Both ArcView 3.2 and ArcMap 8.3 offer user-friendly tools for easy map production. The combined layers could easily be layouted and complemented with coordinate frames, legends, scale bars, etc. Not only entire datasets, but also selections based on queries were generated using predefined map templates in order to ensure comparable results. That way, e.g. only geoglyphs of a certain type or time period could be automatically selected to be shown on the map. Labels, charts, symbols, etc. could then be added to explain the illustration. For printout, files were exported to standard raster or vector file formats, like EPS, TIFF, etc.
All in all, different ways of visualizing the 3D model proved fruitful for different purposes. The production of 2D maps was important for fieldwork, but has also been used for illustration of results (Lambers 2004) and in the new Palpa site museum. On-screen visualizations of the virtual model were important for presentation, yet also for research, since a detailed reconstruction of the study region was constantly available during analysis.
3. Conclusions
The work described here is the first successful attempt to record the geoglyphs of the Nasca area completely, in 3D, and with high accuracy. The documentation is on the one hand an important step towards the protection and long-term pre - servation of the Palpa geoglyphs. On the other hand, the comprehensive database enables a wide variety of archaeo - logical analyses that will lead to a better under standing of the function and meaning of the geoglyphs in their cultural- historic context.
Moving beyond the situation in Palpa, aerial photogrammetry has proven a powerful tool to efficiently document large sites in arid environments. In the desert on the Peruvian coast, many hitherto unrecorded prehispanic sites are nowadays in imminent danger of being destroyed by modern land use.
Modern aerial photogrammetry can help to prevent the loss of these sites.
Fig. 3.