• Keine Ergebnisse gefunden

Immaterielle Vermögenswerte

N/A
N/A
Protected

Academic year: 2021

Aktie "Immaterielle Vermögenswerte"

Copied!
139
0
0

Wird geladen.... (Jetzt Volltext ansehen)

Volltext

(1)

Hannes Frey

Immaterielle Vermögenswerte

Bewertung, Bilanzierung und

Unternehmensperformance

(2)
(3)

Hannes Frey

Immaterielle Vermögenswerte

Bewertung, Bilanzierung und Unternehmensperformance

Mit einem Geleitwort von Univ.-Prof. Dr. Andreas Oehler

(4)

Erstgutachter: Prof. Dr. Andreas Oehler

Zweitgutachter: Prof. Thomas Walker PhD

Disputation: 25.05.2011

(5)

Geleitwort

Innerhalb des Forschungszweiges der finanzwirtschaftlich ausgerichteten, internationalen Rechnungslegung (Financial Accounting), insbesondere der Bilanzierung und Bewertung, und im Rahmen der regulatorischen und praxisbezogenen Realisationen der Wirtschafts- prüfung wird bislang wenig der Fokus auf die Einflussgrößen der Bewertung immaterieller Vermögenswerte gerichtet und die Verbindung zur aktuellen Finanzkrise und zur finanz- wirtschaftlichen Performance von Unternehmen geknüpft. Man gewinnt bisweilen den Eindruck, dass die marktwirtschaftlich grundsätzlich gerechtfertigte Orientierung an den Eigentümern und Eigenkapitalgebern (Shareholder) den Blick für die gleichzeitige Rele- vanz für die – auch regulatorische – Infektionsgefahr durch krisenhafte Phänomene in den Finanz- und Wirtschaftssystemen westlicher Industriestaaten verstellt. Offenkundig wird dies im regulatorischen Wandel der Bilanzierung und Bewertung immaterieller Vermö- gensgegenstände in einem globalisierten Umfeld und im Abbild der aktuellen Finanz- und Wirtschaftskrise in den Jahresabschlüssen von Unternehmen.

Die vorliegende Arbeit geht den nicht einfachen Weg, diesen Mangel zu beheben, in- dem nicht nur theoretisch die Bilanzierung und Bewertung immaterieller Vermögensge- genstände analysiert werden, sondern indem auch eine intensive empirische Untersuchung anhand eines Survey von Wirtschaftsprüfern einerseits und eine umfassende Krisenanalyse von Jahresabschlüssen andererseits realisiert wird und zwar insbesondere im Hinblick auf die sich ändernde Bilanzierung und Bewertung immaterieller Vermögensgegenstände und die Konsequenzen aus der aktuellen Finanzkrise. Die Ergebnisse sprechen nicht nur für die deutlich gestiegene Relevanz der immateriellen Vermögensgegenstände, sondern insbe- sondere auch für die „Flexibilität“ in der Bewertung. Hinzu kommen klare Hinweise der Wirkung auf die finanzwirtschaftliche orientierte Performance der untersuchten Unter- nehmen mit aller Relevanz für die strategische und finanzwirtschaftliche Unternehmens- führung und das Krisenabbild in deutschen Jahresabschlüssen.

Die Dissertation widmet sich in einem sehr umfassenden Ansatz auf der Basis der fi-

nanzwirtschaftlichen und rechnungslegungsorientierten Ansätze der Betriebswirtschafts-

(6)

lehre sowie kapitalmarkttheoretischer und performanceorientierter Ansätze der finanz- wirtschaftlichen Unternehmensführung sowie der theoretischen und der empirischen Analyse der Bedeutung und der Bilanzierung sowie Bewertung immaterieller Vermö- gensgegenstände einerseits und dem Niederschlag von Krisenphänomenen in deutschen Jahresabschlüssen andererseits. Holzschnittartig formuliert geht es dem Promovenden also um die Identifikation und Analyse des Ausmaßes und der Einflussfaktoren der Bi- lanzierung und Bewertung immaterieller Vermögensgegenstände auf die finanzwirt- schaftliche Performance und Strategie von Unternehmen, ergänzt um die aktuelle Kri- sensymptomatik.

Die Arbeit von Herrn Frey unterscheidet sich dabei in den forschungsleitenden Fra- gestellungen in einigen für die wissenschaftliche, aber genauso auch für die praktische Arbeit wesentlichen Aspekten von verwandten Arbeiten:

 Inwieweit spiegelt sich die oftmals in Theorie und Praxis festgestellte gestiegene Bedeutung immaterieller Vermögenswerte für Unternehmen in den Bilanzen und der Darstellung im Anhang der Konzernabschlüsse wider?

 Welche Risiken ergeben sich durch die Bilanzierung(-spraxis) immaterieller Vermögenswerte (insbesondere von Geschäfts- und Firmenwerten)?

 Welche Verfahren und Methoden kommen zur Bewertung immaterieller Vermö- genswerte (patentierter Technologien) zur Anwendung?

 Welchen Einfluss üben immaterielle Vermögenswerte auf die Performance von Unternehmen aus?

 Inwieweit spiegelt sich die aktuelle Finanzkrise in den Konzernabschlüssen der betroffenen Unternehmen wider?

 Welche Auswirkungen auf die Konzerne am deutschen Kapitalmarkt, repräsen- tiert durch die im HDAX gelisteten Unternehmen, hat die aktuelle Finanzkrise und auf welchen Ebenen (Erfolg, Liquidität, Rentabilität, Kapitalstruktur) findet sich ein solcher Einfluss in zentralen Unternehmenskennzahlen ?

Bereits die einheitliche und systematische sowie kritische Diskussion der verschiede-

nen Theorie- und Literaturströmungen ist einer wissenschaftlichen Arbeit im Range einer

Dissertation würdig. Der eigenständig weiterentwickelte, die Ansätze der Literatur zur

empirischen finanzwirtschaftlichen Forschung zusammenführende und zum Teil integrie-

rende Ansatz unter dem Fokus der Bedeutung, Bilanzierung und Bewertung immaterieller

(7)

Vermögensgegenstände sowie der Finanzkrisensymptomatik in aktuellen Jahresabschlüs- sen und vor allem die umfassende Primärdatensammlung und -analyse ist darüber hinaus geeignet, die wissenschaftliche Forschung einen wesentlichen Schritt voranzutreiben.

Die vorliegende Arbeit ist damit grundsätzlich im Forschungsgebiet der theoretischen und empirischen finanzwirtschaftlichen Forschung angesiedelt. Sie legt ihren Schwerpunkt auf die eher ganzheitliche Perspektive der Zusammenführung verschiedener Erklärungsan- sätze sowie die diesbezüglich noch eher stiefmütterlich untersuchte Relevanz der immate- riellen Vermögensgegenstände und der Finanzkrisensymptome.

Der Dissertation gelingt es nach ausführlicher und sorgfältig eingebrachter Grundle- gung einen herausragenden Beitrag zum Bereich der Identifikation und Analyse des Aus- maßes und der Einflussfaktoren der Bilanzierung und Bewertung immaterieller Vermö- gensgegenstände auf die Performance und Strategie von Unternehmen, ergänzt um die aktuelle Krisensymptomatik. Damit ist ein wesentlicher Beitrag zur betriebswirtschaftlich, insbesondere finanzwirtschaftlich ausgerichteten theoretischen und empirischen For- schung zur Bilanzierung und Bewertung immaterieller Vermögensgegenstände und klare Hinweise der Wirkung auf die Performance der untersuchten Unternehmen mit aller Rele- vanz für die strategische und finanzwirtschaftliche Unternehmensführung und das Krisen- abbild in deutschen Jahresabschlüssen zu konstatieren.

Bamberg im Mai 2011 Univ.-Prof. Dr. Andreas Oehler

(8)
(9)

Vorwort

Die vorliegende Arbeit wurde im Wintersemester 2010/2012 unter dem Titel „Immateriel- le Vermögenswerte – Bewertung, Bilanzierung und Unternehmensperformance“ an der Fakultät Sozial- und Wirtschaftswissenschaften der Otto-Friedrich-Universität Bamberg als Dissertation angenommen. Ohne die Unterstützung zahlreicher Personen wäre die Ent- stehung dieser Dissertation nicht möglich gewesen. Es ist mir deshalb ein Anliegen, ihnen hiermit herzlich zu danken.

Meinem Doktorvater, Herrn Univ.-Prof. Dr. Andreas Oehler, verdanke ich nicht nur eine exzellente Betreuung meiner Arbeit sondern auch eine umfassende Unterstützung weiterer Forschungsvorhaben und Konferenzteilnahmen sowie eine sehr angenehme Ar- beitsatmosphäre am Lehrstuhl. Herrn Prof. Thomas Walker, PhD danke ich für die Über- nahme des Zweitgutachtens und seine unkomplizierte und freundliche Art der Begleitung meiner Dissertation. Ferner danke ich Herrn Univ.-Prof. Dr. Thomas Egner, der sich als dritter Prüfer meiner Disputation zur Verfügung stellte.

Meinen Kollegen am Lehrstuhl, die mich jederzeit mit zahlreichen Anregungen unter- stützt, die Bürde des Korrekturlesens auf sich genommen und z.T. mit mir zusammen ein- zelne Forschungsergebnisse publiziert haben, möchte ich ebenfalls herzlich danken. Be- sonders hervorheben möchte ich hierbei Herrn Dipl.-Kfm. Tim Herberger, Herrn Dr. Da- niel Kohlert, Herrn Dipl.-Betriebsw. (FH) Henrik Schalkowski, M.A. M.Sc. und Herrn Dr.

Stefan Wendt.

Großer Dank gebührt auch meinen Eltern und meiner Schwester, die mich von Beginn an immer unterstützt haben.

Mein größter Dank gilt der Frau, die ich liebe. Ohne ihre Liebe, ihr Verständnis und ihre Unterstützung wäre die Arbeit in dieser Form nicht möglich gewesen. Ihr widme ich diese Arbeit!

Hannes Frey

(10)
(11)

Inhaltsübersicht

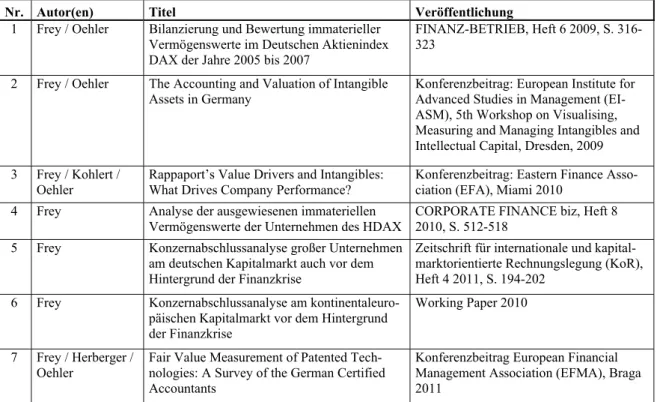
I Einführung und forschungsleitende Hauptfragen 3

II Bilanzierung und Bewertung immaterieller Vermögenswerte im Deutschen Aktienindex DAX der Jahre 2005 bis 2007

13

III The Accounting and Valuation of Intangible Assets in Germany

17

IV Rappaport’s Value Drivers and Intangibles: What Drives Company Performance?

39

V Analyse der ausgewiesenen immateriellen Vermögenswerte der Unternehmen des HDAX

65

VI Konzernabschlussanalyse großer Unternehmen am deutschen Kapitalmarkt auch vor dem Hintergrund der Finanzkrise

67

VII Konzernabschlussanalyse am kontinentaleuropäischen Kapitalmarkt vor dem Hintergrund der Finanzkrise

71

VIII Fair Value Measurement of Patented Technologies: A Survey of the German Certified Accountants

107

(12)
(13)

Kapitel I

Einführung und

forschungsleitende Hauptfragen

(14)
(15)

I Einführung und forschungsleitende Hauptfragen

1 Problemstellung

Immaterielle Vermögenswerte wie z. B. Marken und Patente wandeln sich laut Theorie und Praxis zunehmend zum entscheidenden Erfolgsfaktor und Werttreiber für Unterneh- men.

1

Dabei ist festzuhalten, dass nur nutzenstiftende, einzigartige und schwer zu imitie- rende bzw. zu substituierende Vermögenswerte, wie es in der Regel immaterielle Vermö- genswerte auch sind, nachhaltig unternehmensspezifische Wettbewerbsvorteile erbringen und sichern.

2

Durch die Einbindung immaterieller Vermögenswerte in materielle Werte oder Arbeitsprozesse können diese Cash Flows und somit Wert für das Unternehmen ge- nerieren.

3

Diese sog. immateriellen Vermögenswerte werden definiert als identifizierbare, nicht monetäre Vermögenswerte ohne physische Substanz.

4

Gängige Beispiele für Rechte und Werte, die unter diese Definition fallen, sind Computersoftware, Patente, Urheber- rechte, Filmmaterial, Kundenlisten, Hypothekenbedienungsrechte, Fischereilizenzen, Im- portquoten, Franchiseverträge, Kunden- oder Lieferantenbeziehungen, Kundenloyalität, Marktanteile und Absatzrechte.

5

Allgemein können Immaterielle Werte gemäß ihrer Ent- stehung bzw. Herkunft in folgende sieben Kategorien eingeteilt werden: Innovation, Hu- man, Customer, Supplier, Investor, Process und Location Capital.

6

Zwei zentrale Entwicklungen – verstärkter Wettbewerb aufgrund der Globalisie- rung des Warenverkehrs bzw. der Deregulierung in Schlüsselindustrien wie Telekommu- nikation auf der einen und das Aufkommen moderner Informationstechnologien auf der anderen Seite – haben Unternehmensstrukturen seit Mitte der 80er Jahre dramatisch ge- wandelt und werden für den steigenden Einfluss von immateriellen Vermögenswerten auf den Erfolg von Unternehmen in Industrienationen verantwortlich gemacht.

7

Aus diesen

1

Vgl. z.B. AK Immaterielle Werte im Rechnungswesen, DB 2001 S. 989; Lev, Intangibles, 2001, S. 9; Kü- ting/Dürr, StuB 2003 S. 1.

2

Vgl. z.B. Barney, Journal of Management 1991 S. 99-120; Peteraf, Strategic Management Journal 1993 S.

179-192; Galbreath, Technovation 2005 S. 979-987.

3

Vgl. Kaplan/Norton, Harvard Business Review 2004 S. 52; Lev, Intangibles, 2001, S. 7.

4

Vgl. AK Immaterielle Werte im Rechnungswesen, DB 2001 S. 990 f.; FAS 142, Appendix; IAS 38.9.

5

Vgl. IAS 38.9.

6

Vgl. AK Immaterielle Werte im Rechnungswesen, DB 2001 S. 990 f.

7

Vgl. z.B. Lev, Intangibles, 2001, S. 9; Zingales, Journal of Finance 2000 S. 1624.

(16)

Gründen rückt auch die Notwendigkeit der Analyse der Bilanzierung und Bewertung die- ser Vermögenswerte stärker in den Vordergrund.

8

Ziele dieser (kumulativen) Dissertation sind nicht nur die Erbringung des Nach- weises der Befähigung zur selbständigen Bearbeitung wirtschaftswissenschaftlicher Prob- lemstellungen, von umfassenden Fachkenntnissen und von wissenschaftlichem Urteils- vermögen, sondern auch in der Lieferung eines wissenschaftlichen Fortschritts zu folgen- den miteinander thematisch eng verbundenen forschungsleitenden Hauptfragen:

(1) Inwieweit spiegelt sich die oftmals in Theorie und Praxis festgestellte gestiege- ne Bedeutung immaterieller Vermögenswerte für Unternehmen in den Bilanzen und der Darstellung im Anhang der Konzernabschlüsse wider? Welche Risiken ergeben sich durch die Bilanzierung (-spraxis) immaterieller Vermögenswerte (insbesondere von Geschäfts- und Firmenwerten)?

(2) Welche Verfahren und Methoden kommen zur Bewertung von immateriellen Vermögenswerten (insb. von patentierten Technologien) im Rahmen der Bilan- zierung nach internationalen Rechnungslegungsstandards zur Anwendung?

(3) Welchen Einfluss üben bilanzierte immaterielle Vermögenswerte auf die Per- formance von Unternehmen aus?

8

Vgl. exemplarisch Coenenberg, Jahresabschluss und Jahresabschlussanalyse, 20. Aufl. 2005, S. 143; Co- hen, Intangible Assets – Valuation and Economic Benefit, 2005, S. 33; Esser/Hackenberger, KoR 2004 S.

402-414; Küting, FB 2000 S. 674; Pellens/Fülbier/Gassen/Sellhorn, Internationale Rechnungslegung, 7.

Aufl. 2008, S. 280; Frey/Oehler, FB 2009 S. 316.

(17)

2 Kurzgang der Untersuchung und Bestandteile des Dissertationsportfolios

Die in Kapitel 1 genannten forschungsleitenden Hauptfragen stehen im Rahmen dieses Dissertationsvorhabens im Mittelpunkt der einzelnen wissenschaftlichen Beiträge. Der jeweilige Kurzgang der Untersuchung der einzelnen Fragestellung soll im Folgenden kurz erläutert und auf die zentralen Ergebnisse und Beiträge zum wissenschaftlichen Fortschritt verwiesen werden. Abschließend erfolgt eine Auflistung der Bestandteile der kumulativen Dissertation.

2.1 Forschungsleitende Hauptfrage (1)

9

Eine der Hauptaufgaben des Jahresabschlusses ist die Vermittlung eines den tatsächlichen Verhältnissen entsprechenden Bildes der Vermögens-, Finanz- und Ertragslage von Unter- nehmen.

10

Weitere Hauptzielsetzungen der Rechnungslegung nach IFRS bestehen in der Vermittlung entscheidungsnützlicher Informationen insbesondere für die Kapitalgeber eines Unternehmens und einer Fokussierung auf den Konzernabschluss.

11

Allgemein kön- nen mittels Kennzahlen die Datenmengen von Konzernabschlüssen zu wenigen, aber aus- sagekräftigen Größen aggregiert werden, um komplizierte betriebliche Strukturen und Prozesse abbilden zu können.

12

Wird die Kennzahlenrechnung als Vergleichsrechnung ausgestaltet, können mit deren Hilfe Sondereffekte identifiziert und auf ihre Ursachen hin untersucht werden.

13

Mittels Zeitvergleich werden Veränderungen und Entwicklungsten- denzen sichtbar gemacht, nicht jedoch deren Ursachen.

14

Der Vorteil dabei ist aber, dass der Einsatz bilanzpolitischer Instrumente, der in einer bestimmten Periode aufgrund unter- nehmerischer Ziele durchgeführt wurde, in den meisten Fällen schon in der folgenden Pe- riode entgegengesetzte Wirkungen mit sich bringen kann und die zuvor vorgenommene Bilanzgestaltung zum Teil wieder aufgehoben wird.

15

Die Kennzahlenrechnung wird in der Analysepraxis noch immer als das dominierende Analyseinstrument bei der Beurteilung

9

Vgl. Frey/Oehler, FB 2009; Frey/Oehler, Tagungsbeitrag EIASM 2009; Frey, CFB 2010; Frey, KoR 2011;

Frey, Working Paper 2010.

10

Vgl. § 297 (2) HGB; IFRS, Rahmenkonzept 2008 RK.12 und RK.15 ff.

11

Vgl. IFRS, Rahmenkonzept 2008 RK.8; Baetge/Kirsch/Stefan, Konzernbilanzen, 2004, S. 85.

12

Vgl. Reichmann, Controlling mit Kennzahlen und Managementberichten. Grundlagen einer systemge- stützten Controlling-Konzeption, 6. Aufl. 2001, S. 19 f.; Hail, Der Schweizer Treuhänder 2002 S. 53.

13

Vgl. Ballwieser, WPg 1987 S. 57; Gräfer, Bilanzanalyse, 10. Aufl. 2008, S. 20.

14

Vgl. Küting, DB 2010 S. 2292; Leffson, Bilanzanalyse, 3. Aufl. 1984, S. 103, S. 111.

15

Vgl. Jacobs/Greif/Weber, WiSt 1972 S. 427.

(18)

von Unternehmen gesehen.

16

Trotz Kritik kann auf die klassische Bilanzanalyse zur Beur- teilung der Unternehmenslage und Insolvenzwahrscheinlichkeit nicht verzichtet werden, da sie häufig die einzige Beurteilungsbasis für externe Analysten darstellt.
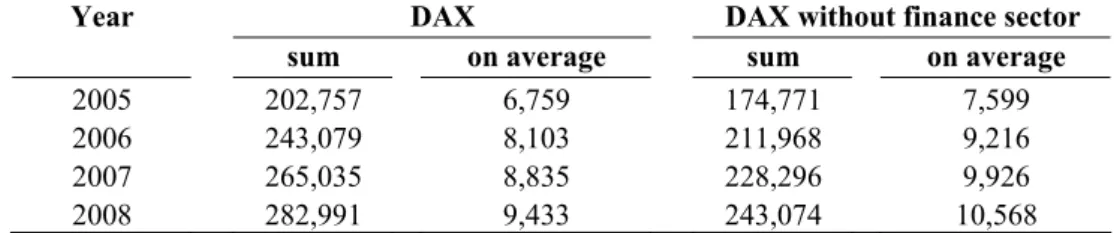
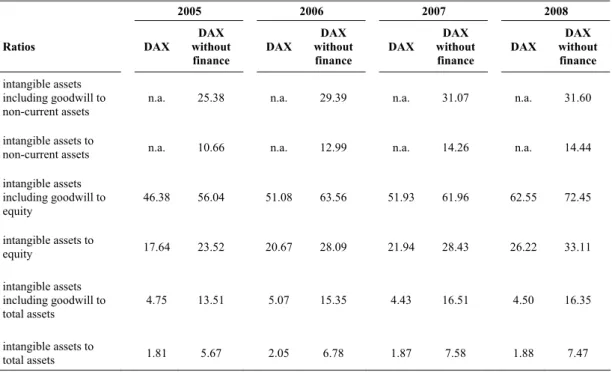
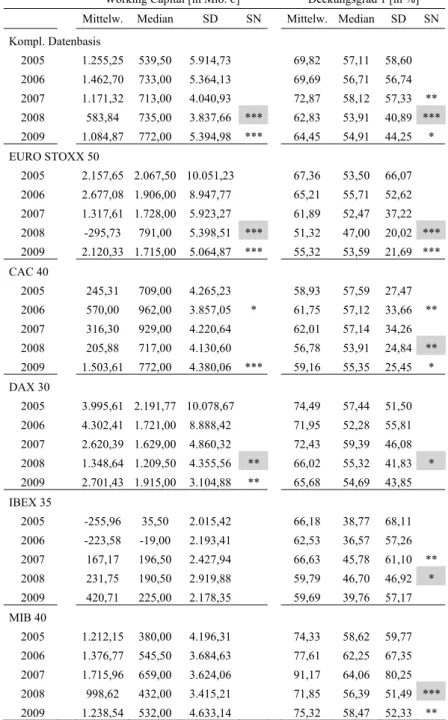
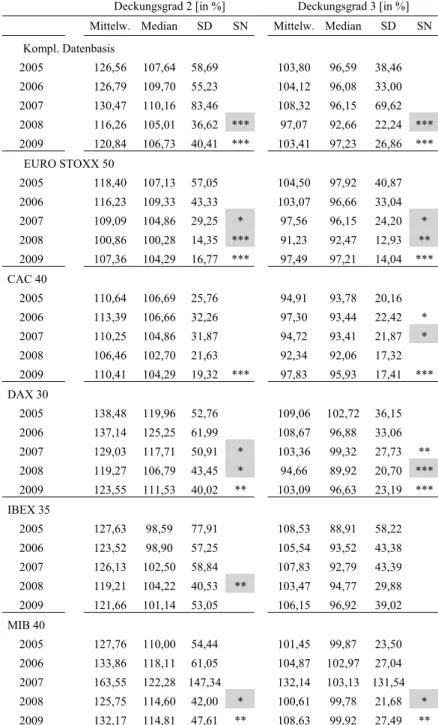
17

Sowohl absolut als auch relativ betrachtet kann eine gestiegene Bedeutung ausge- wiesener immaterieller Vermögenswerte festgestellt werden. Im Rahmen der Analyse der im Konzernanhang getroffenen Angaben zu immateriellen Vermögenswerten kann zudem ein Anstieg der Informationsweitergabe festgestellt werden. Es existieren jedoch immer noch sehr große Unterschiede zwischen den Unternehmen hinsichtlich der Qualität und des Gehalts der vorzufindenden Informationen. Darüber hinaus kann ein Anstieg des An- teils ausgewiesener Geschäfts- und Firmenwerte am Eigenkapital festgestellt werden. Bis zum Jahr 2004 war die jährliche gewinnwirksame Abschreibung des Geschäfts- und Fir- menwerts verpflichtend. Im Durchschnitt unterstellten z.B. die Unternehmen des DAX vor 2004 eine Nutzungsdauer von etwa 8,6 Jahren und schrieben somit jährlich ca. 11,7% ab.

18

Seit 2005 schreibt IFRS 3.55 vor, dass ein ausgewiesener Geschäfts- und Firmenwert nicht mehr abgeschrieben werden darf. Stattdessen hat der Bilanzierende gemäß IAS 36 einmal jährlich auf Wertminderung zu prüfen. Seitdem betreiben die DAX-Unternehmen eine sehr restriktive Abschreibungs- bzw. Bilanzpolitik und tätigen (auch in der Finanzkrise) nur noch Abschreibungen in Höhe von ca. 1,5% und unterstellen somit, ca. 65 Jahre lang Cash Flows aus Geschäfts- und Firmenwerten generieren zu können.

19

In den nächsten Jahren müssen die zu gering getätigten Abschreibungen wohl nachgeholt werden und be- lasten zum Teil sehr stark das Eigenkapital.

20

16

Vgl. Coenenberg/Haller/Schultze, Jahresabschluss und Jahresabschlussanalyse, 21. Aufl. 2009, S. 1018 f.;

Gräfer, Bilanzanalyse, 10. Aufl. 2008, S. 18; Küting, DB 2010 S. 2296.

17

Vgl. Krehl, Der Informationsbedarf der Bilanzanalyse, 1985, S. 6; Küting, DB 2010 S. 2297. Jedoch sind die wesentlichen Grenzen der Kennzahlenanalyse zu beachten. So sind die Kennzahlen allgemein durch einen ausgeprägten Vergangenheitsbezug geprägt, die Kennzahlen sind stichtagsbezogen, es existiert eine zweckgebundene Bilanzierungspolitik und komplexe Sachverhalte werden stark komprimiert wiedergege- ben. Vgl. exemplarisch Baetge/Huss/Niehaus, in: IDW (Hrsg.), Beiträge zur Reform des Insolvenzrechts, Düsseldorf 1987, S. 64 f.; Coenenberg, Jahresabschluss und Jahresabschlussanalyse, 20. Aufl. 2005, S. 954 f.; Küting/Weber, Die Bilanzanalyse, 9. Aufl. 2009, S. 75 ff.

18

Vgl. Leibfried, Wirtschaftswoche 2010 S. 82; Lachnit, in: Freidank (Hrsg.), Rechnungslegung, Steuerung und Überwachung von Unternehmen, 2010, S. 136.

19

Vgl. Leibfried, Wirtschaftswoche 2010 S. 86.

20

Vgl. zum bilanzpolitischen Gestaltungspotential Ebert/Simons, KoR 2009 S. 622; Lachnit, in: FS Hanse

Universität Rostock 2008; Wulf, KoR 2009 S. 729; Zwirner/Künkele, IRZ 2010 S. 253. Zur Nutzungsdauer

vgl. u.a. Moser/Hüttche, FB 2009 S. 395. Vgl. auch allgemein Küting, DB 2005 S. 2757; Küting, PiR 2008

S. 315.

(19)

2.3 Forschungsleitende Hauptfrage (2)

21

Im Rahmen von Unternehmenszusammenschlüssen ist gemäß IFRS 3 der Fair Value

22

von immateriellen Vermögenswerten sowie von patentierten Technologien zu ermitteln.

Grundsätzlich können für die Bewertung von immateriellen Vermögenswerten nach IDW RS HFA 16 drei Bewertungsverfahren angewendet werden. In diesem Kontext wird zwi- schen marktpreisorientierten, kapitalwertorientierten und kostenorientierten Verfahren differenziert.

23

Zur Überprüfung der Werthaltigkeit und zur Ermittlung der Höhe der po- tentiellen Wertberichtigung sind nach IAS 36 ebenfalls Bewertungen von immateriellen Vermögens- und Firmenwerten durchzuführen. Während sich zahlreiche Studien der Fair- Value-Ermittlung von immateriellen Vermögenswerten im Allgemeinen auf Grundlage einer theoretischen Herangehensweise widmen, sind patentierte Technologien im Speziel- len, besonders im Hinblick auf die Bewertungsstandards IFRS, erstaunlich wenig in der Literatur diskutiert worden.

24

Im Gegensatz zu bereits existierende Studien

25

stellen die im Rahmen dieser Dissertation durchgeführten Untersuchungen patentierte Technologien und deren Fair-Value-Ermittlung in den Mittelpunkt. Hierfür werden die von DAX- Unternehmen im Konzernanhang getroffenen Angaben zur Bewertung immaterieller Ver- mögenswerte analysiert und die Wirtschaftsprüfer als Expertengruppe und Quasiinterme- diäre zwischen Unternehmen und Investoren mittels einer schriftlichen Befragung um Stellung gebeten.

Über den betrachteten Zeitraum ist für die im DAX gelisteten Unternehmen ein steigender Informationsinhalt der Anhangsangaben betreffend immaterieller Vermögens- werte festzustellen.

26

Immer mehr Unternehmen treffen Angaben zu unterstellten Wachs-

21

Vgl. Frey/Oehler, FB 2009; Frey/Oehler, Tagungsbeitrag EIASM 2009; Frey, CFB 2010; Frey/Herberger/

Oehler, Tagungsbeitrag EFMA 2011.

22

Vgl. IAS 38.8: Der beizulegende Zeitwert (Fair Value) ist der Betrag, zu dem zwischen sachverständigen, vertragswilligen und voneinander unabhängigen Geschäftspartnern ein Vermögenswert getauscht werden könnte.

23

Vgl. IDW RS HFA 16.

24

So existiert bisher lediglich ein Entwurf einer Fortsetzung zu den Besonderheiten bei der Bewertung von Technologien. Vgl. IDW S5, Fachnachrichten 2010 S. 575-578.

25

Vgl. d’Arcy/Mori/Roßbach, KoR 2004 S. 67-77; Fülbier/Honold/Klar, Recht der Internationalen Wirt- schaft 2000 S. 833-844; Hager/Hitz, KoR 2007 S. 205-218; KPMG, Patente, Marken, Verträge, Kundenbe- ziehungen – Werttreiber des 21. Jahrhunderts, 2008; KPMG, Immaterielle Vermögenswerte und Goodwill in Unternehmenszusammenschlüssen, 2009; Küting/Dürr, StuB 2003 S. 1-5; Küting/Zwirner, KoR 2001 S. 4- 38; Leibfried/Pfanzelt, KoR 2004 S. 491-497; PwC, One Valuation Fits All?, München 2008; Ran- ker/Wohlgemuth/ Zwirner, KoR 2001 S.269-279; Völckner/Pirchegger, DBW 2006 S. 219-243.

26

Vgl. z. B. auch zur Verbesserung der Ergebnisqualität deutscher Jahresabschlüsse Pronobis/Schwetzler/

Sperling/Zülch, CFB 2010 S. 98 f.

(20)

tumsraten oder verwendeten Diskontierungszinssätzen (DKS). Es existieren jedoch immer noch sehr große Unterschiede hinsichtlich des Informationsgehaltes der Angaben. So wer- den z. B. sehr große Bandbreiten angegeben und zum Teil Nach- bzw. Vorsteuerzinssätze erwähnt, ohne anzugeben, welche zur Diskontierung verwendet wurden. Absolute Werte von prognostizierten Cash Flows werden nicht angegeben. Im Rahmen der Prognose der künftigen Cash Flows aus der Verwertung immaterieller Vermögenswerte greifen aber alle Unternehmen auf ein 2-Phasen Konzept zurück (vgl. IDW S1). In der Rentenphase ver- wendete Wachstumsraten der prognostizierten Cach Flows liegen bei etwa 1,5%. Die ver- wendeten Diskontierungszinssätze können als Indikator für die Risikoeinschätzung bzw.

Volatilität der prognostizierten Cash Flows durch das Managements angesehen werden.

Die untersuchten Unternehmen verwenden sowohl Nach- wie Vor-Steuer- Diskontierungszinssätze. Über den betrachteten Zeitraum liegen Median und Mittelwert verwendeter Nach-Steuer-Diskontierungszinssätze bei etwa 7,9% und Vor-Steuer- Dis- kontierungszinssätze bei etwa 10,5%. Sowohl Nach- und Vor-Steuer- Diskontierungszins- sätze bleiben (trotz Finanzkrise) relativ konstant bzw. steigen nur minimal im Zeitablauf.

Nach Auswertung der Einschätzungen der Befragten zum aktuellen und zukünfti-

gen Einfluss immaterieller Vermögenswerte auf den Unternehmenserfolg können immate-

rielle Vermögenswerte als entscheidende Erfolgsfaktoren für Unternehmen betrachtet

werden. Nach Meinung der befragten Wirtschaftsprüfer wird die Bewertung von patentier-

ten Technologien in der Regel gemäß der Analogiemethode durchgeführt, sobald das

marktpreisorientierte Verfahren zur Anwendung kommt. Im Rahmen der kapitalwertorien-

tierten Verfahren kommen am häufigsten die Lizenzpreisanalogie und die Methode der

unmittelbaren Cashflow-Prognose zur Anwendung. Bei den kostenorientierten Verfahren

wird häufiger die Wiederbeschaffungskostenmethode angewendet. Ein weiteres zentrales

Ergebnis der Studie ist, dass nach Meinung der befragten Wirtschaftsprüfer Bilanzpolitik

durch die Wahl der Bewertungsmethode betrieben werden kann, also aktiv Einfluss auf die

Höhe der ausgewiesenen immateriellen Vermögenswerte ausgeübt wird.

(21)

2.2 Forschungsleitende Hauptfrage (3)
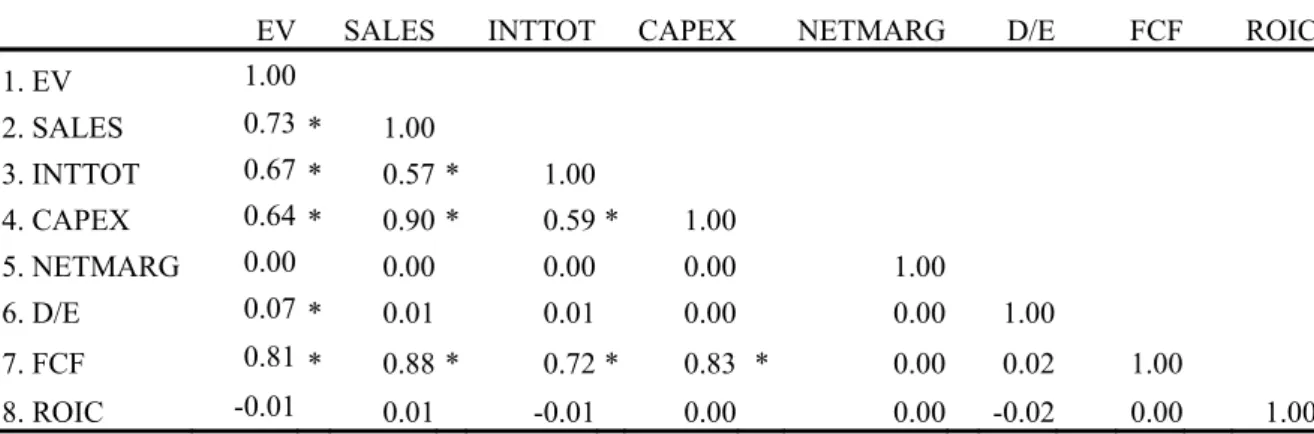
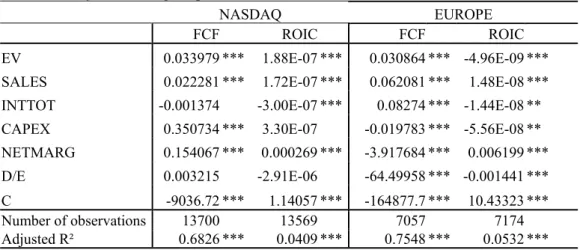
27

Rappaport identifiziert die wesentlichen Bewertungsparameter auf deduktive Art und Weise und stellt fest, dass die entscheidenden Werttreiber die Umsatzwachstumsrate, die betriebliche Gewinnmarge, der Gewinnsteuersatz, die Investitionen ins Umlaufvermögen, die Investitionen ins Anlagevermögen, die Kapitalkosten und die Länge der Prognoseperi- ode sind.

28

Die Bestimmung der Determinanten der Unternehmensperformance ist eines der zentralen Themen von Studien im Bereich des strategischen Managements.

29

Innerhalb der letzten zwei Jahrzehnte hat sich die Betrachtungsweise von branchenspezifischen hin zu unternehmensspezifischen Faktoren gewandelt.

30

Dabei können nur nutzenstiftende, einzigartige und schwer zu imitierende beziehungsweise zu substituierende Vermögens- werte, wie es in der Regel immaterielle Vermögenswerte sind, nachhaltig unternehmens- spezifische Wettbewerbsvorteile erbringen und sichern, da diese zu Performanceunter- schieden führen können.

31

In Anlehnung an Rappaports Feststellungen konnten bisherige Studien einen signifikanten Zusammenhang zwischen Forschungs- und Entwicklungs- (F&E) Ausgaben und der Unternehmensperformance feststellen.

32

In der Praxis führen F&E-Ausgaben häufig zum Ansatz von (selbst erstellten) immateriellen Vermögenswerten im Jahresabschluss.

33

Trotz ihres gestiegenen Einflusses werden immaterielle Vermögens- und Firmenwerte bisher kaum in die Analyse der Determinanten der Unternehmensper- formance in empirischen Studien aufgenommen. Es liegen keine aktuellen empirischen Studien und Beiträge zum Zusammenhang zwischen bilanzierten immateriellen Vermö- gens- inklusive Firmenwerten und der Unternehmensperformance vor. Um diese For- schungslücke zu füllen, werden der Einfluss von bilanzierten immateriellen Vermögens- und Firmenwerte auf verschiedene Performance-Kennzahlen untersucht.

27

Vgl. Frey, CFB 2010 S. 512-518; Frey/Kohlert/Oehler, Tagungsbeitrag EFA 2010.

28

Vgl. Rappaport, Creating Shareholder Value, New York, 1986.

29

Vgl. Galbreath/Galvin, Journal of Business Research 2008 S. 109-117.

30

Vgl. Hoopes et al., Strategic Manager Journal 2003 S. 889-902.

31

Vgl. Ahmit/Schoemaker, Strategic Management Journal 1993, S. 33-47; Barney, Journal of Management 1991 S. 99-120; Galbreath, Technovation 2005 S. 979-987; Peteraf, Strategic Management Journal 1993 S.

179-192.

32

Vgl. exemplarisch Aboody/Lev, The Journal of Finance 2000 S. 2747-2766; Ahmed/Falk, Journal of Ac- counting and Public Policy 2006 S. 231-264; Amir/Lev/Souigiannis, The European Accounting Review 2003 S. 635-659; Chambers/Jennings/Thompson, Journal of Accounting, Auditing and Finance 2003 S. 79-113;

Chan/Lakonishok/Sougiannis, The Journal of Finance, 2001 S. 2431-2456; Eberhart/Maxwell/Siddiquer, The Journal of Finance 2001 S. 623-650; Hall, American Economic Review 1993 S. 259-264;

Lev/Sougiannis, Journal of Accounting and Economics 1996 S. 107-138.

33

Vgl. z.B. Chauvin/Hirschey, Journal of Accounting and Public Policy 1994 S. 159-180; Gelb, Journal of

Business Finance and Accounting 2002 S. 457-476.

(22)

Unter Anwendung von Korrelations- und Panel-Regressionsanalysen auf Daten des HDAX, des NASDAQ und eines großen Datensatzes europäischer Unternehmen zeigen sich, dass absolute und relative Performancekennzahlen signifikant beeinflusst werden von Werttreibern wie Umsatz, Investitionen und Nettomarge, aber auch von immateriellen Vermögens- und Firmenwerten. Ausgehend von den vorliegenden Ergebnissen, lassen sich somit immaterielle Vermögens- und Firmenwerte selbst als Werttreiber bezeichnen.

2.4 Bestandteile der kumulativen Dissertation

Die eingangs erwähnten forschungsleitenden Hauptfragen stehen in einem engen themati- schen Zusammenhang und werden im Rahmen dieser kumulativen Dissertation in sieben eigenständigen Veröffentlichungen eingehend behandelt. In Tabelle 1 ist eine Übersicht über die einzelnen Bestandteile der Dissertation zu finden. Alle Veröffentlichungen ent- standen im Rahmen der Beschäftigung als wissenschaftlicher Mitarbeiter ab dem 01.07.2007 und stehen somit in einem engen zeitlichen Zusammenhang.

Das Dissertationsportfolio setzt sich aus sieben Veröffentlichungen zusammen

(vier Zeitschriftenbeiträge und drei Konferenzbeiträge auf internationalen Tagungen), wo-

bei alle bereits veröffentlichten und eingereichten Beiträge einem anonymisierten Begut-

achtungsverfahren unterlagen. Sechs Beiträge sind bereits veröffentlicht bzw. angenom-

men und ein Beitrag liegen als sog. Working Paper vor. Insgesamt sind drei Beiträge in

Allein-Autorenschaft, zwei Beiträge mit einem Mit-Autor und zwei Beiträge mit zwei

Mit-Autoren entstanden.

(23)

Nr. Autor(en) Titel Veröffentlichung 1 Frey / Oehler Bilanzierung und Bewertung immaterieller

Vermögenswerte im Deutschen Aktienindex DAX der Jahre 2005 bis 2007

FINANZ-BETRIEB, Heft 6 2009, S. 316- 323

2 Frey / Oehler The Accounting and Valuation of Intangible

Assets in Germany Konferenzbeitrag: European Institute for Advanced Studies in Management (EI- ASM), 5th Workshop on Visualising, Measuring and Managing Intangibles and Intellectual Capital, Dresden, 2009 3 Frey / Kohlert /

Oehler Rappaport’s Value Drivers and Intangibles:

What Drives Company Performance? Konferenzbeitrag: Eastern Finance Asso- ciation (EFA), Miami 2010

4 Frey Analyse der ausgewiesenen immateriellen

Vermögenswerte der Unternehmen des HDAX CORPORATE FINANCE biz, Heft 8 2010, S. 512-518

5 Frey Konzernabschlussanalyse großer Unternehmen am deutschen Kapitalmarkt auch vor dem Hintergrund der Finanzkrise

Zeitschrift für internationale und kapital- marktorientierte Rechnungslegung (KoR), Heft 4 2011, S. 194-202

6 Frey Konzernabschlussanalyse am kontinentaleuro- päischen Kapitalmarkt vor dem Hintergrund der Finanzkrise

Working Paper 2010

7 Frey / Herberger /

Oehler Fair Value Measurement of Patented Tech- nologies: A Survey of the German Certified Accountants

Konferenzbeitrag European Financial Management Association (EFMA), Braga 2011

Tabelle 1: Dissertationsportfolio

(24)
(25)

Kapitel II

Frey, Hannes / Oehler, Andreas

Bilanzierung und Bewertung immaterieller

Vermögenswerte im Deutschen Aktienindex DAX der Jahre 2005 bis 2007

In: FINANZ-BETRIEB, Heft 6 2009, S. 316-323

(26)
(27)

Kapitel III

Frey, Hannes / Oehler, Andreas

The Accounting and Valuation of Intangible Assets in Germany

Konferenzbeitrag:

European Institute for Advanced Studies in

Management (EIASM), 5th Workshop on Visualising, Measuring and Managing Intangibles

and Intellectual Capital,

Dresden, 2009

(28)
(29)

III The Accounting and Valuation of Intangible Assets in Germany

Abstract: Purpose – Intangible assets are regarded as the future value drivers of company performance. However, hardly anything is known about the actual importance and influ- ence of intangible assets. To fill this gap we analyse the German stock market index DAX and accomplish a survey among the German Certified Public Accountants (CPAs) con- cerning intangible assets.

Design/methodology/approach – In a first step, we analyse the balance sheet data and the corresponding notes of the companies with regard to reported values of intangible assets and applied valuation methods. The sample period covers the years from 2005 to 2008. In a second step, we analyse the statements of the German CPAs with regard to intangible assets. We sent a standardized questionnaire to all 180 offices of the top ten German audit- ing firms.

Findings – Our results indicate that intangible assets have gained in importance, while information on valuation methods is still scarce. According to the German CPAs, the cur- rent influence of intangible assets on company performance is on a high level and even will increase during the next few years. The mostly used valuation approach for the fair value measurement of patented technologies is the income approach. Furthermore, the accounting standards leave room for accounting policy – a result which casts doubt on the reliability of financial statements.

Originality/value – For the first time not only annual balance sheet data but also corre- sponding notes regarding intangible assets are analysed. The findings are connected with a survey of an expert group for the valuation of intangibles.

Keywords: Intangible Assets, Goodwill, Fair Value Measurement, Patent Valuation, Ac- counting Policy, International Accounting

Article Type: Research paper

We thank Tim Herberger and Stefan Wendt for helpful comments. We are grateful to all involved CPAs for returning

our survey.

(30)

1 Introduction

The importance and the influence of intangible assets, defined as identifiable non- monetary assets without physical substance (SFAS 142, Appendix; IAS 38.9) or as non- physical claims to future benefits (Lev, 2001), have significantly increased since the mid- 1980s. This development has been driven by two fundamental developments – the intensi- fied business competition due to the globalisation of trade and the deregulation in key economic sectors, such as financial services or telecommunication, and the advent of in- formation technologies (Zingales, 2000; Lev, 2001). The increased economic importance requires an intensified analysts’ and investors’ awareness of (reported) intangible assets (Barth et al., 2001). Since the financial statements of a company are a core source of in- formation for both analysts and investors, the accounting and the valuation of intangible assets and goodwill have become much more important (Cohen, 2005; Fraser et al. , 2009).

Furthermore intangible assets are regarded as the future value drivers of company per- formance (Lev, 2001; Lev/Zambon, 2003; Bruns et al. , 2004; Anson/Suchy, 2005; Naka- mura, 2009).

In 2002 the European Union decided (EC Regulation 1606/2002) that as from 2005, annual consolidated financial statements of all capital market-oriented companies listed in Europe have to adopt IFRS. For this reason no large data set is available and hardly anything is known about the actual role of intangible assets. To fill this gap we ana- lyse the consolidated financial statements of the companies included in the German stock market index DAX and accomplish a survey among the German Certified Public Account- ants (CPAs) concerning intangible assets in order to derive insight about the influence of intangible assets. All companies listed in the DAX apply international accounting stan- dards, this means US-GAAP or IFRS, and therefore the results of this study can also be generalised – at least to some degree – for European and US companies.

In a first step, we analyse the balance sheet data and the corresponding notes of the

companies included in the German stock market index DAX with regard to reported val-

ues of intangible assets and applied valuation methods. In a second step, we analyse the

statements of the German CPAs with regard to intangible assets. The analysis is based on

a standardized questionnaire, which was sent to all 180 offices of the top ten German au-

diting firms.

(31)

Our study is organised as follows. In the following section we review the related literature. Then we describe our dataset and methodology and discuss the results (Section 3). Section 4 concludes our paper.

2 Related Literature

International accounting standards define intangible assets as identifiable non-monetary assets without physical substance (SFAS 142, Appendix; IAS 38.9). A more general defi- nition is given by Lev (2001): intangible assets are non-physical claims to future benefits.

Common examples are computer software, patents, copyrights, customer lists, mortgage servicing rights, licences, franchises, customer relationships, and marketing rights (IAS 38.9). Not only are intangible assets regarded as the future value drivers of company per- formance but also as potentially influential on other value drivers (Barron et al. , 2002).

Several studies (see e.g. Sougiannis, 1994; Lev/Sougiannis, 1996; Chan et al. , 2001; Chambers et al., 2002; Eberhart et al. , 2004; Amir et al. , 2003; Huang et al. , 2006) find a significant relationship between research and development (R&D) expenditures and company performance as expressed by stock market valuation.

In practice, R&D expenditures often lead to the reporting of (internally generated) intangible assets in the annual report. Ahmed/Falk (2006) demonstrate (potential) inves- tors that the capitalization of expenditures can be regarded as a positive signal for inves- tors. Nakamura (2003) documents that the annual investment in intangible assets in the U.S. is about one trillion dollars. But intangibles can also be acquired separately or result from a business combination. In addition, reported goodwill includes further intangible assets that do not meet the identifiability criteria.

Galbreath/Galvin (2008) examine the influence of industry-specific and firm spe- cific factors on the variation in company performance. They show that only intangible assets can explain these variations which to some extend indicates influence of intangible assets on company performance. In addition, Arikan (2002) states that theoretically intan- gible assets are more likely to create the potential for growth opportunities and that firms which acquire intangible assets try to buy growth potential. The study of Carmeli (2001) supports the insight of a resource differential between high and low-performance firms.

High-performance firms emphasize resources such as organisational strategy, ability to

(32)

manage changes, managerial competence, and organisational culture as core intangible resources. Megna/Mueller (1991) analyse why profit rates differ so dramatically across firms and industries. One of the many explanations offered for this phenomenon is the (potential) failure of conventional accounting methods to adjust for intangible capital stocks. Following the idea of Aboody/Lev (1998), Heiens et al. (2007) analyse 1,657 companies of the manufacturing industry and find empirical evidence for a positive corre- lation between intangible assets and shareholder value.

Most studies on the accounting of intangible assets in Germany are descriptive analyses of annual or consolidated financial statements (see e.g. Fülbier/Honold, 2000;

Ranker et al. , 2001; Küting/Dürr, 2003; d’Arcy et al. , 2004; Frey/Oehler, 2009) or they only analyse special groups of intangible assets (Leibfried/Pfanzelt, 2004;

Völckner/Pirchegger 2006).

3 Empirical Analysis

3.1 Dataset and Methodology

Our analysis starts with a study of the consolidated financial statements of German com-

panies listed in the stock market index DAX. The sample covers the years from 2005 to

2008 and consists of all 30 companies listed in the DAX on December 31, 2008. We are

aware of the fact that this might entail some survivorship bias, but we do not consider po-

tential rearrangements of the DAX in order to analyse a solid sample and to exclude ef-

fects resulting from changes in the composition of the DAX. In theory and practice, intan-

gible assets are often regarded as the future value drivers of company performance. Hence

reported intangible assets and goodwill both in absolute and relative terms should have

increased over time. High values of particular balance sheet items should indicate a rising

importance not only for accounting purposes. We assume that reported intangible assets

including goodwill increase over the sample period and that this increase indicates the

rising importance of intangibles. To analyse intangible assets and goodwill we record the

following data of the consolidated balance sheets: intangible assets including goodwill,

goodwill, non-current assets, equity, and total assets. Out of these figures we calculate a

(33)

number of ratios: intangible assets to non-current assets, intangible assets to equity, and intangible assets to total assets. We assume that an increase of the ratios of indicates a rising importance of intangible assets and influence on company performance. The in- creasing importance of intangible assets should also be recognised in the corresponding notes of the consolidated financial statements. Therefore we analyse the notes regarding intangible assets concerning applied valuation methods, predictions of future cash flows, and assumed discount rates. First, we accomplish the analysis for the whole DAX and, second, for all companies besides the financial sector. Accounting standards for financial companies differ from those for non-financial companies to some extent, since there are, e.g., no non-current assets in their annual reports. In addition, due to their business con- cepts the influence of intangible assets should be less pronounced for financial companies.

Statements of the management regarding intangible assets are not considered due to their subjective information content.

In a second step, we analyse the results of a survey among the German CPAs in order to detect expert opinion about intangible assets. For this purpose, we sent a standard- ized questionnaire to the offices of the top ten auditing firms in Germany ranked by reve- nue [1]. We choose the German CPAs because of their expertise in accounting and valua- tion of intangible assets and their insight into many companies. The main focus is on the fair value measurement of patented technologies using IFRS as accounting standard. Be- sides goodwill and trademarks patented technologies are in general the most valuable in- tangible assets (Lev, 2001; Anson/Suchy, 2005). After a pretest which was made to test the comprehensibility and the unambiguousness of the questionnaire we sent the standard- ized questionnaire to all 180 auditing offices. The response rate was 21.7% which corre- sponds to a total number of 39. All of the mentioned auditing firms returned at least one questionnaire and the number of returned questionnaires per auditing firm approximately corresponds to the proportion of total revenue. Considering an increasing reluctance to respond to standardized questionnaires, the actuality and controversiality of this topic, and the non-existence of IDW-standards [2] to patented technologies the response rate is still satisfying.

The questionnaire is divided into four sections. The first section includes personal

questions about the individual range of responsibility as a CPA and their position. The

second section deals with questions about the current and expected influence of intangible

assets on company performance in different industries. Analysing the statements of the

(34)

CPAs, we expect a strong influence of intangible assets on company performance. The intention of the third section is to identify the valuation methods most commonly used to determine the fair value of patented technologies and to evaluate the suitability of these methods. The fourth section deals with the question whether the selection of the valuation method influences the degree to which accounting policy can be used to exert influence on the reported value of intangible assets. We expect that accounting policy is indeed a rele- vant matter in this context. Questions with scaled response options always consist of six response options from 1 to 6 to avoid a midway bias and to force the CPAs to make an estimation or decision. Only the extrema of the response options are named.

3.2 Results from the Financial Reports Data

For the consolidated financial statements of German firms listed in the stock market index DAX we recognize a movement in the application of accounting standards from German Commercial Code and US-GAAP to IFRS. In 2008 all companies apply IFRS for account- ing purposes.

Table 1 shows the sum of all reported intangible assets including goodwill over the sample period for the DAX and for the DAX without financial companies as well the av- erage reported intangible assets including goodwill. The reported intangible assets increase from €203 billion in 2005 to €283 billion in 2008. In 2008 a company listed in the DAX reports on average intangible assets including goodwill of €9.4 billion.

Table 1

Absolute and average reported intangible assets including goodwill

We report absolute and average reported intangible assets including goodwill. All values are given in (million Euros).

Year DAX DAX without finance sector

sum on average sum on average

2005 202,757 6,759 174,771 7,599

2006 243,079 8,103 211,968 9,216

2007 265,035 8,835 228,296 9,926

2008 282,991 9,433 243,074 10,568

(35)

We notice a stronger increase of the reported intangible asset including goodwill than of non-current assets, equity, and total assets (see Table 2). The enormous increase of total asset in 2007 results from the finance sector.

Table 2

Changes in the amount of selected balance sheet items of the DAX

We report changes in the amount reported for selected balance sheet items. Values for non-current assets for the whole DAX are not reported because they would be biased due to the fact that financial companies do not distinguish between

current and non-current assets. All values are in per cent.

DAX DAX without finance sector

2005 to

2006 2006 to 2007 2007 to 2008 2005 to 2006 2006 to 2007 2007 to 2008 intangible assets inclu-

ding goodwill 19.89 9.03 6.78 21.28 7.70 6.47

intangible assets 27.53 13.80 5.95 27.67 11.82 6.05

non-current assets n.a. n.a. n.a. 4.76 1.85 4.70

equity 8.85 7.24 -11.35 6.93 10.48 -8.95

total assets 12.34 24.63 5.28 6.78 0.10 7.56

The increase is also documented in the ratios of intangible assets (including and excluding goodwill) to non-current assets, equity, and total assets as reported in Table 3. Practically all ratios increase over the sample period which also indicates a rising influence and im- portance of intangible assets. The ratio of intangible assets to equity increases from 46.4%

in 2005 to 62.6% in 2008. Excluding the finance sector, the ratio of intangible assets to

equity increases from 56.1% in 2005 to 72.5% in 2008 and the ratio of intangible assets

including goodwill to non-current assets increases from 25.4% to 31.6%. According to

Küting/Dürr (2003) the ratio of intangible assets including goodwill to non-current assets

was 28.5% in 2001 for the DAX without finance sector and the ratio of intangible assets to

equity was 50.9%. Most remarkable, however, is the increase of the ratio of intangible

assets to non-current assets from 10.7% in 2005 to 14.4% in 2008, in particular when

compared to the value documented by Küting/Dürr (2003) of 7.1% in 2001.

(36)

Table 3 Ratios for the DAX

We report different ratios. Ratios which include non-current assets in their denominator are not reported for the whole DAX because they would be biased due to the fact that financial companies do not distinguish between current and non-

current assets. All values are in per cent.

2005 2006 2007 2008

Ratios DAX DAX

without

finance DAX DAX without

finance DAX DAX without

finance DAX DAX without finance intangible assets

including goodwill to

non-current assets n.a. 25.38 n.a. 29.39 n.a. 31.07 n.a. 31.60 intangible assets to

non-current assets n.a. 10.66 n.a. 12.99 n.a. 14.26 n.a. 14.44 intangible assets

including goodwill to

equity 46.38 56.04 51.08 63.56 51.93 61.96 62.55 72.45 intangible assets to

equity 17.64 23.52 20.67 28.09 21.94 28.43 26.22 33.11 intangible assets

including goodwill to

total assets 4.75 13.51 5.07 15.35 4.43 16.51 4.50 16.35 intangible assets to

total assets 1.81 5.67 2.05 6.78 1.87 7.58 1.88 7.47

Based on these results we conclude that intangible assets have raised both in absolute and relative terms and gained in importance which supports our expectations.

The relative importance of goodwill decreases with an increase of the ratio of in- tangible assets without goodwill to intangible assets including goodwill. The goodwill and other intangible assets with an indefinite useful life have to be tested for impairment annu- ally. Due to the financial crisis the probability of impairment and amortization of goodwill is rising and some companies could be in some serious problems if their reported goodwill has to be revalued and amortized. The weighted average ratio of goodwill to equity in- creased from 29% in 2005 to 36% in 2008. Four companies show ratios of over 100%. In case that the completely reported goodwill has to be amortized the equity would be nega- tive.

Most German firms listed in the DAX quote that they report acquired intangible

assets to the amount of their acquisition costs and internally generated intangible assets to

their manufacturing costs. For the subsequent measurement and fair value measurement of

goodwill and intangible assets they apply the income approach. Therefore most firms use

(37)

the weighted average cost of capital (WACC). But only a few companies give more de- tailed information about their valuation process. Over the sample period the Relief-from- Royalty Method is quoted seven times and used for the valuation of trademarks, licences and technologies. The Multi-Period Excess Earnings Method is mentioned five times and the companies state that they use the method in order to value technology-related and cus- tomer-related intangible assets. The usage of the market approach as well of the cost ap- proach is only quoted by one company. It is remarkable that the information given by the company is mostly inconsistent and varies over the sample period.

For the subsequent measurement and fair value measurement of goodwill and in- tangible assets, companies have to predict future cash flows and to calculate discount rates. All companies use a model that includes a planning period and a following growth phase. The quoted length of the planning period of the future cash flows mainly ranges from three to five years. After that planning period most companies use assumed growth rates of the future cash flows. Over the sample period the quoted growth rates lie between zero and 8.5%, with a median value of 1% and a mean value of about 1.5% (see Table 4).

Some companies also quote discount rates for the valuation of intangible assets and good-

will. The pre-tax discount rates range from 7.45% to 13.5% (mean and median value of

about 11%) and past-tax discount rates range from 6.2% to 11.5% (mean and median

value of about 8%) (Table 5). The pre-tax discount rates as well as the past-tax discount

rates increase over the sample period. The mean value of the pre-tax discount rates in-

creases about 1.4 and the median value about 1.2 percentage points. The mean value of the

past-tax discount rates increases about 1.6 and the median value about 1.2 percentage

points. The increase can be interpreted as an indicator for the financial crisis and more

uncertainty and risk of future cash flows generated by intangible assets. In addition, a few

companies quote assumed discount rates but do not specify them.

(38)

Table 4

Quoted assumed growth rates of future cash flows

We report the quoted assumed growth rates of the predicted future cash flows found in the notes of the consolidated financial statements of companies listed in the German stock market index DAX. The observations are given in absolute

numbers. The remaining figures are given in per cent.

Assumed growth rates of future cash flows

2005-2008 2005 2006 2007 2008

Observations 68 11 16 18 23

Minimum 0.0 0.0 0.0 0.0 0.0

Maximum 8.5 4.0 3.7 8.5 4.5

Median 1.0 1.0 1.0 1.3 1

Mean 1.529 1.568 1.459 1.831 1.323

Std. Dev. 1.447 1.499 1.141 2.029 1.078

Table 5

Quoted discount rates

We report the quoted discount rates found in the notes of the consolidated financial statements of companies listed in the German stock market index DAX. The observations are given in absolute numbers. The remaining figures are given in

per cent.

Quoted past-tax discount rates

2005-2008 2005 2006 2007 2008

Observations 33 3 8 11 11

Minimum 6.2 6.2 6.3 6.45 7.5

Maximum 11.5 7.3 8.3 11.5 10.6

Median 7.95 7.0 7.4 8.05 8.2

Mean 7.950 6.833 7.411 8.202 8.395

Std. Dev. 1.072 0.569 0.579 1.277 0.924

Quoted pre-tax discount rates

2005-2008 2005 2006 2007 2008

Observations 27 8 7 3 9

Minimum 7.45 7.915 7.45 10.5 10

Maximum 13.5 13.05 12.3 13.15 13.5

Median 11 10.275 10.2 11.625 11.5

Mean 10.912 10.346 10.064 11.725 11.713

Std. Dev. 1.485 1.536 1.530 1.130 1.070 Quoted discount rates (non-specified)

2005-2008 2005 2006 2007 2008

Observations 21 2 5 8 6

Minimum 6.8 9.65 6.8 7.85 9.1

Maximum 12.8 11.3 12.2 12.8 10.815

Median 9.65 10.475 9.1 10.15 9.575

Mean 9.923 10.475 9.686 10.074 9.736

Std. Dev. 1.379 1.167 2.131 1.488 0.590

(39)

More and more companies publish data on assumed growth rates and discount rates. How- ever, the overall information content concerning intangible assets and their valuation in- creases only sparse. The given information is only vague or includes only broad ranges or only averages of, e.g., discount rates and growth rates. In addition, the analysed companies do not explain why these growth rates and discount rates are applied. By and large, the information in the notes regarding intangible assets is superficial and abstract and its ex- tent differs over the years and companies. But generally it can be said that companies with higher ratios of intangible assets to total assets or to non-current assets provide more in- formation than companies with smaller ratios.

3.3 Survey Results

The results of the analysis of the companies provide an overview of the current reporting of intangible assets in Germany and allow for a first estimation of the importance and in- fluence of intangible assets. To analyse the estimations of the future influence we accom- plished the survey among the CPAs. The returned questionnaires were mainly replied by CPAs employed in the audit division (44%) and the advisory division (26%). These divi- sions are mainly responsible for the valuation of intangible assets. The remaining re- sponses were given by the following divisions: Corporate Finance (14%), Tax (10%), and others (6%). 41% of all interviewed CPAs are in the position of a Partner in their auditing firms. The other CPAs are employed as Director (5%), Senior Manager (18%), Manager (23%), Consultant (5%), Professional or Business Analyst (3%). The great interest of the high management level reflects the actuality and controversiality of this topic.

For the second section we define four industries: finance, service, manufacturing,

and high-tech. The CPAs had to choose between 1, i.e. very low, and 6, i.e. very strong

current influence of intangible assets on company performance. The frequency distribution

and the median (bold and italic) are illustrated in Figure 1. The strongest influence is as-

sumed for the high-tech (median value: 6) and manufacturing industry (median: 5). The

response behaviour is significantly different as tested by applying the Mann-Whitney U

test except for the service and manufacturing industry.

(40)

Figure 1

Current influence of intangible assets on company performance

For each industry the CPAs had to choose between 1, i.e. very low, and 6, i.e. very strong current influence of intangible assets on company performance. For each industry there are n = 39 responses. For each industry the frequency distribu-

tion is given. The location of median value is highlighted bold and italic.

3 3

0 0

12

7

4

1

8 6

2

6 4 4

9 7

1

6

2 13

6 8

19

25

0 5 10 15 20 25 30

finance service manufacturing high-tech

Industry

N um be r of re pl ie s

1 2 3 4 5 6

very low very strong

According to the German CPAs the current influence of intangible assets on company performance is on a high level and even will increase during the next few years. In particu- lar in the manufacturing and in the high-tech industry the influence will increase despite the already high current levels reported above. In the finance and service industry the in- fluence will be solid or slightly decrease. The response behaviour between all industries is significantly different (Mann-Whitney U test). Based on these results we conclude that intangible assets influence company performance which supports our expectations.

In the next step we classify five different groups of intangible assets: marketing,

customer, art, technology, and contract-related intangible assets (see IFRS 3). Regarding

the median of all answers we thereby can identify the most important intangible assets for

each industry. The results are presented as box plots (Figure 2). The surveyed accountants

state that in the finance and service industry the customer-related intangible assets and in

the manufacturing and in the high-tech industry the technology-related intangible assets

are the most important ones. Contract-related intangible assets have a strong influence in

(41)

all industries. Art-related intangible assets only play a marginal role. The response behav- iour especially for the high-tech industry is significantly different (Mann-Whitney U test).

Figure 2

Current influence of different groups of intangible assets on company performance

For each industry the CPAs had to choose for every group of intangible assets between 1, i.e. very low, and 6, i.e. very strong current influence on company performance. For each industry there are n = 39 responses. The results are pre- sented as box plots, which graphically depict the smallest observation, lower quartile, median, upper quartile, largest

observation, and outliers.

The third section of our questionnaire is included in order to identify the valuation meth-

ods that are most commonly used to determine the fair value of patented technologies and

to evaluate the suitability of these methods. First, we determine the mostly used valuation

approach. The frequency distribution and the median values are illustrated in Table 8. The

mostly used valuation approach for the fair value measurement of patented technologies is

the income approach (median of 6), followed by the market approach (median: 3) and the

cost approach (median: 2). We assume that this result directly reflects the fact of a typical

non-existence of an active market for intangible assets, which, in turn, hampers the appli-

(42)

cation of the hierarchy given in IFRS 38 (1. market approach, 2. income approach, 3. cost approach). A revision of the relevant accounting standards would be appropriate.

Table 6

Most commonly used valuation approaches to determine the fair value of patented technologies

The CPAs had to choose between 1, i.e. the approach is hardly used, and 6, i.e. the approach is mostly used. For each valuation approach there are n = 39 responses. The values present the relative frequency. Values in parentheses give the

absolute frequency. The rightmost column contains the median value.

hardly

used mostly

used median 1 2 3 4 5 6 Market Approach 21% (8) 13% (5) 23% (9) 26% (10) 15% (6) 3% (1) 3

Income Approach 0% (0) 3% (1) 3% (1) 15% (6) 26% (10) 54% (21) 6 Cost Approach 15% (6) 41% (16) 21% (8) 13% (5) 5% (2) 5% (2) 2

Next, we determine the – according to the CPAs – mostly used valuation methods for each

valuation approach (Table 9). For the market approach the valuation based on comparable

transactions is the mostly used valuation method (median: 4), followed by quoted market

prices in active markets (median: 2). Among the methods allowed under the income ap-

proach the ranking is as follows: Relief-from-Royalty Method (median: 5), methods using

direct cash flow forecasts (median: 4), Multi-Period Excess Earnings Method (median: 3),

and Incremental Cash Flow Method (median: 2). Within the cost approach the replacement

cost method is primarily used.

(43)

Table 7

Most commonly used valuation methods to determine the fair value of patented technologies

The CPAs had to choose between 1, i.e. the method is hardly used, and 6, i.e. the method is mostly used. For each valua- tion method there are n = 39 responses. The values present the relative frequency. Values in parentheses give the abso-

lute frequency. The rightmost column contains the median value.

hardly

used

mostly

used median 1 2 3 4 5 6 Market Approach

Market prices in active markets 33% (13) 26% (10) 21% (8) 8% (3) 10% (4) 3% (1) 2 Comparable transactions 13% (5) 18% (7) 13% (5) 26% (10) 26% (10) 5% (2) 4 Income Approach

Methods using direct cash flow forecasts 15% (6) 5% (2) 18% (7) 23% (9) 26% (10) 13% (5) 4 Relief-from-Royalty Method 5% (2) 5% (2) 10% (4) 8% (3) 36% (14) 36% (14) 5 Multi-Period Excess Earnings Method 13% (5) 21% (8) 23% (9) 33%(13) 8% (3) 3% (1) 3 Incremental Cash Flow Method 18% (7) 33% (13) 36% (14) 10% (4) 0% (0) 3% (1) 2 Cost Approach

Reproduction Costs Method 21% (8) 33% (13) 13% (5) 13% (5) 15% (6) 5% (2) 2 Replacement Costs Method 26% (10) 18% (7) 18% (7) 13% (5) 21% (8) 5% (2) 3

Furthermore we wanted to know from the CPAs whether the accounting standards leave room for accounting policy to exert influence on the reported value of intangible assets.

Most German CPAs (87%) state that accounting policy is indeed a relevant matter in this

context and thereby support our expectation. The income approach, according to the Ger-

man CPAs the mostly used valuation approach (see above), leaves the largest room to in-

fluence the valuation results. In particular the Relief-from-Royalty Method and methods

using direct cash flow forecasts are the best suited methods for accounting policy aims

(Figure 3), because these methods and the income approach in general heavily rely on

individual estimations of the valuation parameters, such as future cash flows or discount

rates. These facts cast doubt on the reliability of the value of reported intangible assets and

– at least to some extend – of the financial statements as a whole. Therefore, the analysts

and investors as well regulators should always scrutinize reported values of intangible

assets. Furthermore, a specification of the relevant accounting standards should be made

by the standard setters.

(44)

Figure 3

Room for accounting policy when applying different valuation methods

We present the results to what extent the selection of the valuation method influences the degree to which accounting policy can be used to exert influence on the reported value of intangible assets. For each valuation method the CPAs had

to choose between 1, i.e. accounting policy is not possible, and 6, i.e accounting policy is possible. For each valuation method there are n = 39 responses. The results are presented as box plots.

4 Conclusions

Intangible assets can be regarded as future value drivers of company performance. The results of this study indicate a gain in importance and influence of intangible assets. We also find that information on the valuation of intangible assets is still scarce and account- ing policy can be used in this context. Therefore not only companies but also investors, accounting standard-setters and CPAs need to pay special attention to reported intangible assets.

Due to the fact that accounting standards leave room for accounting policy the reli-

ability and objectivity of intangible asset valuations should be scrutinized during the

analysis of financial statements. We conclude that the role of CPAs will increase. They

have to value intangible assets, evaluate the valuations done by companies and provide

reliable (consolidated) financial statements. In addition the accounting standard-setters

have to issue more precise standards about the valuation of intangibles. The implementa-

Abbildung

Tabelle 1: Dissertationsportfolio
Table 1 shows the sum of all reported intangible assets including goodwill over the  sample period for the DAX and for the DAX without financial companies as well the  av-erage reported intangible assets including goodwill
Table 3  Ratios for the DAX
Table 2a. Correlations, NASDAQ sample
+7

Referenzen

ÄHNLICHE DOKUMENTE

The market clearing price is equal to unit wage costs if the expenditure ratio is unity and distributed profit is zero.. In this elementary case, profit per unit is zero and

Whilst the impact of Finance Theory (in the United States) on financial reporting pre Enron and post Enron (and even following the adoption of IFRS in many jurisdictions), cannot

The costs are normally pooled by nature (OAP – Education), which can be divided into intermediate and final objectives, that is intermediate and final activities. The Breakdown

Because a path has already been opened for accounting harmonization at regional level (European accounting directives), it became imperative to ensure the

And third- ly, in international trade the usage of (at least) medium-term contracts is often common. This means that the price information in unit values could be temporally

From a decisional point of view, the nonadditivity of the valuation has serious consequences for decision making: Agent B has the opportunity of purchasing firm U’s shares,

The use of CAPM‐based disequilibrium betas and Net Present Value (NPV) for investment decisions  and  valuations  is  widespread  in  finance.  Actually,  its 

After unit root tests and cointegration tests were conducted, the test of the RET were run by using a system in which coefficients of consumption, income, taxes and debt variables