(will be inserted by the editor)
Cryogenic characterization of a LiAlO 2 crystal and new results on spin-dependent dark matter interactions with ordinary matter
A. H. Abdelhameed
1, G. Angloher
1, P. Bauer
1, A. Bento
1,9, E. Bertoldo
?,a,1, R. Breier
2, C. Bucci
3, L. Canonica
1, A. D’Addabbo
3,10, S. Di Lorenzo
3,10, A. Erb
4,11, F. v. Feilitzsch
4, N. Ferreiro Iachellini
1, S. Fichtinger
5, D. Fuchs
1, A. Fuss
5,6, V.M. Ghete
5,6, A. Garai
1, P. Gorla
3, D. Hauff
1, M. Ješkovský
2, J. Jochum
7, J. Kaizer
2, M. Kaznacheeva
4, A. Kinast
4, H. Kluck
5,6, H. Kraus
8, A. Langenkämper
4, M. Mancuso
?,b,1, V. Mokina
5, E. Mondragon
4, M. Olmi
3,10, T. Ortmann
4, C. Pagliarone
3,12, V. Palušová
2,
L. Pattavina
3,4, F. Petricca
1, W. Potzel
4, P. Povinec
2, F. Pröbst
1, F. Reindl
5,6, J. Rothe
1, K. Schäffner
1, J. Schieck
5,6, V. Schipperges
7, D. Schmiedmayer
5,6, S. Schönert
4, C. Schwertner
5,6, M. Stahlberg
1, L. Stodolsky
1, C. Strandhagen
7, R. Strauss
4, I. Usherov
7, F. Wagner
5,6, M. Willers
4, V. Zema
3,10,13, J. Zeman
2(The CRESST Collaboration)
and
M. Brützam
14, S. Ganschow
141Max-Planck-Institut für Physik, D-80805 München, Germany
2Comenius University, Faculty of Mathematics, Physics and Informatics, SK-84248 Bratislava, Slovakia
3INFN, Laboratori Nazionali del Gran Sasso, I-67100 Assergi, Italy
4Physik-Department and Excellence Cluster Universe, Technische Universität München, D-85748 Garching, Germany
5Institut für Hochenergiephysik der Österreichischen Akademie der Wissenschaften, A-1050 Wien, Austria
6Atominstitut, Vienna University of Technology, A-1020 Wien, Austria
7Eberhard-Karls-Universität Tübingen, D-72076 Tübingen, Germany
8Department of Physics, University of Oxford, Oxford OX1 3RH, United Kingdom
9also at: Departamento de Fisica, Universidade de Coimbra, P3004 516 Coimbra, Portugal
10also at: GSSI-Gran Sasso Science Institute, 67100, L’Aquila, Italy
11also at: Walther-Meißner-Institut für Tieftemperaturforschung, D-85748 Garching, Germany
12also at: Dipartimento di Ingegneria Civile e Meccanica, Università degli Studi di Cassino e del Lazio Meridionale, I-03043 Cassino, Italy
13also at: Chalmers University of Technology, Department of Physics, SE-412 96 Göteborg, Sweden
14Leibniz-Institut für Kristallzüchtung, D-12489 Berlin, Germany Received: date / Accepted: date
Abstract In this work, a first cryogenic characterization of a scintillating LiAlO
2single crystal is presented. The re- sults achieved show that this material holds great potential as a target for direct dark matter search experiments. Three different detector modules obtained from one crystal grown at the Leibniz-Institut für Kristallzüchtung (IKZ) have been tested to study different properties at cryogenic tempera- tures. Firstly, two 2.8 g twin crystals were used to build dif- ferent detector modules which were operated in an above- ground laboratory at the Max Planck Institute for Physics (MPP) in Munich, Germany. The first detector module was used to study the scintillation properties of LiAlO
2at cryo- genic temperatures. The second achieved an energy thre- shold of (213.02±1.48) eV which allows setting a competi- tive limit on the spin-dependent dark matter particle-proton
?Corresponding authors
abertoldo@mpp.mpg.de
bmancuso@mpp.mpg.de
scattering cross section for dark matter particle masses be- tween 350 MeV/c
2and 1.50 GeV/c
2. Secondly, a detector module with a 373 g LiAlO
2crystal as the main absorber was tested in an underground facility at the Laboratori Nazio- nali del Gran Sasso (LNGS): from this measurement it was possible to determine the radiopurity of the crystal and study the feasibility of using this material as a neutron flux moni- tor for low-background experiments.
Keywords Dark matter
·Cryogenics
·Spin-Dependent
·Lithium
·Neutrons
Compiled on December 16, 2020
1 Introduction
In the past few decades, great effort has been devoted to the investigation of dark matter [1]. One path which could
arXiv:2005.02692v3 [physics.ins-det] 15 Dec 2020
ployed; it is relatively easy to change the target crystal and thereby take advantage of the properties of different target nuclei.
In 2019, the CRESST Collaboration published the first re- sults obtained with a lithium-based crystal operated in an above-ground laboratory [5], showing great potential for dark matter searches using lithium-containing crystals. Lithium is an attractive material because it is the lightest element that can be tested with the CRESST technology, which con- sists of a scintillating crystal equipped with a tungsten based Transition Edge Sensor (TES) operated at cryogenic temper- atures. Since CRESST is heavily oriented towards the search for dark matter particles with sub-GeV mass, the adoption of crystals containing light elements can boost this explo- ration due to the favorable kinematics. Furthermore, lithium is one of the best elements to investigate spin-dependent in- teractions, being mainly constituted of
7Li (92.41 % natural abundance [6]), which has
JN =3/2 and
hSpi=0.497 [7].
We do not investigate spin-dependent interactions with
6Li because of the current lack of
hSp/nivalues in the available literature.
Another appealing property of these crystals is the possibil- ity to detect the
6Li(n,α)
3H reaction:
6
Li
+n→α+3H
+4.78 MeV.(1) In fact, one of the most challenging sources of background for a direct dark matter search experiment are neutrons which, like dark matter particles, induce nuclear recoils. Through the detection of the above reaction, which shows a distinc- tive signature in a scintillating bolometer [8,
9], it is viableto precisely measure the neutron flux inside the experimen- tal setup and, with the support of Monte Carlo simulations, it might be possible to reconstruct the energy spectrum of the neutrons.
There are many crystals containing lithium that can be em- ployed, such as Li
2MoO
4[8,
10], Li2Mg
2(MoO
4)
3[11], Li
2WO
4[12], and LiF [13,
14]. Amongst these, a crystalwith promising properties is LiAlO
2. First, the CRESST tech- nology for the direct deposition of a TES on the crystal surface can be applied. Second, LiAlO
2is a scintillator at room temperature and shows a light emission with a 340 nm
2 Crystal growth
All the detector modules used in this work are based on LiAlO
2targets obtained from one single crystal grown at IKZ. The original crystal had a 5 cm diameter and was pro- duced using the Czochralski technique [18]. The primary challenge for the growth of this kind of material stems from its high melting temperature of 1780
◦C, which entails a stro- ng Li
2O evaporation. Li
2O evaporates not only from the melt, but also from the growing crystal: in unfavorable ther- mal conditions, this evaporation is so strong that an Li-free shell of
α-Al2O
3, a few millimeters thick, can form around the LiAlO
2crystal. To avoid crystal decomposition which would arise from this effect, the axial thermal gradient in the setup must be kept as steep as possible. However, a steep temperature gradient implies an increased superheating of the melt associated with an intensified Li
2O evaporation from the melt itself: this shifts the melt composition from the desired one towards an Al
2O
3-rich melt. Because of non- identical melt and crystal compositions, the crystallization with Al
2O
3-rich melt involves solute segregation. To a cer- tain extent, this results in the degradation of the grown crys- tals, in the form of a non-uniform macro distribution of the constituting elements and/or micro-inhomogeneities like se- cond-phase inclusions, mainly LiAl
5O
8, due to reduced in- terface stability. There is no perfect set of growth conditions and parameters which can avoid all the effects of Li
2O evap- oration: a practical solution will necessitate a compromise among crystal perfection, crystal size, and cost of the pro- cess.
The crystal used in this work was grown inside a cylindrical
iridium crucible of 100 mm diameter in an argon protec-
tive atmosphere. The raw materials used for the crystal pro-
duction are Li
2CO
3and Al
2O
3compounds with a 4N/5N
purity. Special attention was paid to the preparation of the
raw material in order to prevent Li
2O losses before the crys-
tal growth: these materials were weighed and mixed in a
stoichiometric ratio and calcinated at temperatures between
700
◦C and 750
◦C in platinum crucibles. The temperature
and duration for this preparation was deduced from thermo-
gravimetric measurements of the starting materials [19].
Fig. 1 Close-up ofmodule A. It is possible to see the 2.8 g LiAlO2
crystal instrumented with the NTD sensor through the CRESST-III light detector.
During the crystal growth, the axial temperature gradi- ent was increased step-wise by changing the thermal insula- tion, until the opaque Al
2O
3shell disappeared entirely and a shiny transparent crystal was obtained. This was achieved by applying a pulling rate of 1.5 mm/h when growing along the (100) direction, together with a crystal rotation between 10 and 25 rpm to improve the melt mixing. A more detailed description of the growth procedure, crystal defects, and tun- ing of the parameters can be found in [20].
3 Experimental setup at Max Planck Institute
Two (20x10x5) mm
3crystals with a mass of 2.8 g each were cut from the LiAlO
2single crystal produced at IKZ, and were used to assemble two different detector modules.
The first crystal was used to assemble
module A, a detec-tor module (see Figure
1) designed to characterize LiAlO2at cryogenic temperatures. In this case, the crystal was instru- mented with a Neutron Transmutation Doped (NTD) ger- manium thermistor [21] glued
1to one surface. The crystal was held in position inside a copper frame by two strings of PTFE tape. Electrical and thermal connections to the NTD were provided via 25
µm diameter gold bond wires. Thetemperature variation of the NTD was obtained by measur- ing the resistance of the thermistor. To do so, a constant bias current was sent through the NTD and the voltage drop of the sensor was measured with a commercial differential
1GP 12 Allzweck-Epoxidkleber, Gößl + Pfaff
Fig. 2 Close-up ofmodule B, constituted by a 2.8 g LiAlO2crystal in- strumented with a TES directly deposited on the surface. On the bottom right corner a scheme of the TES is shown (see text for details).
voltage amplifier
2. A CRESST-III light detector (LD) [16]
was facing the crystal, held in position by two CuNi clamps;
this LD was made of a sapphire plate with a 1
µm siliconlayer epitaxially grown on one face (Silicon-on-Sapphire) with a TES as thermal sensor deposited on the silicon side.
The readout of the light detector is obtained with a commer- cial SQUID system
3, combined with a CRESST-like detec- tor control system [22]. An
55Fe X-ray source with an activ- ity of
∼0.05 Bq was placed at a distance of∼0.5 cm fromthe light detector to calibrate its energy response. The TES on the LD had a critical temperature
TCLD=22 mK.
The second crystal constituted the main absorber of
mo- dule B(Figure
2), a detector designed to reach a low energythreshold (< 1 keV). The crystal was held in position inside a copper frame by two CuNi clamps. On one face of the crys- tal, a TES with a design similar to that of the light detector was deposited. The TES is constituted by a thin strip of tung- sten with two large aluminum pads partially overlapping the tungsten layer. The aluminum pads serve two different pur- poses, as phonon collectors and as bond pads. The bond pads are connected via a pair of 25
µm aluminum bond wiresthrough which the bias current is injected. The tungsten film is also connected by a long and thin strip of gold to a thicker gold bond pad on which a 25
µm gold wire is bonded. Thegold strip serves as a weak thermal link between the sensor and the heat bath at
∼10 mK. On the same surface, but sep-arated from the TES, there is an evaporated heater made of a thin strip of gold with two aluminum pads deposited on top.
2Stanford Research System - SR560 Low-noise voltage preamplifier
3Applied Physics System model 581 DC SQUID
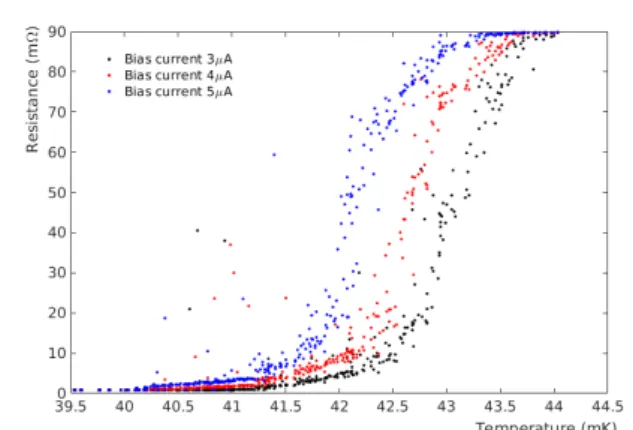
Fig. 3 Measurement of resistance versus temperature with 3 different bias currents applied to the TES onmodule B. At∼42.5 mK there is a transition between a superconducting response and a normal con- ducting response (Critical TemperatureTC) measured with a 4µA bias current. TheTChas a slight dependence on the bias current applied to the TES caused by the electrothermal feedback.
These pads are bonded with a pair of 25
µm aluminum bondwires through which a tunable current is injected to maintain the TES at the desired temperature. The heater is also used to inject heater pulses to monitor the detector response over time and for calibration purposes.
This TES had a critical temperature
TCB '42.5 mK (Fig- ure
3) when operated with a 4µA bias current.TCBis rather high compared to usual transition temperatures of CRESST TESs (∼15 mK); this can negatively affect the performance of the calorimeter, resulting in a higher energy threshold.
The two modules have been operated together inside a Leiden Cryogenics dilution refrigerator at the Max Planck Institute for Physics in Munich, Germany. The dilution re- frigerator is located in an above-ground laboratory without shielding against environmental and cosmic radiation. The modules have been mechanically and thermally connected to the coldest point of the dilution refrigerator (∼10 mK).
4 First cryogenic characterization of LiAlO
2Since there is no literature available on the cryogenic per- formance of LiAlO
2, the starting point was to study its ba- sic properties. This was done using
module A, which al-lowed an initial overview on scintillation, light yield (LY), and Quenching Factors (QFs)
4[23–25] for different parti- cle interactions inside the crystal.
The energy calibration of the light detector was performed using the peaks originating from the
55Fe source (Figure
4).After calibration, the baseline resolution of the light detec- tor is
σbaselineLD = (26.64±1.20) eV, while the resolution at 5.895 keV is
σFe=(123.9±4.1) eV.
4The Quenching Factor for the interaction of an arbitrary particlexis defined as:QFx=LYx/LYγ
the LiAlO
2form one band starting from zero energy and with a light yield of (1.180±0.103) keV/MeV, where the LY is defined as:
LY
=Energy
LDEnergy
NTD(2)
Neutrons scattering within the crystal exhibit a band star- ting from zero energy as well, but with a much reduced light yield (0.284±0.056) keV/MeV, resulting in a Quench- ing Factor for neutrons equal to 0.241. At high energies and with a light yield of
∼0.75 keV/MeV (or (3.438±0.227) keVat 4.78 MeV), in between the
β/γ band and the neutron band, the neutron capture by
6Li appears. Assuming a linear light emission up to this energy, the QF for the neutron capture is 0.599.
The separation between the
β/γ band and the neutron band starts to become evident at
∼170 keV; thus, in the energy re-gion of interest for dark matter search (∼0-10 keV) it will be unlikely to achieve an effective particle discrimination based on the light yield, even with a substantial improvement of the light collection in comparison to this measurement. In the vicinity of the neutron capture a small family of events appears, with a slightly higher energy. There is currently no clear interpretation and further investigations will be carried out to understand its origin, which might be tied to a reso- nance in the cross section for the
6Li(n,α)
3H reaction. This family of events has not been observed in the LNGS mea- surement (see Section
7), but the neutron source employedin that case had an extremely reduced activity with respect to the above-ground measurement.
5 Dark matter results
As explained in Section
4,module Bwas designed to study
spin-dependent interactions of low-mass dark matter parti-
cles with nuclei of a LiAlO
2crystal in a cryogenic measure-
ment. A low threshold is a key parameter to reach this goal,
due to the steep increase of expected dark matter recoils at
lower energies. For this reason the TES was directly evap-
orated onto the LiAlO
2surface, applying, for the first time,
Fig. 4 Energy spectrum of events registered by the CRESST-III light detector in the energy region of X-ray emission by the55Fe source.
Two peaks are visible: one at 5.895 keV, resulting from the sum of Kα1
and Kα2lines, and one at 6.490 keV, resulting from the sum of Kβ2and Kβ3lines. The fit function (red solid line) consists of the sum of two Gaussian functions (µ1andµ2are the expected values,σ1andσ2the standard deviations) plus a constant factor c to account for the flat back- ground. In principle,σ2should not be lower thanσ1, but we attribute this anomaly to the presence of an energy loss in the left shoulder of the 5.895 keV peak. The 5.895 keV peak is used to obtain the energy calibration of the light detector.
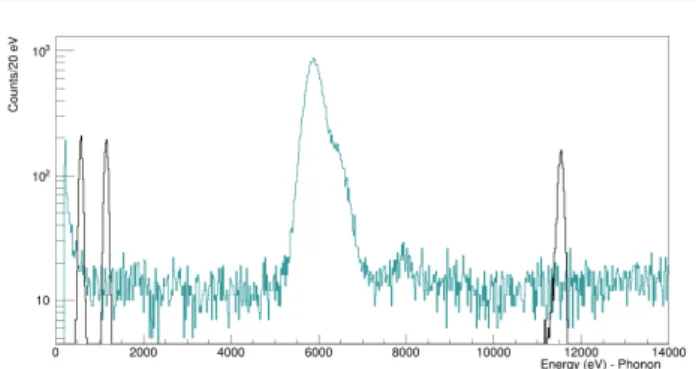
Fig. 5 Energy measured by the CRESST-III light detector versus en- ergy measured by the NTD for each event registered bymodule Ain the presence of an AmBe neutron source during 9.44 hours of data collec- tion. Two bands starting from zero appear: the one with the higher light emission is constituted by β/γ events interacting inside the LiAlO2
crystal, while the one with lower light emission is caused by the scat- tering of neutrons within the crystal. At 4780 keV a different family of events appears, due to the neutron capture of6Li. In the vicinity of the neutron capture there is an additional family of events, with a slightly higher energy. This family currently is of unknown origin and the mod- eling of the anomalously high light yield is particularly challenging.
the CRESST technology on a crystal containing lithium . A total of 22.2 hours of data without any source ("back- ground data") were collected for
module Busing a contin- uous DAQ with a sampling rate of 25 kHz. The events were triggered with a dedicated software based on the optimum filter [26].
The energy calibration is implemented using the 5.895 keV peak from the
55Fe source, similar to the one used for the LD of
module A. During the run, heater pulses offour different known amplitudes were injected to interpolate the energy calibration in the whole energy region of inter- est. The peaks corresponding to the heater pulses are identi- fied in the dataset: each peak is fit with a Gaussian function which returns the mean and the error of the mean. After-
Fig. 6 Injected amplitude of 4 different heater pulses versus amplitude registered by the TES (black crosses) expressed in arbitrary units. Each amplitude registered by the TES with relative error are obtained from the peaks appearing in the raw spectrum via a Gaussian fit. The four points are fit with Equation3, which is used for the energy calibration of the detector.
wards, the amplitude of heater pulses (A
injected) versus the amplitude measured by the TES (A
phonon) is plotted and the following function is fit to the data points:
A
phonon=p0
·p1
·A
injected·I
R
L+p1
·A
injected(3)
where p0 is the gain of the SQUID, I is the bias current of the TES, R
Lis the load resistor, and p1 is a coefficient which translates the temperature change of the TES, induced by the heat pulse, into a variation of the TES resistance. Equa- tion
3is derived from the circuit scheme used to read out the TES [22]. For this measurement I=9
µA, while RL=40 mΩ;
p0 and p1 are the free parameters of the fit. Finally, the mean value registered by the TES A
phonon=(2379.2±0.7) a.u. cor- responding to the 5.895 keV X-ray is used to convert A
phononto energy via Equation
3. This description assumes that theTES resistivity changes linearly with the temperature in the energy interval considered (0-6 keV). With this method an accurate energy calibration (Figure
6) was obtained takinginto account the intrinsic non-linearity of the read-out sche- me. The baseline resolution is
σbaselineB=(39.75±1.23) eV.
The corresponding energy threshold for particle interactions with the target is
ETB=(213.02±1.48) eV, calculated by using the same method as presented in [27]. In this case, however, the total rate of counts in the noise above threshold (noise trigger rate) is set to 10
3counts/(keV·kg·day), two orders of magnitude lower than the observed event rate in the 1-5 keV range.
Figure
7shows the calibrated energy spectrum of the 22.2 hours background measurement. The X-ray peaks from
55
Fe decay clearly emerge. A moderate rise of events below 300 eV is also evident. The energy resolution at 5.895 keV, calculated in the same way as for the LD of
Module A, is σKα=(184.0±1.6) eV, significantly worse than the resolution for heat pulse events which is equal to
σHP2
=(41.6±1.0) eV at 1.159 keV and
σHP3=(57.0±1.6 eV)
to the dead time, reducing the exposure from 22.2 hours to 17.2 hours, corresponding to a total exposure of 2.01·10
−3kg·day, with an exposure for
7Li of 1.95·10
−4kg·day and an exposure for
27Al of 8.22·10
−4kg·day. The exclusion lim- its are calculated using Yellin’s optimal interval method [29,
30] and are shown in Figure 8. The baseline resolution ofthe detector
σbaselineBand the energy threshold
ETBare taken into account to evaluate the minimum value of dark mat- ter mass for which it is possible to draw exclusion limits.
These limits are valid for both
proton-onlyinteractions and for
neutron-onlyinteractions, as discussed in the theoreti- cal framework presented in [5]. The calculation of the ex- clusion limits adopts the standard dark matter halo model, which assumes a Maxwellian velocity distribution and a lo- cal dark matter density of
ρDM=0.3
(GeV/c2)/cm3[31].
Furthermore,
vesc =544 km/s is assumed for the galactic escape velocity [32] and
v=220 km/s for the solar orbit velocity [33]. For the
proton-onlyexclusion limits
hSpi=0.4970 for
7Li and
hSpi=0.3430 for
27Al are used, while for the
neutron-onlyexclusion limits
hSni=0.0040 for
7Li and
hSni=0.0296 for
27Al [7,
17] are used. The data anal-ysis efficiency is computed generating a known flat energy spectrum of events. These events are created by superim- posing the ideal detector response on recorded data and then processed with the same analysis chain used for the real data. The fraction of surviving events over the total simu- lated events at each energy bin represents the data analysis efficiency. Since the determination of the amplitude and the triggering are done in one step by the optimum filter and no further data selection criteria applied, in this case the data analysis efficiency is equivalent to the trigger efficiency.
6 Experimental setup at LNGS
After the successful tests at MPP, the bulk of the original LiAlO
2crystal sample was mechanically polished obtaining a 373 g crystal. Such crystal size is ideal to study the crys- tal radiopurity and to assess the feasibility of using LiAlO
2crystal as a monitor for the neutron flux in a shielded ex- perimental setup. For this reason, this crystal was used in a new detector module,
module C, which was installed inticle events only. At 5.895 keV the peak caused by the X-ray emis- sion of 55Fe decay appears; the energy resolution at 5.895 keV is equal toσKα=(184.0±1.6) eV. The resolution for heat pulse events is equal toσHP2=(41.6±1.0) eV at 1.159 keV andσHP3=(57.0±1.6 eV) at 11.537 keV. Below 300 eV there is a rise in the spectrum.
Fig. 8 Top:Exclusion limits set by various direct detection experi- ments for spin-dependent interactions of dark matter particles with neutrons. The result obtained from module B data with 7Li+27Al is shown in solid red. The first result obtained by CRESST using
7Li is plotted in dotted red [5], while the result obtained with 17O in CRESST-III is shown in dashed red [4]. For comparison, limits from other experiments are also shown: EDELWEISS [34] and CDM- Slite [35] using73Ge, LUX [36] and XENON1T (Migdal effect) [37]
using129Xe+131Xe. Bottom: The same, but for spin-dependent in- teractions of dark matter particles with protons. The result obtained frommodule Bdata with7Li+27Al is shown in solid red. The first result obtained by CRESST using 7Li is plotted in dotted red [5].
Additionally, limits from other experiments are also shown: CDM- Slite with73Ge [35]; PICO with19F [38]; XENON1T (Migdal effect) with129Xe+131Xe [37]; Collar with1H [39]. Finally, a constraint from Borexino data derived in [40] is shown in dotted black.
the MPP Test-Cryostat facility located in the underground laboratory of Laboratori Nazionali del Gran Sasso (LNGS), under 3600 m water equivalent overburden to shield against cosmic radiation [41].
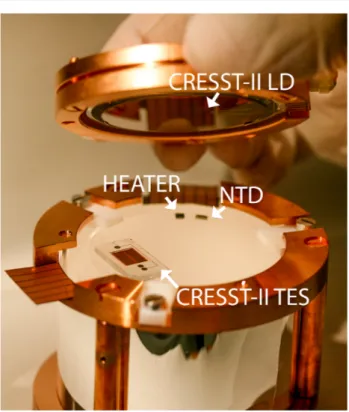
As visible in Figure
9, an NTD [21], a (5×5×1) mm3Si carrier with a thin gold stripe heater deposited on it, and a CaWO
4carrier crystal on which a CRESST-II TES had been evaporated [42] are both glued
5to the top surface of the LiAlO
2crystal. The NTD and the CRESST-II TES are both being used as phonon sensors. This choice is motivated by the fact that the NTD has a higher dynamic range than the TES, while the TES can generally achieve a lower en- ergy threshold than the NTD. Therefore, with this detector module it is possible to study both the low energy part of the spectrum (∼1 keV) and the high energy part (∼10 MeV).
This allows the potential setting of competitive limits for spin-dependent dark matter search and the detailed study of the neutron capture by
6Li during the same measurement.
The crystal was held in position inside a copper holder us- ing three PTFE clamps on the bottom and three on the top.
Reflective foil
6was used to surround the crystal, in order to maximize light collection. A CRESST-II light detector [43]
was facing the top surface of the LiAlO
2crystal, completing the detector module.
The MPP Test-Cryostat facility is located in the corridor connecting Hall A and Hall B of LNGS. The model of di- lution refrigerator installed in this facility is the same as the one used for the above-ground measurement at MPP. The detector module operated in this dilution refrigerator em- ploys the same kind of wiring, NTD readout, and TES read- out as in the previous above-ground measurement.
7 Neutron and radiopurity measurements at LNGS The detector operation of
module Cat LNGS was divided into two parts: one focused on the efficacy of measuring neutrons, the other on measuring the radioactive impurities in the crystal. For these type of measurements, the data col- lected with the NTD (that does not saturate in the energy re- gion of interest) and the CRESST-II light detector have been analyzed. The CRESST-II TES was also simultaneously op- erated as a phonon sensor to study the low-energy part of the spectrum (<1 MeV).
At the beginning of the run an AmBe neutron source emit- ting
∼10 neutrons/s was installed at a distance of∼60 cmfrom the center of the dilution refrigerator and 13.1 hours of data were collected. To ensure the stability of the NTD sensor, heater pulses with seven different amplitudes were injected, two of which were close to the energy region of interest for the neutron capture by
6Li (Equation
1). The de-5GP 12 Allzweck-Epoxidkleber
63M’s VikuitiTMEnhanced Specular Reflector
Fig. 9 Detectormodule Cwas operated at LNGS. A 373 g crystal is in- strumented with two phonon sensors glued on the top surface: an NTD and a CRESST-II TES. On the same surface there is a glued heater which ensures the stability of the detector operation. The crystal is sur- rounded by reflective foil and a CRESST-II light detector is facing the top surface of LiAlO2.
Fig. 10 QF versus the energy registered by the NTD sensor for 13.1 hours of effective live time in the presence of a weak AmBe source. For energies.2.6 MeV it is possible to see theβ/γband which was used to normalize the QF. At energies&3 MeV and for lower QF values, multiple families originated byα decays and one prominent line at 4.78 MeV corresponding to the neutron capture of6Li can be seen.
tector response was calibrated using these heater pulses and the 4.78 MeV peak corresponding to the neutron capture.
After calibration, the energy resolution at 4780 keV is
σcapture=(18.3±1.02) keV. In Figure
10, the scatter plot ofQF versus the energy registered by the NTD for all the events
recorded during the neutron measurement is presented. In
this plot, the neutron capture peak shows a higher QF than
Fig. 11 Distribution of QF values for events originated byα decays with a mean value of 0.38±0.04 (red) and distribution of QF for neu- tron capture events with a mean value of 0.44±0.03 (blue).
the events originating from
αdecays. These two classes of events are used to build two histograms (Figure
11): neu-tron capture events are selected from an energy interval of
±3σcapture
centered around 4780 keV, while all other events above 4 MeV are considered alpha events. It is possible to see that the two distributions are partially overlapping. How- ever, even with a simple cut on the QF value one can ex- clude the vast majority of unwanted
αdecay events: if only events with a QF>0.44 (the mean value of the neutron cap- ture distribution) are accepted, 93.3% of
αevents are cut while halving the detection efficiency for the neutron cap- ture. The efficiency in discarding
αevents can then also be considerably increased defining a cut on the energy detected by the NTD phonon sensor: clearly, this cut is more effective the higher the energy resolution of the NTD.
In a low-background environment only a few neutron events are expected, while the number of alpha events depends on the radiopurity of the detector. This means that there would probably be not enough events to build two distributions based on the QF values. However, it is possible to perform a neutron calibration and then, based on the data, define a region where neutron events are expected during the back- ground data campaign. From the total number of events in- side this region, it is then feasible to quote a neutron flux value (or upper limit) with the respective uncertainty.
The long term goal for CRESST is to directly detect neu- trons inside the experimental setup using a specifically de- signed detector based on a lithium-containing crystal, thereby providing a relevant input to the background model of the experiment. From this data, using dedicated Monte Carlo simulations, the total neutron flux (or an upper limit) can be assessed while also possibly reconstructing the energy spec- trum of the incoming neutrons. The measurement presented in this work is a first step in this direction.
After the neutron measurement, the AmBe source was removed to measure the radiopurity of the crystal. In this case, a 58.4 hours background measurement was carried out.
but the heater pulses that were previously calibrated were used instead. In Figure
12, the energy spectrum measuredby the NTD is shown without cuts. From this spectrum, at least 6 different peaks due to
αdecays in the 4-7 MeV re- gion can be distinguished. After a careful evaluation, it can be assumed that three radioactive parents are inducing the peaks highlighted:
210Po,
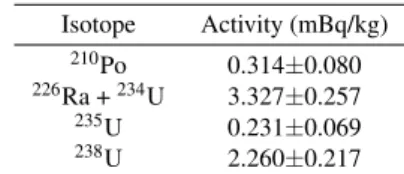
226Ra, and natural uranium. The respective calculated activities are listed in Table
1. In prin-ciple,
226Ra should be part of the
238U decay chain, but it is not possible to correctly match the respective activities.
One straightforward explanation is that
226Ra and
238U are not in secular equilibrium; as such the two contaminants are treated as separate parents of their respective decay chain. In fact, in the case of the secular equilibrium the peak centered around 4.86 MeV is expected to be
∼3 times more populatedthan the
238U peak, due to the summing of
226Ra,
230Th, and
234
U activities. However, this peak is only 1.43 times more populated than the
238U peak and equal, well within 1 sigma, to the sum of
222Rn (0.962±0.142 mBq) and
238U activities.
One explanation which can fit well the data is that
226Ra and its daughters are in secular equilibrium and have the same activities, while we do not observe the daughters of
238U and
235U decay chains. The activities ratio of the uranium isotopes are roughly as expected for the presence of natural uranium, only the activity of
235U is slightly higher than ex- pected, but within 2 sigma. It has to be noted that the
235U peak is the least populated and so the most affected by statis- tical uncertainties. The uranium peaks appear to be broader than the peaks caused by the
226Ra daughters. This could signal that the uranium might be present both internally and on the surfaces of the crystal, while
226Ra might prevalently be an internal contamination. This observation, combined with the break of the secular equilibrium between
238U and
226
Ra, could point at two contaminations at different stages of the crystal production and handling, one related to
226Ra and one due to natural uranium.
In addition to the
214Bi-
214Po decays, two peaks can be at- tributed to the daughters of
226Ra:
218Po and
222Rn. Finally, a modest contamination of
210Po is also observed.
The total number of events above 3 MeV is 483: this means
an upper bound on the total alpha activity of (10.1±0.5)
Fig. 12 Energy spectrum registered by the NTD during a background measurement of 35.6 hours effective time. From this spectrum at least 7 different sources ofαdecays in the 4-7 MeV region can be distin- guished and above 7 MeV additional events, likely due to214Bi-214Po decays, appear.
mBq/kg for this particular LiAlO
2crystal. Considering this value, the radiopurity of this crystal is
∼3 times worse thanthe most radiopure CaWO
4crystal produced within the CRESST Collaboration (TUM40) [44], but in line with stan- dard commercial CaWO
4crystals. The goal for the future is to drastically improve the radiopurity of LiAlO
2, starting from a careful selection of the raw materials used for the crystal growth, and the material used for cutting and pol- ishing. Additionally, a 20.8 hours calibration using a
241Am gamma source installed close to the outer shield of the di- lution refrigerator was carried out to test the performance of the CRESST-II TES [45]. During the calibration and the background measurement, heater pulses with nine different amplitudes were injected. The 59.54 keV gamma peak from the
241Am source used for the energy calibration has a res- olution of
σAm=(3.044±0.074) keV. Similarly for the TES calibrations presented before, this peak and the peaks cor- responding to the injected heater pulses are used to accu- rately calibrate the detector response at different energies.
The sensor has an energy threshold of (2.601±0.126) keV, considerably higher than that achieved in the measurement performed above-ground with a smaller LiAlO
2crystal: this is expected due to the large increase in mass as showed by the scaling law described in [46].
8 Conclusions
This work details the results of three different detectors, all of which employ a LiAlO
2target crystal, a material that has never been employed in cryogenic experiments thus far.
The cryogenic properties of the material were tested in an above-ground laboratory with a 2.8 g crystal and new lim- its on spin-dependent dark matter interactions are set with a crystal instrumented with a TES deposited on LiAlO
2. A large-size detector with a mass of 373 g was operated in an
underground cryogenic facility at LNGS in the presence of a weak neutron source, in order to assess the feasibility to monitor the neutron flux directly inside cryogenic setups.
The results presented in this work demonstrate the high po- tential of LiAlO
2crystals as cryogenic detectors in the field of low-background applications and contribute to the ongo- ing search for dark matter.
Acknowledgements This work is supported through the DFG by SFB1258 and the Origins Cluster, and by the BMBF05A17WO4.
References
1. G. Arcadiet al., The European Physical Journal C78, 203 (2018), 1703.07364.
2. T. Marrodán Undagoitia and L. Rauch, Journal of Physics G43, 013001 (2016), 1509.08767.
3. CRESST, G. Angloheret al., The European Physical Journal C 76, 25 (2016), 1509.01515.
4. CRESST, A. H. Abdelhameed et al., Physical Review D100, 102002 (2019), 1904.00498.
5. CRESST, A. H. Abdelhameedet al., The European Physical Jour- nal C79, 630 (2019), 1902.07587.
6. J. Meijaet al., Pure and Applied Chemistry88, 293 (2016).
7. A. Pacheco and D. Strottman, Physical Review D40, 2131 (1989).
8. O. Barinovaet al., Nuclear Instruments and Methods in Physics Research Section A613, 54 (2010).
9. L. Cardaniet al., Journal of Instrumentation8, P10002 (2013), 1307.0134.
10. N. Casali et al., Journal of Physics G 41, 075101 (2014), 1311.2834.
11. M. Martinezet al., Journal of Physics: Conference Series375, 012025 (2012).
12. A. A. et al., Nuclear Instruments and Methods in Physics Research Section A949, 162784 (2020).
13. K. Miuchiet al., Astroparticle Physics19, 135 (2003).
14. F. A. Danevichet al., Nuclear Instruments and Methods889, 89 (2018), 1802.01888.
15. T. Yanagidaet al., Journal of the Physical Society of Japan86, 094201 (2017).
16. J. Rotheet al., Journal of Low Temperature Physics (2018).
17. J. Engel, M. T. Ressell, I. S. Towner, and W. E. Ormand, Physical Review C52, 2216 (1995), 9504322.
18. B. Cockayne and B. Lent, Journal of Crystal Growth54, 546 (1981).
19. R. Bertram and D. Klimm, Thermochimica Acta419, 189 (2004).
20. B. Veliˇckovet al., Journal of Crystal Growth310, 214 (2008).
21. N. Wang, F. C. Wellstood, B. Sadoulet, E. E. Haller, and J. Bee- man, Physical Review B41, 3761 (1990).
22. G. A. et al., Astroparticle Physics31, 270 (2009).
23. V. I. Tretyak, Astroparticle Physics33, 40 (2010), 0911.3041.
24. R. e. a. Strauss, The European Physical Journal C74(2014).
25. S. et al., Journal of Low Temperature Physics176, 905–910 (2014).
26. E. Gatti and P. F. Manfredi, La Rivista del Nuovo Cimento9N1, 1 (1986).
27. M. Mancusoet al., Nuclear Instruments and Methods in Physics Research Section A940, 492 (2019), 1711.11459.
28. CRESST, G. Angloheret al., The European Physical Journal C 77, 637 (2017), 1707.06749.
29. S. Yellin, Physical Review D66, 032005 (2002), 0203002.
30. S. Yellin, (2007), 0709.2701.
1902.04031.
39. J. I. Collar, Physical Review D98, 023005 (2018), 1805.02646.
40. T. Bringmann and M. Pospelov, Physical Review Letters122, 171801 (2019), 1810.10543.
41. MACRO, M. Ambrosioet al., Physical Review D52, 3793 (1995).
42. CRESST, R. Strausset al., The European Physical Journal C75, 352 (2015), 1410.1753.
43. G. Angloheret al., Journal of Low Temperature Physics184, 323 (2016).
44. CRESST, R. Strausset al., Journal of Cosmology and Astroparti- cle Physics1506, 030 (2015), 1410.4188.
45. E. e. a. Bertoldo, Journal of Low Temperature Physics199, 510 (2020).
46. R. Strausset al., The European Physical Journal C77, 506 (2017), 1704.04320.