Policy Research Working Paper 7055
Spatial Dynamics of Electricity Usage in India
Ejaz Ghani Arti Grover Goswami
William R. Kerr
Macroeconomics and Fiscal Management Global Practice Group October 2014
WPS7055
Public Disclosure AuthorizedPublic Disclosure AuthorizedPublic Disclosure AuthorizedPublic Disclosure Authorized
Produced by the Research Support Team
Abstract
The Policy Research Working Paper Series disseminates the findings of work in progress to encourage the exchange of ideas about development issues. An objective of the series is to get the findings out quickly, even if the presentations are less than fully polished. The papers carry the names of the authors and should be cited accordingly. The findings, interpretations, and conclusions expressed in this paper are entirely those of the authors. They do not necessarily represent the views of the International Bank for Reconstruction and Development/World Bank and its affiliated organizations, or those of the Executive Directors of the World Bank or the governments they represent.
Policy Research Working Paper 7055
This paper is a product of the Macroeconomics and Fiscal Management Global Practice Group. It is part of a larger effort by the World Bank to provide open access to its research and make a contribution to development policy discussions around the world. Policy Research Working Papers are also posted on the Web at http://econ.worldbank.org. The authors may be contacted at EGhani@WorldBank.org.
India’s manufacturing sector has undergone many spa- tial adjustments since 1989, including, for example, the organized sector’s migration to rural locations, the power- ful rise of informal manufacturing within cities, and the development of intermediate cities for manufacturing. This paper investigates the impact of these spatial adjustments for electricity usage in India’s manufacturing sector. Strik- ing spatial differences in energy usage exist, and whether spatial adjustments exacerbate or alleviate energy consump- tion strains is important for issues ranging from reducing India’s power blackouts to stemming rising pollution levels. Using detailed surveys for the organized and unor- ganized sectors, the analysis finds that electricity usage per unit of output in urban plants declined steadily during
1989–2010. In the rural areas, by contrast, electricity con- sumption per unit of output for organized sector plants peaked in 2000 and thereafter declined. Decomposing the observed trends in aggregate electricity usage from 2000 onwards, the paper finds that most reductions in electricity usage per unit of output came from reductions in exist- ing sites of activity (defined through state-industry-urban/
rural cells). The second biggest factor leading to reduced usage was lower usage in fast-growing sectors. By contrast, spatial movements of manufacturing activity across India did not significantly change usage levels and may have even increased them. This appears to have been in part because of the split nature of the mobility, with organized and unorganized sectors migrating in opposite directions.
Spatial Dynamics of Electricity Usage in India
Ejaz Ghani, Arti Grover Goswami and William R. Kerr
Key words: Energy, Electricity, Efficiency, Spatial, Manufacturing, India.
JEL Classification: Q4; D2, L2, L6, L9, O1, O4, R0, R1, R3
Author institutions and contact details:
Ghani: World Bank,
Eghani@worldbank.org; GroverGoswami: World Bank,
agrover1@worldbank.org; Kerr: Harvard University, Bank of Finland,and NBER, wkerr@hbs.edu.
Acknowledgments: We are grateful for helpful suggestions/comments received from Gilles
Duranton, Rajat Gupta, Vijay Jagannathan, Stephen O’Connell, and Jevgenijs Steinbuks. We
thank Katie Williams for excellent work on maps. Funding for this project was provided by
World Bank. The views expressed here are those of the authors and not of any institution they
may be associated with.
3 I. Introduction
India ranks fourth in the world in energy consumption, placed after United States, China, and Russia. India is not well endowed with abundant energy resources, making questions of energy security and sustainability a matter of national importance. Of course, as the world’s second- largest country, how India manages its industrialization and urbanization process is a matter of global importance. These processes and India’s energy usage will directly impact worldwide energy prices, pollution levels and climate change, and much beyond.
India is slowly working towards sustainable equilibrium in its energy consumption patterns.
1For instance, the energy intensity of GDP in India, defined as the energy input associated with a unit of GDP, has declined from 1.09 kilogram unit of oil equivalent (koe) per USD in 1981 to 0.66 koe per USD in 2011 (Planning Commission, 2012; also see Prayas, 2009). Using GDP at purchasing power parity, India’s energy intensity drops to 0.19, which is at par with the world average, but higher than most of the European countries. Specifically, China’s energy intensity is roughly 1.5 times that of India (World Energy Outlook, 2011).
2These aggregate trends and their future trajectories are comprised of spatial and industrial developments in energy usage within India. This study charts out these detailed and localized patterns of electricity consumption for India’s manufacturing sector. We specifically consider the formal and informal manufacturing sectors in India and a time span stretching from 1989 to 2010. Understanding these patterns from a cross-sectional or static perspective is important so as to identify areas of best potential for improvement (e.g., heavy consumption industries, leading vs. lagging states). While such detail is important, assembly of data surrounding energy usage is difficult for a host of reporting factors depicted below. A very important part of this project is the development of a comprehensive data platform to provide metrics on these levels of activity.
Beyond these static depictions, however, lies our real focus on the dynamics of India’s electricity usage and how they relate to India’s changing economic geography. India’s manufacturing sector
1 For an overview of the power sector in India, see World Bank (2013), Abeberese (2013), and Alam (2013).
2 Recent estimates by McKinsey & Company (2014) suggests that India’s overall energy intensity at 0.56 koe/USD, which is high compared to even other developing countries like Brazil at 0.25 koe/USD or Malaysia at 0.40 koe/USD, indicating significant improvement potential.
4
has been undergoing significant spatial transformations since the liberalizations began in the 1990s. Recent research shows that the organized sector is transitioning out of urban areas and towards rural locations within districts, while the unorganized sector, by contrast, is transitioning towards urban areas within districts (Ghani et al., 2012). Looking across districts, the organized sector is increasingly locating in sites along major infrastructure projects like the Golden Quadrangle highway network (Ghani et al., 2014). This has activated medium-density intermediate cities to be an important part of India’s manufacturing growth, an area where India has struggled (e.g., Desmet et al., 2013). Several studies show the importance of new entrants in these spatial dynamics, and Ghani et al. (2013) describe how the location of plants by urban vs.
rural settings impact their material input usage and associated productivity.
This study examines these forces through the unique lens of the efficient use of energy. To begin, very little is known about whether the electricity usage per unit of output is higher or lower along the following dimensions:
Urban vs. rural settings within districts
Advanced vs. economically backward locations
Purchased energy vs. own-firm provision
Older vs. younger plants
Organized vs. unorganized sectors
While we may instinctively rank order some of these dimensions, the trends discussed above are
hard to add up. For example, we might often suspect urban settings reduce the cost of electricity
use per output level due to denser customer bases and more-efficient plant sizes for local energy
producers, but the largest plants in India are moving towards rural locations, often provisioning
some of their own energy, and building new plants in this process. We do not know how these
forces add up and whether these migrations are tending to increase or decrease overall energy
consumption.
5
The study begins by developing estimates of electricity consumption for the Indian manufacturing sector in multiple years from 1989 to 2010 using the information collected on the plant-level surveys included for the formal sector through the Annual Survey of Industries (ASI) and for the informal sector through the National Sample Survey Organisation (NSSO). The following survey years are included for both the sectors: 1989-90, 1994-95, 2000-01, and 2005- 06, while the year 2009-10 is included for ASI and the 67
thround of NSS spanning from 2010- 2011 is included for the unorganized sector.
Our baseline results suggest that that electricity consumption per unit of output in organized and unorganized urban plants has declined during 1989-2010. In the rural areas, by contrast, electricity consumption per unit of output for organized sector plants peaked in 2000 and thereafter it declined. These results broadly confirm the findings of Sengupta (2012) who compares four alternative scenarios of economic growth (8% growth vs. 6% growth) and energy prices (no increase vs. 3% increase) and argues that energy intensity in India will likely continue declining in the next two decades.
3This result comes out even stronger during periods of high economic growth and energy price increases.
4Beneath these aggregate figures lies much heterogeneity. We evaluate the differences in usage levels that exist between leading states in India and those that are economically less developed.
Our results suggest that the usage of electricity per unit output is remarkably high in states such as Madhya Pradesh and Orissa throughout the five surveys, in some cases twice the level of India as a whole. By contrast, states like Delhi and Haryana display electricity consumption levels that are consistently lower than the national average. We show more broadly a strong link of lower electricity consumption levels per unit of output in more developed states, although we discuss why the sorting of manufacturing plants over locations limits the strength of these conclusions.
3 Increased electricity costs in many developing countries are driving the declining trend in energy usage. See, for example, Fischer-Vanden et al. (2013) for the case of China and Prayas (2009) for the case of India. Abeberese (2013) contends that this may not necessarily be good for overall productivity of the sector because high electricity prices may force firms to switch to less technologically intensive products/production processes, which require less electricity for production but lowers their productivity.
4 For an analysis of the impact of electricity price on the efficiency of using electricity in a developed country like the United States, see Davis et al. (2008). Other papers that examine the determinants of electricity prices in developed country markets include Davis et al. (2013) and Joskow and Wolfram (2012).
6
We also specifically analyze the differences in electricity usage patterns that exist between various industries in India and those that are especially intensive in energy. World Bank and Government of India (2011) broadly classify the industrial sector as energy-intensive industries (e.g., iron and steel, fertilizer, petroleum refining, cement, aluminum, and pulp and paper) and light industries (e.g., food processing, textiles, wood products, printing and publishing, and metal processing). The energy-intensive industries account for a bulk of the energy consumed in the sector. Our results mirror the findings in several studies that industry has recorded greater energy efficiency improvement since the late 1980s (e.g., Roy, 2007; Sengupta, 2012). Many factors account for this trend, including greater competition following the liberalization of the economy in the early 1990s, rising energy prices starting in the late 1990s, and the promotion of energy efficiency schemes since the introduction of the Energy Conservation Act in 2001 (World Bank, 2013). Nonetheless, various industries are inefficient by either national or international standards. Gupta and Ramprasad (2012) find that there is substantial potential for energy saving in energy intensive industries, ranging, for example, from 46%-88% for textiles, 43%-94% for paper and pulp, to 51%-92% for iron and steel.
With the background of these baseline estimates and trends, we next use empirical decomposition techniques to assess the degree to which the various spatial transformations noted above have influenced the aggregate energy consumption of the sector. Following the productivity growth decomposition work of Baily et al. (1992), Griliches and Regev (1995), and Foster et al. (2001), we decompose the observed changes in the aggregate electricity consumption per unit output from 1989 to 2010 and from 2000 to 2010. Decomposing the observed trends in aggregate electricity usage from 2000 onwards, we find that most reductions in usage came from lower usage in existing sites of activity (defined through state-industry- urban/rural cells). The second biggest factor for promoting lower usage was the lower usage levels among fast-growing sectors. By contrast, spatial movements of manufacturing activity across India did not significantly reduce electricity consumption per unit of output and may have even increased it. This appears in part due to the split nature of the mobility, with organized and unorganized sectors migrating in opposite directions.
Given multiple challenges in India’s energy sector and limited resources, a better understanding
of the spatial patterns of energy usage can help in defining a focused and targeted energy policy.
7
For instance, our work suggests that organized sector is moving to rural regions and that most organized plants located in rural areas utilize self-generation of electricity at least in part.
Governments worldwide are focusing on the development of clean cities and efficient urban use.
5For India, our work suggests that effective policy may need to extend beyond urban regions and also consider the incentives and regulations that govern self-production of electricity.
It is important to also clarify from the outset a boundary of this project. We are attempting to trace out usage patterns, not establish efficiency levels. Usage is an important component of efficiency, and, all else being equal, using less electricity to achieve a given level of output is more efficient and positive. But, for many reasons, we should not label every increase in electricity cost per unit of output as a bad thing. In a context where electricity supply is often incomplete and uncertain, efficiency can involve increased usage levels as it unlocks better production techniques (e.g., uses less labor and greater mechanization). Throughout this paper, we discuss points about efficiency as we are able, and we hope to continue clarifying these two dimensions in future work.
While our paper is principally about the measurement of energy use within Indian manufacturing, we document some comparable figures for land and building usage. This work draws heavily on the Duranton et al. (2014) study of misallocation of land in India. India’s policy makers are frequently framing their thoughts in terms of which input to industrialization—e.g., land, energy, labor—is the biggest bottleneck for India’s advancement. While it is beyond the scope of the paper to conclusively answer this question, our comparison of land and energy indicates that land and building access is likely the more pressing constraint for India’s manufacturing than energy. This is most evident in plots of simple costs shares over time, and it holds in more rigorous frameworks too. This is not to downplay the importance of further progress in India’s energy sector, where we describe below ample room for improvements to world levels. But it does provide greater context for our work and encouragement in the energy trends evident, echoing the extensive review conducted by Pargal and Banerjee (2014).
6
5 For example, http://www.worldbank.org/en/news/feature/2014/07/03/urban-energy-efficiency-key-to-mexicos- ambitious-goals-for-energy-and-low-carbon-growth.
6 It is also important to emphasize the multi-faceted nature of energy challenges. Roughly 20% of the world’s population lack energy access, many of which are in India, and this in turn can have severe health consequences due to indoor pollution when using poor cooking materials. This widespread and worrisome energy poverty (e.g.,
8
The paper beyond this point is organized as follows: Section II discusses the related literature and provides additional background on India’s energy usage. Section III provides a background of the data used. Section IV devotes specific and lengthy attention to trends in electricity usage, and this discussion spends extra time on the imputation procedures for missing energy values that are important for creating time-consistent metrics. These data elements are an important output of this work and hopefully have applicability in other contexts. Section V provides our analytic work on India’s electricity usage in manufacturing, including the descriptions of the sector’s heterogeneity in usage levels and our decomposition exercises. Section VI provides comparisons against land and building usage. The final section concludes and discusses important areas for future research.
II. The Energy Sector in India
Access to reliable energy supply is fundamental for economic development (World Bank, 2010).
India is still home to about 350 million people who lack access to electricity, more than 25% of the worldwide total of 1.4 billion people without electricity. Although the current installed capacity of India’s power system is the fifth-largest system in the world after China, the United States, Japan, and Russia, it is nonetheless insufficient to meet India’s demand. The deficit continues to remain around 10% of energy (World Bank, 2013). Electricity consumption in India is only around 566 KWh per capita, compared to the world average of 2,782 KWh per capita.
Electricity shortages are frequent in India and are estimated to cost the country around 7% of GDP (World Bank, 2010). Heavy dependence on fossil fuels, low access to modern technology, and weak sector institutions and utility governance are crippling the energy sector as well as India’s growth.
7http://www.iea.org/newsroomandevents/news/2011/march/name,19787,en.html) sits alongside inefficient use within industrial firms. Improvements in the latter can aid the former household development goals.
7 Renewable energy makes up a negligible share (0.36%) of total primary commercial energy supply, while 96.9%
of such supplies come from fossil fuels and 2.76% from hydro and nuclear resources. The non-commercial combustible biomass and wastes which contributes to the extent of 24.5% of the total energy supplies are excluded in this balance (Sengupta, 2012).
9
There are problems at all levels of electricity provision in India, ranging from production, transmission, and distributional difficulties.
8Supply of electricity in India is highly unreliable, and outages and voltage fluctuations are frequent (Chakravorty et al., 2013). Since electricity is an essential input in production, it is thus natural that about 35% of plants in Indian manufacturing insure themselves against outages by self-generating or otherwise substituting away from grid electricity (Alcott et al., 2014; World Bank, 2013). The situation is similar in other developing countries where unreliable energy supply forces firms to invest in self- generation capacity at the expense of more productive capital, outsource part of the production process, or expand firm size (e.g., Alam, 2013; Alby et al., 2013; Fisher-Vanden et al., 2013;
Foster and Steinbuks, 2009; Reinikka and Svensson, 2002; Zuberi, 2012).
Captive generations, in most cases, are based on non-renewable sources such as coal (World Bank, 2013; Sengupta, 2012). Furthermore, India’s grid electricity system also remains 68%
based upon coal, and the addition of renewable generation capacity has only slightly accelerated over the past two decades for both grid and off-grid generation.
9In 1990, grid-interactive renewable energy capacity was 18 MW, a miniscule proportion of the total. In March 2013, it was 25,856 MW, growing to 12% of the total. In this context, the World Bank’s International Finance Corporation, in collaboration with other agencies, has launched Energy Service Companies, or ESCOs, to support smaller businesses throughout India to reduce their energy demands and costs. Implementations of such programs are essential to any urban development strategy. A major milestone was the Energy Conservation Act of 2011, which mandated building codes, standards, and labels for appliances, and the act stipulated industry norms. The results of our analysis should help initiate a discussion on the policy for spatial provision of energy- efficient infrastructure for enhancing the growth in Indian manufacturing. The strategy mainly applied so far by the energy sector in India focuses on universal coverage—new, large infrastructure investments that will connect every entity to the grid. Our analysis provides insights into how to achieve these universal goals and also more focused objectives.
The impact of electricity shortages and substitution towards self-generation on productivity and output growth is quantified in recent studies. For instance, World Bank (2006) investment
8 Other works that focus specifically on the efficiency of delivering electricity services in India include Ryan (2013), Cropper et al. (2011), Chan et al. (2014), and Pargal and Banerjee (2014).
9 Also see McKinsey & Company (2009).
10
climate assessment indicated a 7% loss in production or merchandise value due to power outages or surges from the public grid.
10Alcott et al. (2014) argue that shortages reduce average output by about 5%, but because most inputs can be stored during outages, productivity losses are much smaller. The result is different for plants without generators, who have much larger losses, and because of economies of scale in generator capacity, shortages more severely affect small plants.
Similarly, Hulten et al. (2006) find that about 50% of productivity growth in Indian manufacturing between 1972 and 1992 is attributable to the growth of roads and electric generation capacity. Khandker et al. (2012) and Rud (2012a,b) study the impact of rural electrification in India.
The organization of the energy sector also explains many of the problems with the sector. First, planning for electricity supply in India is managed centrally by the Planning Commission, but its implementation is split across different ministries. Second, subsidies, such as that on agriculture, introduce significant inefficiencies in the allocation of electricity.
11Third, there have been substantial losses in transmission and distribution, rising from 5% in 1997-1998 to 30% in 1999- 2000, vis-à-vis neighboring countries where such losses are close to 10% (Modi, 2005).
The Electricity Supply Act of 1948 marked the importance of electricity policy in post- independence India. This act established the Central Electricity Authority (CEA) as an advisory body on national power planning, policy making, and monitoring progress, and created state electricity boards (SEBs)—state-level vertically-integrated utilities responsible for power generation, transmission, and distribution, and for setting most tariffs. India’s power sector has seen extreme changes in the last few decades. A slew of policies and regulations followed the Electricity Act of 2003 to facilitate an accelerated growth in the sector. The process started with the restructuring of power distribution utilities, with some states corporatizing the functional entities for power generation, transmission, and distribution. The states of Orissa and Delhi went a step further by privatizing the distribution sector. Another important aspect is to provide clean and convenient “lifeline” energy, critical for the well-being of deprived. Meeting the energy
10 Similar results are found in Lall and Mengistae (2005) who use the World Bank’s investment climate survey data to argue that power shortages severely hold back productivity of Indian manufacturing firms.
11 More generally, fuel subsidies are common in India and amount to around 2% of GDP. While often motivated by a desire to help the poor, they can prove otherwise given the majority of fuel consumption by richer households (http://blog-imfdirect.imf.org/2013/06/24/for-richer-not-poorer-energy-subsidies-in-india/).
11
challenge is of fundamental importance to India’s economic growth imperatives and its efforts to raise its level of human development. Within all of this, policy makers must balance important objectives like limiting pollution and environmental degradation with the expansion of energy resources to producers and consumers.
12Economic growth often drives energy consumption in many developing countries, but there is variation. Within the South Asian region, annual data for Pakistan during the period 1960-2008 connects growth in output in commercial, manufacturing, and agricultural sectors to increased electricity consumption (Jamil and Ahmad, 2010; Asghar, 2008). Similar are the cases of Sri Lanka and Bangladesh, where growth has given way to larger electricity consumption and total energy consumption (Asghar, 2008). For India, however, Asghar (2008) does not find a causal connection between growth and energy consumption at an aggregate level. To the extent that this difference from India’s neighbors is confirmed, interpretations remain tricky (e.g., growth of consumption could be constrained by a weaker ability to expand supply).
In general, energy consumption has been critical for paving the way for economic growth and especially so for high-income countries (Chontanawat et al., 2006; Borozan, 2013). Recent evidence, however, suggests the existence of a unidirectional causality running from electricity consumption to economic growth in the case of developing countries like Bangladesh (Masuduzzaman, 2013), Brazil (Pao and Fu, 2013) and Cameroon (Fondja Wandji, 2013) . In cases where there have been no association or causality from energy consumption to economic growth, some observers of the industry attribute it to a lack of efficient planning and increased investment in electricity infrastructure development (see Akpan and Akpan, 2012, for the case of Nigeria), as highlighted above. In sharp contrast is the case of China, where Zhang and Yang (2013) find the existence of a negative bi-directional Granger causality running from aggregated energy consumption to real GDP. They propose that this negative relationship might be attributed to the growing economy production shifting towards less-energy-intensive sectors and excessive energy consumption in relatively unproductive sectors. For the specific case of India, the disaggregated causality analysis in Abbas and Choudhury (2013) suggests a bi-directional causality between the agricultural electricity consumption and the agricultural GDP in India.
12 World Bank (2013) provides a detailed timeline of energy policy and major legislation for India. Gillingham et al.
(2009) provide a comprehensive conceptual background on energy efficiency considerations in policy.
12
Overall, such country-specific results suggest that energy and environmental policies should recognize the differences in the energy consumption-growth nexus in order to maintain sustainable economic growth in a given country.
Our study contributes to the literature through its particular focus on the intersection of economic geography and electricity usage patterns. Beibei et al. (2010) consider China’s spatial patterns of energy production, but this type of work is in general quite rare. Our analyses and decompositions provide novel insight on how patterns of regional development impact aggregate electricity usage, which is often lost in macro-level tests. Second, by building up from plant-level surveys, we provide a foundation for understanding and evaluating the heterogeneity that exists below the aggregate figures. These contributions help policy makers consider the energy usage consequences of other policies that they may wish to pursue, which is key for avoiding or at least mitigating unintended consequences of otherwise well-motivated policy choices.
III. Data Description
Data Sources
This project draws upon five surveys from two major sources of data: the Annual Survey of Industries (ASI) and National Sample Survey Organization (NSSO). ASI is a survey of the organized sector undertaken annually by the Central Statistical Organization (CSO), a department in the Ministry of Statistics and Program Implementation, Government of India.
Under the Indian Factory Act of 1948, all establishments employing more than 20 workers without using power or 10 employees using power are required to be registered with the Chief Inspector of Factories in each state. This register is used as the sampling frame for the ASI. The ASI extends to the entire country, except the states of Arunachal Pradesh, Mizoram, and Sikkim and Union Territory (UT) of Lakshadweep.
The sampling design followed in in most ASI surveys is a stratified circular systematic one. All factories in the updated frame (universe) are divided into two sectors: Census and Sample.
Census Sector are comprised of industrial units that belong to the six states/UTs that are less
13
industrially developed: Manipur, Meghalaya, Nagaland, Tripura, Sikkim, and Andaman &
Nicobar (A&N) Islands. For the rest of the states/UTs, the Census Sector includes (i) units having 100 or more workers and (ii) all factories covered under Joint Returns. All other units belonging to the strata (state x four-digit industry of the NIC-04 framework) having four or fewer units are also considered as Census Sector units. Finally, the remaining units, excluding those of Census Sector, called the Sample Sector, are arranged in order of their number of workers and samples are then drawn circular systematically considering a sampling fraction of 20% within each stratum (state x sector x four-digit industry) for all states. An even number of units with a minimum of four are selected and evenly distributed in two sub-samples.
ASI is the principal source of industrial statistics for the formal manufacturing sector in India. It provides statistical information to assess changes in the growth, composition, and structure of organized manufacturing sector comprising activities related to manufacturing processes, repair services, gas and water supply, and cold storage. As noted in Ghani et al. (2012), organized manufacturing contributes the substantial majority of India’s manufacturing output, while the unorganized sector accounts for the substantial majority of employment for Indian manufacturing workers.
Manufacturing activity undertaken in the informal sector, such as households (own-account manufacturing enterprise, OAME) and unregistered workshops, is covered by the NSSO.
Following the first Economic Census 1977, small establishments and enterprises not employing any hired worker (that is, OAME) engaged in manufacturing and repairing activities were surveyed on sample basis in the 33
rdround of NSSO during 1978-79. Subsequent surveys covering OAEs and Non-Directory Manufacturing Establishments (NDME) were conducted in the 40
thand 45
throunds of NSSO during 1984-85 and 1989-90, respectively. In 1994-95, a first integrated survey on unorganized manufacturing and repairing enterprises covering OAMEs, NDMEs, and DMEs was undertaken during the 51
stround of NSSO. Subsequently, surveys of manufacturing enterprises in the unorganized sector were conducted in the 56
th(2000-01), 62
nd(2005-06), and 67
th(2010-11) rounds.
13
13 Thus surveys on unorganized manufacturing enterprises usually covered: (a) manufacturing enterprises not registered under Sections 2m(i) and 2m(ii) of the Factories Act, 1948; (b) manufacturing enterprises registered under Section 85 of Factories Act, 1948; (c) non-ASI enterprises engaged in cotton ginning, cleaning, and baling
14
As for the sample design in the unorganized sector, a stratified multi-stage design has been adopted. The first stage units (FSU) are the census villages in the rural sector and Urban Frame Survey (UFS) blocks in the urban sector. The ultimate stage units are enterprises in both sectors.
In case of large FSUs, one intermediate stage of sampling is the selection of three hamlet- groups/sub-blocks from each large rural/urban FSU. Two frames were used (as per the 62
ndround survey): List frame and Area frame. List frame was used only for urban sector and that too for selection of manufacturing enterprises only. For unorganized manufacturing enterprises, a list of about 8000 big non-ASI manufacturing units in the urban sector, prepared on the basis of the data of the census of manufacturing enterprises conducted by Development Commissioners of Small Scale Industries in 2003, was used as list frame for surveys in 2005-06 and 2010-11. Area frame was adopted for both rural and urban sectors. The list of villages as per census 2001 was used as the frame for the rural sector, and the latest available list of UFS blocks was used as frame in the urban sector. The relevant year’s economic census was used as frame for the towns with population 10 lakhs or more (as per Census 2001).
The survey years from both formal and informal sectors that are included in our study are: 1989- 90, 1994-95, 2000-01, 2005-06, and additionally 2009-10 from the ASI for the formal sector is studied while 2010-11 from NSSO for the informal sector is also incorporated. For sake of simplicity, we normally refer to the sample year by the starting year—for instance, the sample survey in the year 2005-06 is referred to as the 2005 survey. We likewise use 2010 in the tables and text to refer to the years 2009-10 for ASI data and years 2010-11 for NSSO data. As depicted above, the NSSO data provide the maximum possible coverage in terms of included years for the unorganized sector. Our development procedures below will seek to address changes in internal organization of surveys as well to the extent they exist.
(NIC-2004, code 01405); and (d) non-ASI enterprises manufacturing bidi and cigar (those registered under bidi and cigar workers (condition of employment) Act, 1966, as well as those un-registered). Some of the surveys (such as 2010-11) covered trading enterprises and services establishment, but we exclude them for the purposes of our paper.
Additionally, the NSSO excluded: (a) repairing enterprises not falling under Section ‘D’ of NIC-2004; (b) departmental units such as railway workshops, RTC workshops, government mint, sanitary, water supply, gas, storage, etc. in line with ASI coverage; (c) units covered under ASI; and (d) public sector units.
15 Information on Energy Consumption
Both ASI and NSSO provide information on energy consumption by establishment. In the organized sector, several sections relate to information on energy consumption. A section on
“Fuels, electricity and water consumed” in the 1989 and 1994 ASI surveys asks establishments to report separately their consumption of (in quantity and value terms) for each of the following:
coal, lignite, liquefied petroleum gas, coal gas, natural gas, petrol, diesel, furnace oil, other fuel oil, firewood including charcoal, biomass, electricity, lubricating oil, and water. In these survey years, there is also a separate section in the survey on the quantity of electricity generated, purchased, consumed, and sold. Finally, in the output and receipt section, the value of electricity sold is also recorded.
In the year 2000, the ASI survey remained as detailed with respect to registering the consumption of various energy sources as the 1989 and 1994 surveys. In fact, items related to energy consumption were repeated in the “Input items (indigenous items consumed)” section of the survey. In this section, specific questions were asked on the consumption of the following energy items: electricity own generated (quantity); electricity purchased and consumed (value and quantity); petrol, diesel, oil, and lubricants (value); coal (value and quantity); and other fuels (value). In the year 2000 and the following survey years, however, the separate section on the quantity of electricity generated, purchased, consumed, and sold was dropped.
In the following surveys considered for our work, that is, 2005 and 2010, the ASI questionnaire is not as disaggregate with respect to the consumption from various sources of energy. The section on “Fuels, electricity and water consumed” was dropped and the “Input items (indigenous items consumed)” section became the single most important source for an establishment’s energy consumption and evaluation. See Appendix Table 1 for the exact wording and details of the questions pertaining to energy consumption in the ASI surveys considered for our study.
The NSSO survey of the informal sector is coarser than the survey used in the formal sector. In
the earlier years, such as 1989, the survey was slightly more disaggregated and respondents were
asked specific consumption details of coal/coke, lubricants, electricity, and other fuels. However,
in 1994 and in the following surveys, the establishments are asked to only separately provide the
16
expense on electricity and fuels. There is no question pertaining to the quantity of these energy sources consumed and neither is there any further disaggregation on the sources of fuels consumed by the establishment. In addition to this, starting from the year 2000, there is binary information available for each establishment as to whether non-availability of electricity connection and/or power-cuts was one of the problems faced by the establishment during the reference year. Finally, in the latest 2010 NSSO survey of informal establishments, there is a separate question on the fuel consumed by accommodation and food service activities. Appendix Table 2 provides the exact wording and details of questions pertaining to energy consumption in NSSO surveys, and Appendix Table 3 contrasts sizes of the sectors by industry.
The outcome of this data coverage can be summarized as follows. First, there is a consistent path to considering electricity usage across years for both unorganized and organized sectors. As such, we focus exclusively on this component of energy usage in this report, and we describe next the many steps undertaken to bring together the related questions and effectively utilize the contained information. In theory, one could also consider fuels in a similar manner over the 1989-2010 period. Although the collected information is somewhat weaker and there exists more variance in the underlying questions, analyses of these data would be a useful exercise for future research. Likewise, while not uniformly possible for the full sample period, a separation of prices and quantities for electricity could be conducted. Finally, and somewhat unfortunately, the most detailed energy data are collected for the period before 2000, and thus the most detailed studies would need to rely only on the first half of our sample period. We have chosen a data development route focused on electricity to maximize the duration studies and consistency across sectors.
Data Preparation and Observation Counts
After reading the raw data from the surveys, we have 262,911 ASI observations and 955,234
NSSO observations. For the ASI, we retain only establishments indicating that they are open and
operational, leaving 216,898 observations in the formal sector. Next, we drop observations for
establishments outside of the manufacturing sector. Such industries may relate to mining and
quarrying, fishing and aquaculture, or services sectors as depicted above. This yields 203,031
17
ASI observations and 655,571 NSSO observations. Finally, we drop observations with any of the following properties: (a) null, missing, negative, or extremely large values of output, output per worker, or employment
14, (b) NSSO observations from states that are not surveyed by ASI, and (c) observations missing state indicators. These drops results in a final sample of 169,814 ASI observations and 651,808 NSSO observations. A detailed table of these cleaning procedures and sample composition consequences is available from the authors upon request.
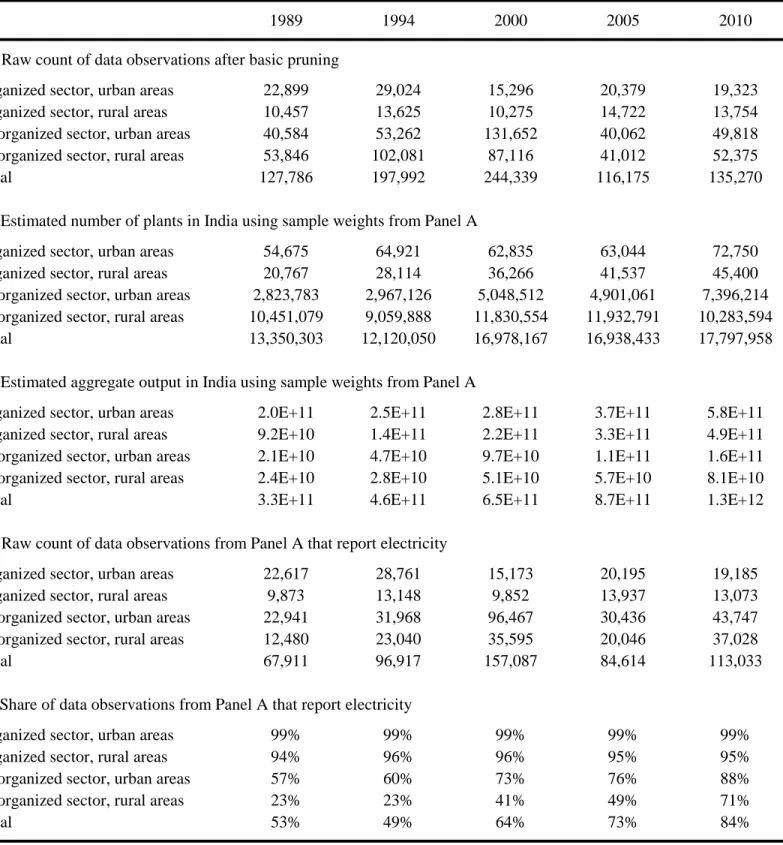
Cutting the observations across rural and urban locations, we present the count of plants in each year, sector, and location in Panel A of Table 1. The observation counts are fairly similar over surveys for the organized sector, with a dip in 2000. The unorganized sector has significantly more data collected in 1994 and 2000 than in other years. Aggregating over all five surveys, 63%
of our data observations for the organized sector come from urban locations, while 48% of the unorganized sector plants studied in our sample come from an urban location.
In Panel B, we apply sample weights to the plants surveyed by ASI and NSSO surveys. This panel reiterates and extends India’s urbanization story noted in Ghani et al. (2012)—over time, the organized sector in India is migrating to rural locations with the share of urban plants falling from 72% to 62% from 1989 to 2010.
15In contrast, the unorganized sector is urbanizing, with the share of urban plants increasing from 21% to 42% during the same period. These sample weights also identify clear trends in the growth of each sector and demonstrate the much larger underlying plant count in the unorganized sector.
Panel C of Table 1 presents the output by sector and location for each of the years considered in our sample. These numbers suggest a compound annual growth rate in output of 5% from 1989- 2010 for plants in the organized sector located in urban regions, vis-à-vis 8% growth rate for their rural counterparts. In contrast, in the unorganized sector, we note an average 10% per annum growth during 1989-2010 in output in the urban locations relative to 6% growth in rural regions. The diverging trends noted in plant counts with respect to urbanization are also present in output, with the urban output share for the formal sector declining from 68% to 54% during 1989 to 2011, while the corresponding figure for the informal sector rises from 46% to 66%.
14 Maximums thresholds for a plant are US$ 1 billion in output, US$ 1 million in output/worker, and 500,000 employees.
15 Ghani et al. (2012) also describe in greater detail the urban/rural classifications the India employs.
18
These figures also emphasize the earlier point about the organized sector’s disproportionate share of output levels. Appendix Table 4 contains complete tabulations in these regards.
IV. Calculations of Electricity Usage Trends
Basic Data Steps Prior to Imputation
For the formal sector, the electricity consumption of an establishment is calculated as the value of the electricity purchased plus the value of electricity generated minus the value of the electricity sold. We do not observe the value of the electricity generated in all years, only the quantity. Nonetheless we have both the quantity and the value of electricity purchased in all survey years. Summing across the value and quantity of electricity purchased for a given year and district by reporting plants, we deduce the local price of electricity as: sum of value of electricity purchased / sum of quantity of electricity purchased. The value of electricity generated is then calculated as: local price x quantity of electricity generated. In cases where electricity price cannot be inferred at a district-year level, state-year prices are used. Additionally, for some plants, we observe the quantity of electricity purchased but not the value of their expense on electricity purchased from outside sources. We use the same average electricity price as deduced above to assign the value of electricity expense.
For the informal sector, the question on electricity expense is directly asked in the survey questionnaire. Plants in the unorganized sector are too small to generate their own electricity.
Thus, naturally, there is no question on the value or quantity of electricity generated or sold.
After obtaining observation counts noted in Panel A of Table 1, we note that not all
establishments report a non-zero electricity expense. Panel D of Table 1 reports the observation
count of plants that report a non-zero electricity expense, and Panel E calculates the percentage
of reporting plants by sector, location, and year. These panels suggest that 99% of urban
organized plants and about 95% of rural organized plants report a non-zero value of electricity
expense. This is, however, not the case in the unorganized sector and especially so in the rural
areas. In the years 1989 and 1994, about 60% of the informal urban and 23% of informal rural
19
plants reported a non-zero value of electricity expense. Although non-zero reporting among plants in the informal sector dramatically increased by the 67
thround of NSS survey, the shares remained below 75% in rural regions and 90% in urban regions.
In the case where plants do not report a non-zero electricity expense, it could be true that the establishment does not use electricity. However, missing values of electricity expense in our data are observationally equivalent to assigned zero values. This creates important challenges for calculating consistent trends given that the surveys vary in size across years and the introduced or dropped plant observations are unlikely to be random in this process. For example, the average energy values for the NSSO data are likely to be biased by the doubling of the rural sector sample size in 1989-1994.
As one approach to learning about this issue, we explored in the ASI and NSSO data the degree to which the data strictly adhered to the definitional requirement that the ASI include all plants with (a) 10 or more employees if they use electricity and (b) 20 or more employees if they do not use electricity. In tabulations available from the authors, we found this definition did not hold well, with many deviations evident (e.g., ASI plants with 15 employees that are not reporting electricity, NSSO plants with 15 employees that are reporting electricity). The conclusion from this exercise was that we could not use a single approach to the zero values or missing values, but that we would need to consider several reasonable alternatives to learn if a consistent pattern emerged that was robust to these considerations.
Raw Electricity Consumption Rates
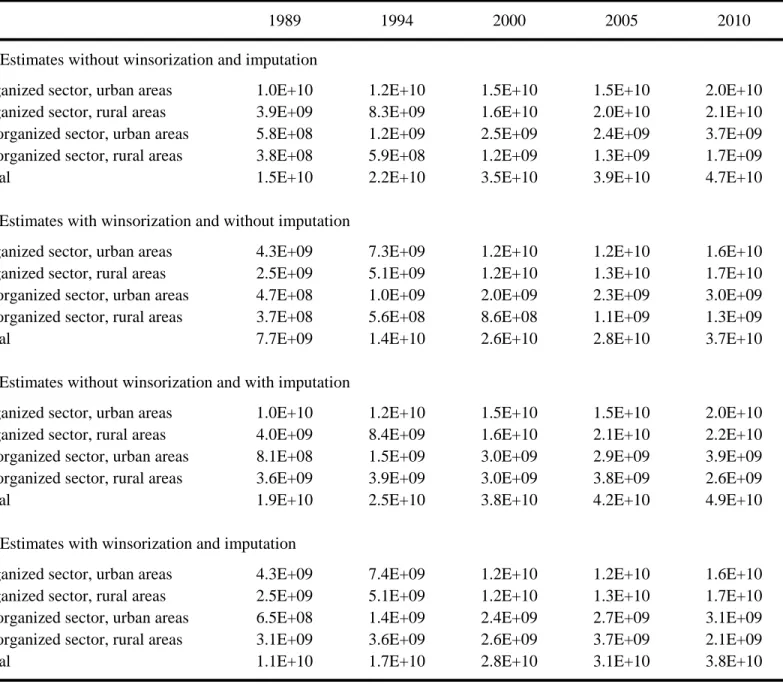
Table 2a presents the raw electricity usage per plant observed in the data. Panel A presents the raw averages for reporting plants using sample weights, Panel B imposes a 1% winsorization to cap extreme values, and Panel C presents unweighted median values. Panels D and E repeats Panels A and B in an unweighted format. We report these last two panels for completeness but do not believe their trends are very informative given the sample changes over time and surveys.
Plants in the organized sector, not surprisingly, consume substantially larger amounts of
electricity than reporting unorganized sector plants (even among plants with non-zero reported
20
consumption). These differentials in levels are often 500x or greater, although they shrink some with median values reflective of the very large consumers in the organized sector.
More novel, is that the average electricity consumption is larger among formal plants in rural regions than in urban regions. This deviation is growing over time and is opposite of the pattern observed in the unorganized sector. With one-third of rural India lacking access to electricity, a large share of this electricity is self-generated. For instance, 36% of the plants generating electricity are located in rural areas and were responsible for 61% of total electricity generated by the organized sector in 2010. These basic findings are true independent of the approaches taken in Panels A-E.
Assignment or Imputation of Missing Electricity Expense Values
Given the large presence of missing values in the informal sector and especially in rural locations, we are mindful that small plants may not have necessarily have access to electricity.
Thus, we follow a two-pronged approach for dealing with missing values.
In the first approach, we assign a value of US $0.1 to all values on electricity consumption that are either missing or are below US $0.1. In Table 2b, we repeat the descriptives from Table 2a after imposing this minimal value of electricity consumption. As would be expected, the averages in both the sectors are lower relative to that in Table 2a. This is especially true for plants in the unorganized sector located in rural areas. Nevertheless, the basic patterns highlighted previously are still evident.
A second, and perhaps more formal, approach for addressing missing values is to impute the expected consumption based upon the observed consumption of reporting plants and the similarities of underlying traits in plants that do not report electricity consumption. To do this, we use the following regression methodology:
(i) We regress reported electricity expense on the following plant traits: a dummy
variable for the plant being in an urban location; total plant output and its squared
value; total plant employees and its squared value; months of operation; and a dummy
21
variable for the plant being less than four years old. The variables predict plant usage based upon plant activity itself. As local conditions may also be important, we model district level traits: median manufacturing wage (weighted by employment); percent of plants in a district that are located in urban sites; population density; percent of villages in a district with telecom, power supply, paved roads, and safe water access (separate variables); distance of the district centroid to the closest of the largest three cities of India; percent of households with telecom; percent of villages with electricity available for agricultural use; percent of villages with electricity available for domestic use; and percent of households with electricity access in a district. These traits correspond to the year 2000, which is the mid-point of our sample. Most of these variables are taken from the 2001 Census survey, except for the median wage and urban plant shares that are constructed directly from the ASI and NSSO surveys.
(ii) The imputation regression is run separately for each “cell” composed of sector (informal vs. formal), year (1989, 1994, 2000, 2005, 2010), industry (two-digit NIC codes, 15-36), and states (30 different states). Due to the localized nature of the regressions, the reported results use unweighted imputation regressions, and we have separately confirmed alternative approaches using sample weights for regressions.
(iii) Missing or zero-valued electricity expenses are replaced with the predicted values based upon their traits and the appropriate regression coefficients for their given sector, industry, year and state. However, in some cases, only a few establishments are sampled in a given cell, due to both small local representation and/or sampling procedures noted above. If the reporting number of establishments for a given cell is below 20 in any year, we instead run the imputation procedure at the national level using sector, industry, and year data. This alternative calculation is applied in every year for a given cell to ensure a consistent approach, even if the establishment count described above is only below 20 reporting plants for one or two survey years.
(iv) Since predicted values can be negative, we note the occurrence of negative values in predicted electricity expense. We replace any value of electricity expense below US
$0.1, either in predicted or in raw data, by US $0.1.
22
Table 3 provides an illustration of the imputation regression. In this version, we simply run a regression of reported raw electricity expense by plant on the set of covariates included in our imputation analysis. Instead of doing this cell by cell, we aggregate the data for illustration and include year, industry, state, and sector fixed effects. (We later show values from these fixed effects when describing state and industry heterogeneity.) In this format, we generally prefer the weighted estimations given the combination of observations over many different sectors and years, but Column 2 shows similar patterns when using sample weights in the imputation regression.
Table 3 shows that plants in rural areas, those with larger output levels, those more distant from nearest big city, and those operating a greater number of months in the year consume higher levels of electricity. Plant output is by far the strongest predictor, with every US $100 of increase in output corresponding to US $5 increase in electricity usage. Perhaps more surprising, younger plants show greater usage conditional on output levels. This may reflect that newer plants have been equipped to use more electricity than older plants in their production processes or that younger plants are using newer technologies that require higher electricity usage. But, we cannot rule out alternative explanations (e.g., the plant is charging a lower price for its output as it builds customer demand, which artificially raises the consumption ratio from true technical efficiency).
16Interestingly, the reported plant level traits dominate predicted energy usage, with all local covariates being not statistically associated with usage levels in multivariate analysis.
Plants showing the above traits are more likely assigned a positive and high value of electricity expense if the value is found to be missing.
From an economic geography perspective, three outcomes embedded in these regressions are important to highlight. First, plants in urban areas generally use less electricity conditional on the many covariates modeled. Second, greater distance from larger cities is generally associated with higher electricity usage per output level. Third, the coefficient on population density is not predictive, suggesting in part that intermediate cities may not be behaving differently with respect to energy usage once urbanization and spatial positioning are accounted for.
16 Anecdotally, many informal businesses use older and second-hand machinery that can be energy intensive for its level of output. Our data do not allow direct assessment of capital vintages.
23
Table 4 repeats the statistics outlined in Table 2a after we use the imputation steps. The difference between these statistics and those presented in Tables 2a is minimal for the organized sector, given that a large proportion of plants in the formal sector already report a non-zero electricity expense. Even in the unorganized sector, where reporting a non-zero electricity expense is uncommon in rural regions, the differences in averages are modest, ranging from as low as -1.6% (indicating lower average consumption value post-imputation) to -31%. These modest deviations are in contrast to the first approach where we applied a floor of US $0.1 to all missing or lower than US $0.1 values on electricity expense. The imputation approach scales the reported values to match the traits for non-reporting plants, and thus its impact on the statistics is substantially smaller than inferring zeros for missing values.
Basic Trends in Electricity Usage Levels
Table 5a presents the total electricity consumption by plants using the four alternatives now possible for our data: (a) no imputation, no winsorization in Panel A; (b) no imputation, winsorization in Panel B; (c) imputation, no winsorization in Panel C; and (d) imputation, winsorization in Panel D. In all these panels, it is evident that the electricity consumption among plants in the organized sector located in rural areas has overtaken the usage in its rural counterparts, while the opposite is true in the informal sector.
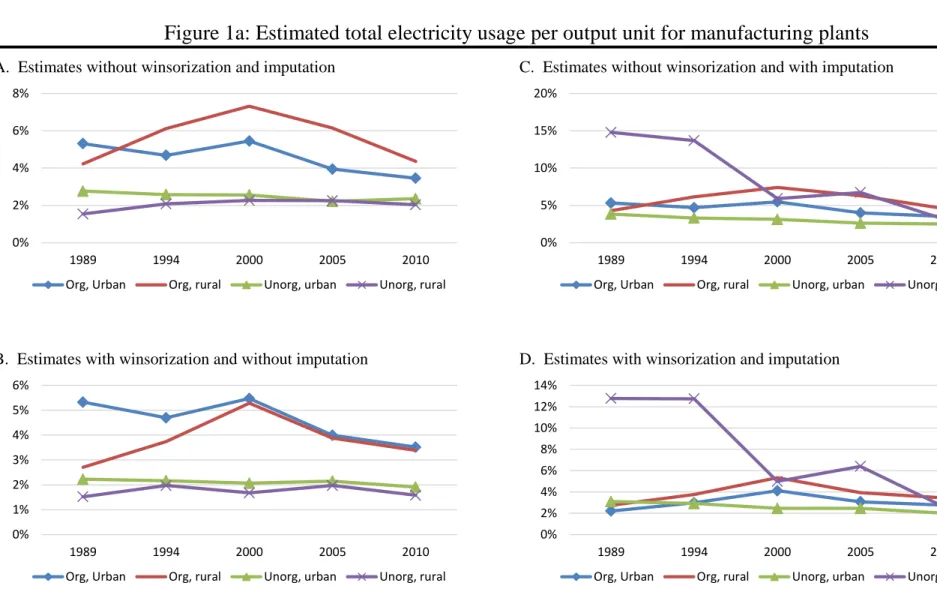
Table 5b and Figures 1a and 1b present the trends in electricity consumption per unit of output by sector and rural and urban locations. We present separate trends for each alternative.
Electricity consumption per unit output in the organized urban plants has declined from over 5%
to below 3% during 1989-2010, when considering base or imputed data. In the rural areas,
electricity consumption per unit output peaked in 2000 and thereafter it declined. By contrast, the
unorganized plants in urban areas show a linear declining trend in electricity usage since 1989,
while their rural counterparts show a declining trend only if we consider the data with
imputations. In all the sectors and locations, the trend from base and imputed values go hand in
hand, except in the informal sector plants located in rural regions, where a large percentage of
plants do not report electricity expense.
24 V. Analysis of Electricity Usage Patterns
State and Industry Heterogeneity
Table 6a presents the trends in electricity consumption per unit of output by states. Of the 28 states considered in our sample, the usage of electricity per unit output is remarkably high in some states throughout the five surveys (e.g., Madhya Pradesh, Orissa). In some of the years, the consumption per unit output is in double digits and often twice the national average ratio. By contrast, in states like Delhi and Haryana, electricity consumption per unit of output remains consistently below the national average ratio. Table 6b provides the underlying count of plants by state for reference. The table then documents the fixed effects from the weighted imputation regression in Column 1 of Table 3.
Figure 2a displays the underlying district heterogeneity in average consumption values.
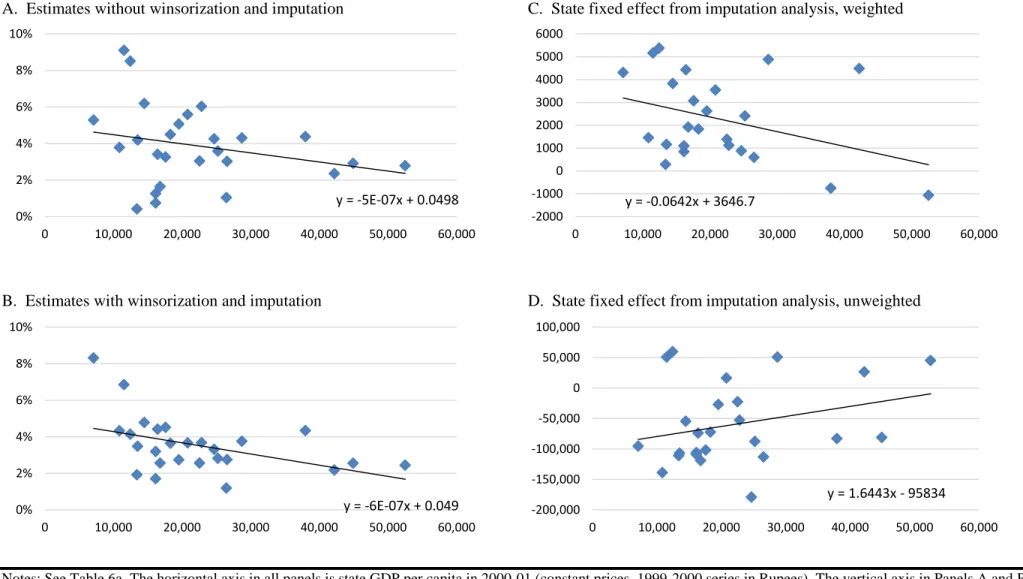
17The regional differences from Table 6a are reflected at the district level, with regional patterns being especially prominent in the unorganized sector (the bottom two panels). In the organized sector, the local heterogeneity within states is as large as the heterogeneity across states in the top two panels. More formally, state-level differences account for 5%-6% and 22%-56% of the district- level variations in average usage levels for the organized and unorganized sectors in Figure 2a, respectively. Figure 2b shows similar patterns when displaying changes in electricity consumption levels. State-level differences account for 2% and 9%-15% of the change variations for the organized and unorganized sectors in Figure 2b, respectively.
Figure 3 shows that long-term usage levels are linked to state development. The horizontal axis in all four panels is state GDP per capita in 2000-01 (constant prices, 1999-2000 series in Rupees). The vertical axis in Panels A and B is average electricity usage divided by output levels. Panel A provides values without winsorization and imputation, while Panel B imposes both. Exact values for each data point are included in Tables 6a and 6b. With either data
17 Figures 2a and 2b are currently suppressed due to legal issues within the World Bank regarding borders.
25
approach, there is a clear negative relationship, with electricity consumption per unit of output being lower in leading states.
The first two panels do not control for any differences across states in terms of their industrial base, the level of informality among manufacturers, the traits of plants, or similar. Panels C and D consider the relationships after these differences are removed. In Panel C, the vertical axis is the state fixed effect value, measured relative to Andaman and Nicobar (A&N) Islands, from the imputation regression using sample weights utilized. This pattern again finds lower conditional electricity usage in leading states. For completeness, Panel D shows the pattern that excludes sample weights from the imputation exercise. We do not observe the relationship here and the slope is positive, although we again note that we are skeptical of the illustrative imputation regression that does not include weights.
With either of the techniques shown in Table 6a, there has been a substantial convergence across states in terms of electricity usage per unit of output. As one calculation, the correlation between state-level changes in consumption from 1989 to 2010 and the initial consumption levels of states in 1989 is -0.65 when using the data without winsorization and imputation. The correlation is -0.54 when using winsorized and imputed data. Similar correlations are observed when looking at the declines from 1989-1994 to 2005-2010 to remove aberrant values. The variance in the underlying distributions has likewise declined about 50% during the sample period. Initial differences across states in electricity consumption per output unit are rapidly declining.
To summarize, we observe substantial heterogeneity across states in terms of electricity usage.
Usage levels are consistently lower in leading states, and over time convergence in usage levels
appears to be happening for India. We must stress that one should be very cautious in the
interpretation of these patterns. For example, observation of higher electricity consumption per
output unit for a given state may indicate inefficient usage. However, it could also indicate
greater available supply of energy in the local area or the sorting of plants that need electricity to
places where the electricity can be readily provided. Our analyses (especially the conditional
regressions) tend to suggest that the latter scenarios are not very likely, but we do not make
definitive statements in this regard.
26
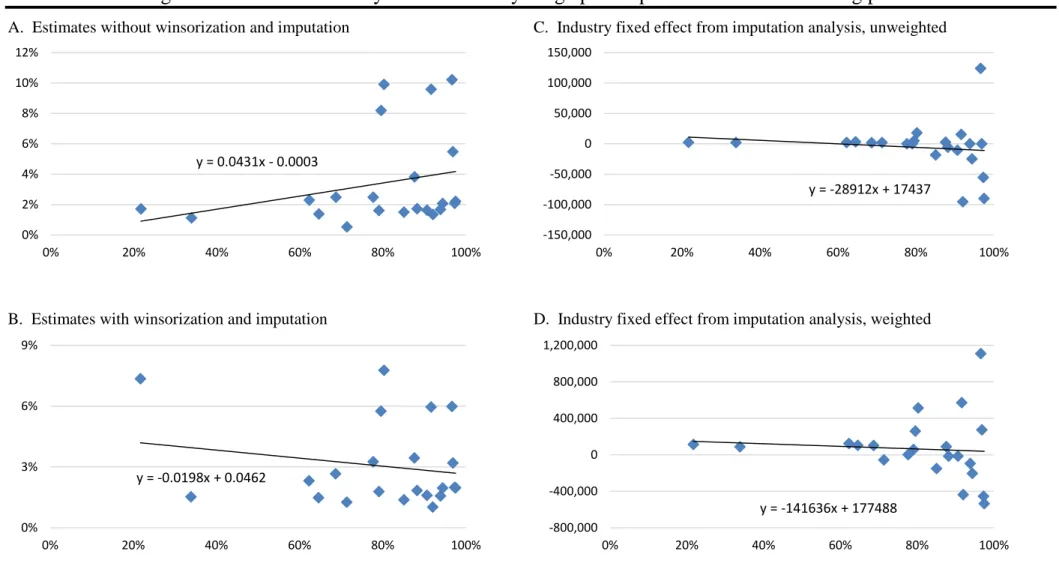
Tables 7a and 7b repeat this set-up for industry heterogeneity. Of the 21 industries at the two- digit NIC level, textiles, paper and paper products, basic metals, and non-metallic mineral products display the largest consumption per unit output. At the other end of the spectrum are tobacco products and office, accounting and computing machinery, which have low usage of electricity per unit output.
Differences in usage levels partly reflect the nature of industrial production processes and chosen scale that makes some industries generally more electricity intensive than others. With respect to scale however, Figure 4 shows that the usage levels are not closely linked to the degree to which the output level of the industry is concentrated in the formal sector. Also, we generally observe again a convergence over time in usage levels across industries. In fact, the convergence correlations at the industry level are as high as they are at the state level (-0.78, -0.57). This is as much through growth in consumption levels for some industries (e.g., office, accounting and computing machinery) than declines in other industries (e.g., textiles).
Tables 7c and 7d present industry-level differences in electricity usage for establishments in urban and rural areas. Establishments in rural areas generally consume more electricity per unit of output, but there is substantial heterogeneity across industries. Most important, the heaviest- using industries (e.g., basic metals, paper and paper products) tend to have the largest deviations between rural and urban usage rates. If one forms an industry-level ratio of rural-to-urban usage levels, such that higher values indicate relatively larger rural usage, the correlation to average electricity consumption levels in the industry is about 0.5. This pattern would align with anecdotes of larger plants moving to rural areas, building their own generation facilities, and potentially taking advantage of weaker regulations regarding production and pollution.
Decompositions of Electricity Usage Trends