ORIGINAL RESEARCH
Gender Differences in Active Ageing: Findings from a New Individual‑Level Index for European Countries
David Steinmayr1 · Doris Weichselbaumer1 · Rudolf Winter‑Ebmer1
Accepted: 12 May 2020
© The Author(s) 2020
Abstract
We use data from wave 6 of the Survey of Health, Ageing and Retirement in Europe (SHARE) to construct an individual-level index of active ageing for people aged between 50 and 90 years. We develop nine sub-indices for different dimensions, which are then aggregated to the final index. This individual-level index allows to analyze inequalities between age cohorts, dimensions, countries, and other individual-characteristics that are covered by SHARE. We focus on differences between the sexes. Overall women score lower than men with 54.9 index-points compared to 57.7 for men. We present gender dif- ferences in active ageing for some sub-populations as a showcase for this new individual- level index.
Keywords
Active ageing index · Individual index · SHARE
1 Introduction and Motivation
Since 1960, life expectancy at birth in developed countries has gone up from 68 years to about 80 years. Apart from the decline in infant mortality, the cause for this remarkable rise in life expectancy was a continued fall of mortality rates at late old age in many coun- tries thanks to medical innovations. Longer lives pose challenges to policy makers as well as researchers as how to enable active and healthy ageing. The concept of “active ageing”
emerged in the 1990s and has the goal to allow people “growing older in good health and as a full member of society, feeling more fulfilled in [their] jobs and social engagements, more independent in [their] daily lives and more engaged as citizens” (Zaidi and Stanton
2015). The WHO defines “active ageing” as the “process of optimizing opportunities forhealth, participation and security in order to enhance quality of life as people age” (p. 12 World Health Organization 2002). The term “active” captures all kind of activities that include participation in the labour market, as well as participation in society, economic, cultural, spiritual and civic affairs.
The concept of active ageing is often used as the theoretical foundation for a policy framework that aims at improving the well-being of older people. However, Paz et al.
* Rudolf Winter-Ebmer rudolf.winterebmer@jku.at
1 Johannes Kepler University of Linz, 4040 Linz, Austria
(2017) point out that active ageing policies are often “gender blind” and do not address the different challenges men and women face in their old age. This is problematic, because
“social, cultural, economic, and professional aspects in the course of life affect them in a diverse manner and into their old age” (p. 1 Paz et al. 2017). Over the past years much research focused on how ageing was experienced differently by women and men, not only in terms of life expectancy (Leon 2011; Rochelle et al. 2015), but also in social, health and professional dimensions (Corsi et al. 2010; Foster and Walker 2013). In consequence, in 2009, the Council of the European Union adopted conclusions on Equal opportunities for
women and men: active and dignified ageing. These conclusions emphasized that womenface a higher risk of poverty in old age compared to men due to several reasons such as career breaks, part-time employment and the gender wage gap. Apart from low pensions a low income when young can also have negative effects in other dimensions, like health, housing, and social inclusion in the old age. Therefore, the Council advocated that “healthy and dignified ageing must involve a gender dimension, taking into account the specific needs of both women and men” (p. 8 Corsi et al. 2010).
In this paper, we want to examine differences in active ageing between men and women in selected European countries. For this, we introduce a new individual-level index on active ageing, which allows examining existing gender differences in the social and eco- nomic status of older men and women. This index is based on data from the Survey of Health, Aging and Retirement in Europe (SHARE), which is a cross-national panel data- base of micro data on health, socio-economic status and social and family networks. The concept of active ageing serves as the theoretical basis on which we build this index.
Most existing indices on gender equality and/or active ageing work with aggregated data that reflect characteristics of the average population. The advantage of working with aver- age population characteristics is that comparable data for different countries are often more easily at hand. The disadvantage, though, is that with such indices existing inequalities between particular groups of individuals cannot be examined (Yang 2017). The SHARE data are designed to explicitly capture the life of the elderly, and they do so on the indi- vidual level. They thus provide an ideal opportunity to develop an index on active aging based on individual-level data, which make not only a comparison possible on the aggre- gate level, but also allow an in-depth comparison of how well different subpopulations of the elderly are doing.
Barslund et al. (2017) have previously worked with the SHARE data; but because they rebuilt the Active Ageing Index (AAI) of the European Commission with data from SHARE, they did not make full use of the information available there. This, however, is the goal of our new SHARE-Active-Ageing-Index (SHARE-AAI). To build our index, we first use Principal Component Analysis (PCA) to estimate sub-indices for the following dimensions: subjective well-being, social networks, physical health, participation in soci- ety, abilities, lifelong learning, money, housing, and employment. PCA allows us to reduce the complexity of the data while keeping most of its information. These sub-dimensions are then aggregated to the final index. Since choice of dimensions, as well as adequate weighting and aggregation are at least partially based on subjective opinion, we keep the process of constructing the index as transparent as possible. When we compare our index to other measures, the strong correlation with other macro-level indices (such as Active Ageing Index or Global Age Watch Index) suggests that our index is reliable on the aggre- gated and on the individual level.
We further contribute to the literature by applying our new SHARE-AAI indicator to
show, how older people and their subpopulations are doing in Europe today. This is pos-
sible due to the individual-level nature of the index combined with the data-richness of
SHARE. We particularly focus on the effect of gender and find that in most countries, women are doing worse in their old age. Also individuals with lower levels of education tend to be worse off when old. Rather than looking at individual dimensions of ageing separately, such an index takes a more comprehensive picture of active ageing.
This paper is structured as follows: In the next section, we give an overview of the exist- ing literature on gender differences at old age and discuss several existing indices. Section three describes the data used for our analysis. In section four we explain the construction of our index with a particular focus on principal component analysis that we employ. Section five presents results and country comparisons on a macro level. We also analyze the index in more depth using age profiles and a multivariate analysis. The last section concludes.
2 Background
2.1 Gender Inequalities in Older Age
For examining gender inequalities in older age it is important to apply a life-course per- spective (Paz et al. 2017). Phenomena that appear mostly relevant earlier in life, such as discrimination in the labor market, the gender pay gap, but also the role of women as the main provider of care services, affect well-being also at old age. Traditional gender norms, together with limited public child care, often cause women to enter specific work trajecto- ries that include career breaks due to maternity leave as well as part-time work. For exam- ple, 27% of women in EU countries work part time, compared to 8.2% of men (OECD
2018). As a result of earnings-based pension systems, these gender specific work trajecto-ries as well as differences in earnings have effects beyond the working age (Foster 2011).
On average, the pension of women in most EU countries is half of men’s pensions (Bettio et al.
2015). Consequently, older women tend to face a higher risk of poverty than men(Sefton et al. 2011).
Also with respect to health, there are major gender differences among the elderly. While women have a higher life expectancy than men on average, they spend a smaller share of years of life healthy (Corsi et al. 2010). According to Arber and Cooper (1999), women are more likely to suffer from chronic and disabling illness when they are old. Calvó-Perxas et al. (2016) find higher levels of pain as well as higher incidences of depression for older women than men. Part of this difference in depression levels may result from women’s unfavorable position in society, where their work is less likely to be acknowledged, and where they may face discrimination in the labor market or domestic violence in the home (Organization 2000). A gender gap is also found in self-perceived health: men tend to rate their own health better than women do (Eurostat 2018).
1Many other studies show the gen- dered nature of the ageing experience, thus, a suitable framework for analyzing this phe- nomenon is vital.
1 These ratings, however, may be misleading if men give overtly positive responses due to gender roles that require men being healthy and strong.
2.2 The Concept of “Active Ageing”
Because of aging populations, it has become important for policy makers to enable indi- viduals to live a healthy, independent, secure, and fulfilling life also in their old age (Zaidi and Stanton 2015). The World Health Organization (2002) has therefore proposed a policy framework that promotes “active aging” that is based on three pillars which are identified as crucial for active aging: Health, participation, and security. If people remain healthy and able to manage their lives also in old age, this does not only increase the well-being of the elderly, it also saves costs for medical treatment and care services. Well-being is also increased if older people can actively participate in and contribute to society, e.g., via lifelong learning, formal and informal work, voluntary activities, political participation, or participation in the family. Security addresses the social, financial and physical needs of older people. It requires pension plans, consumer protection, and a protection of abuse.
These three pillars of active ageing proposed by the World Health Organization (2002) have also informed the construction of some indicators on the well-being of the elderly which are discussed in the following.
2.3 Measuring “Active Ageing”
To monitor improvements and setbacks with respect to active ageing, a reliable measure for the well-being of the elderly is needed. In the following we give examples for indicators that have been proposed and describe two indices that ours is related to in more detail.
Kaneda et al. (2011) introduced an index of well-being in older populations consisting of four dimensions: material, physical, social, and emotional well-being. According to the authors, this index was the first summary measure of well-being of older people that allows a comparison across countries. However, it treats the older population as a homogeneous group and does not account for differences between subgroups within countries. It also does not allow to control for life-course factors such as education.
Paúl et al. (2012) performed an exploratory factor analysis on Portuguese survey data in order to identify important aspects of well-being at old age. They find that the three pil- lars of active aging previously proposed do not hold an empirical test, and come up with a six factor model that includes: health, psychological factors, cognitive performance, social relationships, biobehavior, and personality.
2This suggests that more than the conventional three elements may be needed to accurately assess the situation of older people.
The Global AgeWatch Index by Scobie et al. (2015) is built on four domains, namely income security, health status, capability, enabling environment, and was calculated for 96 countries. This index relies on data that was available for all countries and therefore simply reflects country averages of macro-data. Nevertheless, the index serves as a useful tool for a worldwide country comparison in terms of well-being at old age. The authors also explic- itly call for a better gender analysis of the ageing experience, since women aged 50 and over account for almost 25% of the world’s female population.
Hank (2011) computes estimates of “successful ageing” using SHARE data. The author defines successful ageing as having no major disease, no daily living disability, no more
2 Drawbacks of this study are that not a representative but self-selected population is examined and that only self-reported measures are used, which may not accurately reflect the real situation of older people in Portugal.
than one difficulty with seven measures of physical functioning, obtaining a median or higher score on tests of cognitive functioning, and being actively engaged. While this approach covers many aspects of active ageing, many variables of interest that are available in the SHARE data were not used, e.g., measures on income, employment, housing, self perceived health or care giving. Further, several variables were grouped together in only one binary dimension. For example, if respondents had one or more of the following: can- cer, diabetes, a heart disease, a high score in the EURO-D depression scale or if they had had a stroke, they would be equally considered to have a major disease.
The multivariate analysis of “successful ageing”
3shows that women have lower odds of ageing successfully and these odds decrease for men and women with higher age.
In 2015, the UN Economic Commission for Europe and the European Commission introduced the Active Ageing Index (AAI), the main objective of which is to “identify areas in which different policies and programs can promote the contribution and poten- tial of older people” (p. 4 Zaidi and Stanton 2015). The authors considered four domains:
Employment, participation in society, independent, healthy and secure living as well as the capability (capacity and enabling environment) to actively age.
Each domain consists of a set of 22 indicators derived from different data sources such as EU-SILC, EU-LFS, EU-QLS among others. The authors point out that they leave out
“potentially very relevant indicators” that could be drawn from the SHARE dataset (p.
14 Zaidi and Stanton 2015) but focus on datasets with a broader geographical coverage instead. The AAI is measured on a scale between 1 and 100 and can be computed for men and women separately to examine gender differences. It is calculated using weights for indicators and domains which were defined by the authors of the AAI and experts in the field.
The AAI ranks Sweden, Denmark, and Netherlands as the top-performing countries and Hungary, Poland, and Greece among the least-performing ones. It also finds major differences between men and women - especially for variables such as employment and income. All in all, the AAI serves as a very useful measure for comparing countries on a macro-level. However, since the data is derived from different sources, further differences in active ageing between demographic subgroups cannot be considered. Also the interpre- tation of the sub-indices is difficult, since variables are grouped together that capture quite different phenomena. For example, indicators like physical exercise, poverty, and lifelong learning, among others, make up the dimension of independent, healthy and secure living.
For their index, Barslund et al. (2017) adopted the framework of the AAI from Zaidi and Stanton (2015) and applied it to the SHARE data. To our knowledge theirs is the first index based on individual-level data from only one survey. The authors substitute for AAI- variables using specific questions or computed values from several questions (such as the EURO-D scale) from the SHARE data and compute an index score for every individual.
This allows addressing also distributional questions within a country. The authors, for example, compute Gini-coefficients for each country and gender in order to assess poten- tial inequalities. They find that, on average, the higher the overall score of a country, the lower is the inequality within that country (p. 17 Barslund et al. 2017). This individual- level index allows for an in-depth analysis of active ageing, however, it does come with two downsides—both of with come from the goal to rebuild the AAI: First, the difficult interpretability of the sub-dimensions from the AAI remains, and second, even though the
3 The overall successful ageing score serves as dependent variable, demographics, socioeconomic status and country dummies serve as independent variables.
authors use SHARE data, to stay within the AAI-framework, they do not make full use of the magnitude of information that SHARE contains. The goal of our index is to fully use the rich information provided by SHARE—a data set that explicitly addresses the life situ- ation of the elderly.
2.4 Conceptual Issues in Constructing an Index
Composite indicators are useful to summarize and simplify complex issues and to make comparisons among different groups and countries. Nonetheless, when creating an index, especially when using survey data, several challenges occur which we will briefly discuss in this section. We also describe how we deal with these challenges when building our index.
The first step in constructing an index is to develop a theoretical framework that high- lights the phenomenon that should be captured. The goal of our index is to capture the phenomenon of active ageing. Further, the index is supposed to illustrate potential gen- der inequalities. Bericat (2012) summarizes several aspects that need to be taken into con- sideration when creating an index that aims at measuring (gender) inequality. Following Sugarman and Straus (1988), he argues that it is important to distinguish between gender
attainment and gender inequality. Attainment measures are given in absolute terms (e.g.labor force participation rate for women and men), while inequality indices are relative measures, showing the level of status attained by women relatively to that of men. Those measurements must not be combined in the same index. Because we work with individual- level data, our index is built on absolut measures. Bericat (2012) also states that—like in most empirical research in economics—the distinction between outcome and instrumen-
tal variables is important. For example, legal dimensions are often included in an indextogether with outcome variables, which of course are shaped by legal influences. Thus, in our new individual-level index, we only focus on outcome variables.
Klasen (2017) highlights the importance of distinguishing between empowerment
(agency) and well-being. There are countries, where women’s well-being is high, eventhough their empowerment is low. These two factors may therefore offset each other if they are included in the same indicator. Therefore, their separation, at least into different dimen- sions, is vital. Our index is built on measures capturing the well-being of the elderly. In another paper, Klasen (2007) discusses the issue of household-level indicators, where, e.g., total household income gives no information on how it is distributed within the household.
For our paper, this problem is circumvented by using individual-level data.
Well-being indices based on surveys, especially when concerning subjective well-being, come with several challenges as discussed by Benjamin et al. (2017): Authors have to criti- cally assess whether the question (or set of questions) available truly cover the relevant aspects of well-being that the index should capture (comprehensiveness). They also have to evaluate whether individuals can indeed accurately assess their own state of well-being (accessibility). If not, a social-desirability bias might distort the results.
4For our index, we work with multiple components for every subindex. The SHARE questionaire includes many factual questions that do not invite subjective evaluation and
4 Fitoussi, Sen and Stiglitz (2009) highlight the importance of objective and subjective measures when assessing individuals’ well-being. Interestingly, studies found that self-rated health aligns with doctors’
objective evaluation of health status (Szwarcwald et al. 2005), and that self-perceived health can be a better predictor of mortality than objective measures (Jylhä et al. 1998).
is also accompanied by physical tests (e.g., grip strength, peak flow) that provide objective measures.
Care must be taken as not to double count certain aspects of well-being (non-overlap-
pingness). Also the choice of the right response scale is important. Different scales mightlead to different results, e.g. numerical levels (e.g. scale 1–5) vis-à-vis written levels (e.g.
“very bad”—“very good”). Since we rely on already collected data, we can only partially circumvent these issues.
3 Data
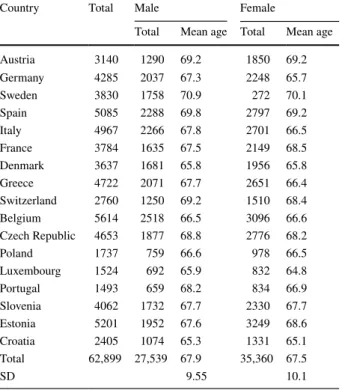
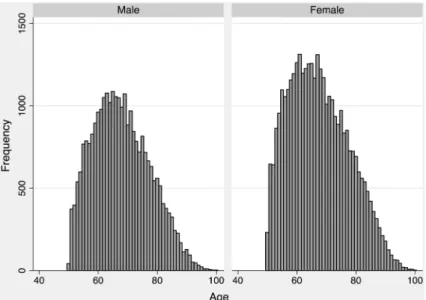
We use data from Wave 6 of the Survey of Health, Ageing and Retirement in Europe (SHARE), which was collected in 2015. SHARE focuses on older people (above 50 years age) and provides specific information on this age group, that does not get covered by other surveys used for example in the AAI. The dataset covers many different topics, such as health, financial situation, social networks, and many more. The SHARE data is collected in 30 modules that are specifically designed to fully capture the effect ageing has on indi- viduals (Börsch-Supan 2005). After editing the data and dropping non-respondents, 62,899 observations from 18 different countries are left. Table 1 provides an overview of the sam- ple and Fig. 1 shows the age distribution of the sample. While more women are represented than men, there is no major difference in the mean or the distribution in terms of age.
In the data-editing process we dropped non-respondents and persons that had many missing values in the physical health section (2414 observations). Those dropped
Table 1 Descriptive statistics Country Total Male Female
Total Mean age Total Mean age
Austria 3140 1290 69.2 1850 69.2
Germany 4285 2037 67.3 2248 65.7
Sweden 3830 1758 70.9 272 70.1
Spain 5085 2288 69.8 2797 69.2
Italy 4967 2266 67.8 2701 66.5
France 3784 1635 67.5 2149 68.5
Denmark 3637 1681 65.8 1956 65.8
Greece 4722 2071 67.7 2651 66.4
Switzerland 2760 1250 69.2 1510 68.4
Belgium 5614 2518 66.5 3096 66.6
Czech Republic 4653 1877 68.8 2776 68.2
Poland 1737 759 66.6 978 66.5
Luxembourg 1524 692 65.9 832 64.8
Portugal 1493 659 68.2 834 66.9
Slovenia 4062 1732 67.7 2330 67.7
Estonia 5201 1952 67.6 3249 68.6
Croatia 2405 1074 65.3 1331 65.1
Total 62,899 27,539 67.9 35,360 67.5
SD 9.55 10.1
observations are equally distributed among gender and countries, and are mostly among the very old. Observations that have many missing values in the physical health module, also have many missing values in other modules, such as activities, and were therefore not suitable for this analysis. The overall average index-score that we calculated in this paper would be lower if we included those—physically inactive—individuals; such an inclusion would have distorted the estimation of the principal components. We encoded persons that were reported unable to undergo the physical measurements (such as meas- uring grip strength) with a zero value in this dimension. Single missing values were imputed with age-gender-country means.
As some variables, such as in the social networks module, or education, were not available in wave 7, we merged earlier answers from waves 4 to wave 6.
4 Empirical Strategy 4.1 Framework
Our SHARE-AAI Index is influenced by the three pillars of active ageing (participation, health, and security), by the AAI, and by the possibilities and limitations of the SHARE data. It is built on nine dimensions (see “Appendix” for details):
•
Subjective Well-being contains information regarding life satisfaction and happiness,as well as depression, or enthusiasm for the future.
•
Abilities refers to how well people age regarding their cognitive functions, such asnumeracy, writing-, and reading skills. This dimension also captures several physi- cal measures such as eyesight, reading and hearing.
Fig. 1 Age distribution by gender
•
Social Networks captures information on the social environment of the participants.This dimension covers size, intensity, and satisfaction-level of a participant’s social net- works.
•
Physical Health contains information regarding mobility, chronic diseases or limita-tions in activities. This dimension consists of objective (e.g. grip strength) and subjec- tive measures.
•
Participation in Society is the degree to which participants actively contribute to soci-ety. Only voluntary activities are selected for this dimension such as participation in clubs, or charity work.
•
Lifelong Learning contains variables such as current attainment in educational coursesor the use of the Internet.
•
Money captures economic aspects, containing the total (ppp-adjusted) income of anindividual, as well as subjective questions on the economic situation, e.g. is the indi- vidual able to make ends meet? Participants with a yearly income above 1 million were dropped.
•
Housing describes the living situation of the participants regarding the area they areliving. Those questions are only answered by one individual per household; therefore we used a household-level value for each participant.
•
Employment is the only dimension that consists of only one variable that is denoted as 1if the respondent has any form of paid income (through employment or pension) and as 0 otherwise. Unfortunately, we could not use information on working conditions in our sample, because there is no way to impute these values for the elderly.
4.2 Selection of Variables and Principle Component Analysis
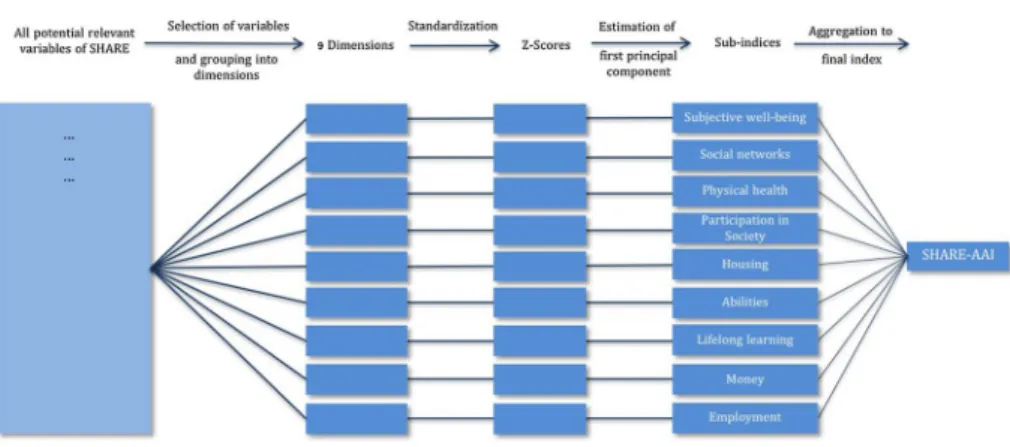
Figure 2 illustrates the major steps in the construction of the index. We mainly follow the
framework suggested by Backhaus et al. (2016). We define the nine dimensions based on
the structure of the SHARE data, existing indices like the AAI or the GAW, and general
literature on active ageing itself (see Paz et al. 2017; Corsi et al. 2010; Zaidi and Stan-
ton 2015). We selected variables that do contribute to the described dimensions through
correlation with each other. We refrained from using variables or dimensions, where the
Fig. 2 Conceptual framework of the index constructioninterpretation is unclear, e.g. the use of the healthcare system, which could either be inter- preted as availability of good health care system or as an indicator of poor health.
As suggested by Backhaus et al. (2016) we started out by manually selecting variables that are potentially relevant for these dimensions and merging variables that capture the same characteristics (e.g. the results on the mathematical questions were reduced to one single math-score). In the next step we normalized the data using z-scores, which allows easier interpretation of and comparison between variables. Standardized data have the property that correlation matrix and variance-covariance matrix are identical (p. 64 Nardo et al. 2008).
For the construction of the sub-indices we use principal component analysis (PCA). The objective of PCA is to explain the variance of the underlying data through linear combi- nations, so that most of the data’s information is represented by a fewer number of vari- ables called principal components. PCA compresses the size of the data and simplifies it by keeping the information that is commonly explained by the underlying indicators. We set up a correlation matrix for each dimension and tested whether the selected variables qualify for a PCA using three different methods: significance of correlations, anti-image matrix of correlations and the Kaiser-Meyer-Olkin measure of sampling adequacy (KMO- test). We show the results of this process for one dimension in the “Appendix”.
The assumption of normal distribution does not hold for all variables, therefore we also computed Spearman’s correlation coefficient. The differences in the coefficients between these two methods is below 2%. PCA however does not have any distribution assumptions (p. 395 Backhaus et al. 2016).
Another test to check if the data matrix is suitable for a PCA is to calculate the anti- image-covariance-matrix. According to Guttmann (1953) the anti-image describes the part of the variance, that cannot be explained through regression analysis by the other vari- ables in the sample. Since PCA assumes that the variance of correlated variables can be explained by an underlying factor, the anti-image-covariance of the off-diagonal elements should be small. Dzubian and Shirkey (1974) introduce a rule of thumb that the share of the off diagonal elements that are
> 0.09should be less than 25% in order to qualify for PCA or factor analysis. We rearranged the variables and dimensions (and dropped some if necessary) until all fulfilled this criteria.
The third test we use is the Kaiser-Meyer-Olkin criteria (KMO) of sampling adequacy as suggested by Backhaus et al. (2016), shown in (1). The variable r indicates the correla- tion between two variables (j, k), and p stands for the partial correlation of these variables.
The idea behind the KMO-criteria is, that smaller partial correlations are an indicator for an underlying factor that captures the variance of the prospective variables. Therefore, the smaller the partial correlation, the more the correlation matrix qualifies for PCA.
We computed a KMO statistic for each indicator separately and the KMO for the entire dimension. The KMO varies between 0 and 1. A value of at least 0.6 is necessary in order to perform PCA with the underlying matrix, while a value above 0.8 proves the results of PCA even more reliable (Dziuban and Sikey 1974). We dropped variables with the lowest KMO until the overall KMO statistics rose above 0.6, as suggested by Nardo et al. (2008).
We also computed the Cronbach Coefficient Alpha for each dimension separately, how- ever no additional changes were necessary (e.g. c-alpha of 0.86 for well-being-dimensions).
(1)
KMO=∑ ∑
j≠kr2jk
∑ ∑
j≠kr2jk+∑ ∑
j≠kp2jk
Cronbach Coefficient Alpha is a very common estimate of internal consistency and heav- ily recommended in the literature.
5The 9 dimensions consist in total of 59 indicators (see
“Appendix”). While some inter-correlation is required to perform PCA, multi-collinear variables will distort the results and should be combined prior to PCA (p. 67 Nardo et al.
2008)
4.3 Extraction of Components
After reviewing the data structure and rearranging the indicators we performed a principal component analysis for all 9 dimensions separately. Each principal component is a linear combination of the underlying indicators, while the first component accounts for the maxi- mum possible variance of the dataset, the second one for the maximum of the remaining variance and so on. For aggregating these principal components to an Index, we use only the first component each.
PCA explains the part of the variance that is shared by all variables, therefore the remaining variance stays unexplained. The KMO statistic and the amount of variance explained by the first component is shown in Table 2.
4.4 Aggregation to an Index
The normalization of the retrieved components bounds the score between 0 and 1, making it easier to interpret. By subtracting the minimum value and dividing the total range of the principal component of the respective dimension, and multiplying by 100, we get a sub- index score for every person and dimension between 0 and 100. The overall SHARE-AAI Index is the arithmetic mean of the sub-dimensions.
After applying PCA for the sub-dimensions, some of the calculated sub-indices show a moderate correlation (see “Appendix”). For example, the correlation coefficient between
“Physical Health” and “Subjectiv Well-being” is 0.56.
6It would be possible to use another PCA to summing up the information from the sub-dimensions into a full index. We are not suggesting such an analysis right now, since some of the sub-indices would barely
Table 2 KMO statistics andexplained variance of first component
Dimension KMO Number of
variables Explained variance
Subjective well-being 0.92 14 0.39
Abilities 0.78 9 0.37
Social networks 0.73 7 0.42
Physical health 0.79 9 0.35
Participation in society 0.64 6 0.43
Lifelong learning 0.63 4 0.53
Money 0.61 4 0.47
Housing 0.70 5 0.40
Employment – 1 –
5 See Nardo et al. (2008), p. 72 for more details.
6 See also Giudici et al. (2019) for the relation between family network and health.
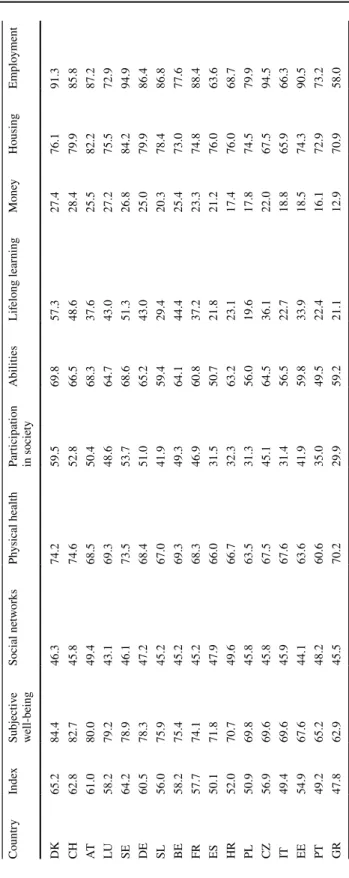
Table 3 Index- and Dimension Scores by country CountryIndexSubjective well-beingSocial networksPhysical healthParticipation in societyAbilitiesLifelong learningMoneyHousingEmployment DK65.284.446.374.259.569.857.327.476.191.3 CH62.882.745.874.652.866.548.628.479.985.8 AT61.080.049.468.550.468.337.625.582.287.2 LU58.279.243.169.348.664.743.027.275.572.9 SE64.278.946.173.553.768.651.326.884.294.9 DE60.578.347.268.451.065.243.025.079.986.4 SL56.075.945.267.041.959.429.420.378.486.8 BE58.275.445.269.349.364.144.425.473.077.6 FR57.774.145.268.346.960.837.223.374.888.4 ES50.171.847.966.031.550.721.821.276.063.6 HR52.070.749.666.732.363.223.117.476.068.7 PL50.969.845.863.531.356.019.617.874.579.9 CZ56.969.645.867.545.164.536.122.067.594.5 IT49.469.645.967.631.456.522.718.865.966.3 EE54.967.644.163.641.959.833.918.574.390.5 PT49.265.248.260.635.049.522.416.172.973.2 GR47.862.945.570.229.959.221.112.970.958.0
contribute to the estimated first principal component. We decided do use the arithmetic mean for the aggregation to the final index, in order to avoid any form of explicit weights.
The employment dimension consists of only one variable (labor market participation) that very much differs between men and women. We therefore computed the index with and without this dimension. In the following, “employment” is included, unless stated differently.
5 Results 5.1 Overview
Table
3 provides an overview of the average scores of the SHARE-AAI for the over-all population of the elderly by country and dimension. With 65 points Denmark has the highest average index score, while Greece comes out last with an average score of roughly 48 points. Major differences between countries exist in all dimensions except for “Social Networks”, where all countries score almost equally. The “Employment”
Fig. 3 Correlation of SHARE-AAI with AAI and GAW Index
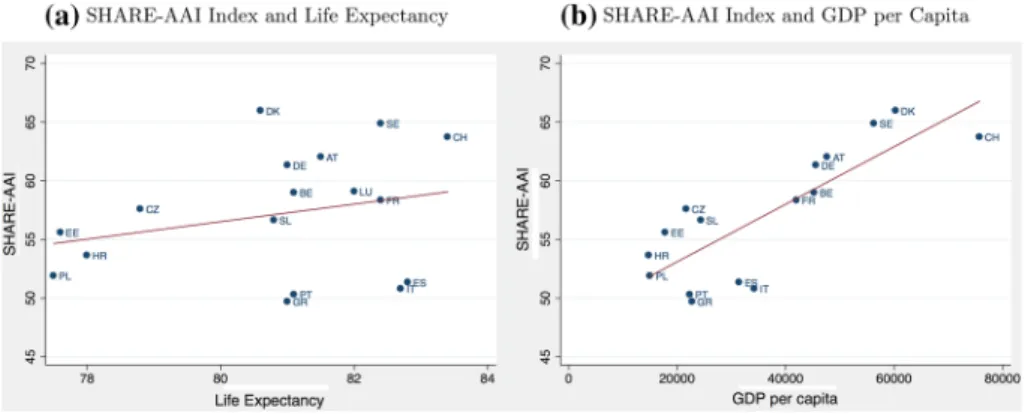
Fig. 4 Correlation of SHARE-AAI Index with GDP and life expectancy
dimension, as well as “Participation in Society” and “Lifelong Learning” show huge variations between countries.
When we compare the results of our SHARE-AAI with other ageing-indices such as the aggregate AAI or the Global AgeWatch Index, we find great consistency. As shown in Fig. 3a the correlation between our index and the existing AAI is quite strong with a correlation coefficient of 0.75. The correlation between our index and the Global Age- Watch (GAW) Index is even stronger with a correlation coefficient of 0.81 as shown in Fig. 3b.
GDP per capita and life expectancy are often used as a measure of overall well- being in a country. Therefore, Fig. 4 presents the correlation between our index and life expectancy in Panel (a) and GDP per capita in Panel (b) for the respective countries.
We excluded Luxembourg since it is a clear outlier in the GDP. While the correlation with life expectancy is not so high, we get a correlation coefficient of 0.66 between the SHARE-AAI and GDP per capita.
The Mediterranean countries score lower in the SHARE-AAI than in the AAI or GAW Index, and also lower than expected based on GDP or life expectancy. One rea- son may be due to effects of the “Mediterranean diet” on life expectancy. Lower scores for these countries relative to GDP are more difficult to argue. Mediterranean countries score particularly weak in “Lifelong Learning”, “Money”, “Participation in Society”, and the “Employment” dimension.
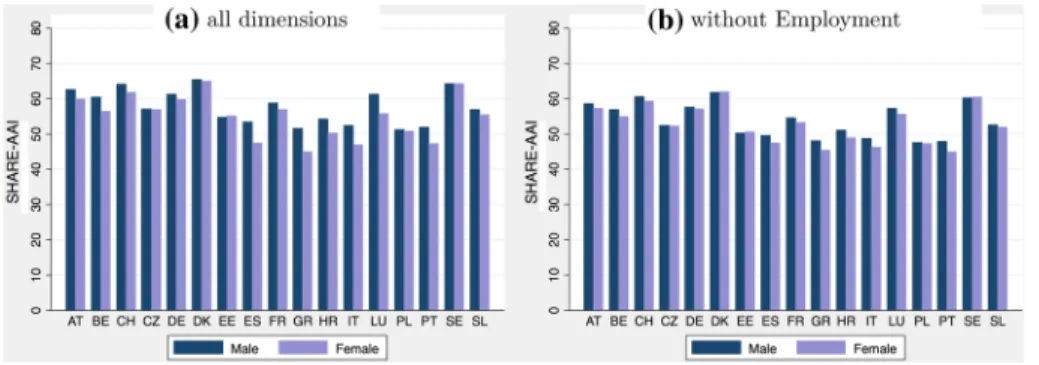
Fig. 5 Overall SHARE-AAI by country and gender
Fig. 6 SHARE-AAI Score by age and gender
Figure 5 presents the SHARE-AAI by country and gender and, thus, allows for the first comparison of how actively men age relative to women.
In most countries men and women experience aging differently, however, some of this difference is the result from differences in the employment dimension. As shown in Fig.
5b, the gender difference decreases when the “Employment”-dimension is not takeninto account.
5.2 Gender Differences in Age Profiles
To fully assess gender differences in the ageing experience it is important to look beyond mere country means. A useful tool are so-called age profiles.
7The individual-level nature of this index allows us to show the SHARE-AAI for every age group separately. Figure 6a shows that the overall index decreases with age and that gender differences increase.
Again we see that women score considerably worse than men according to the SHARE- AAI and this difference is even larger for older women. Much of this effect is due to the dimension “employment”: If we exclude employment from the index (Fig. 6b), there is lit- tle gender difference for individuals below age 65, but elderly women still fare worse than elderly men.
It is important to note that as we are looking at one cross-section from SHARE only, we cannot differentiate between aging effects and cohort effects; in other words it is not clear, whether the index is declining with age or whether the index is lower for older birth cohorts. This problem has to be kept in mind when interpreting age effects.
5.3 Gender Differences by SHARE‑AAI Dimension
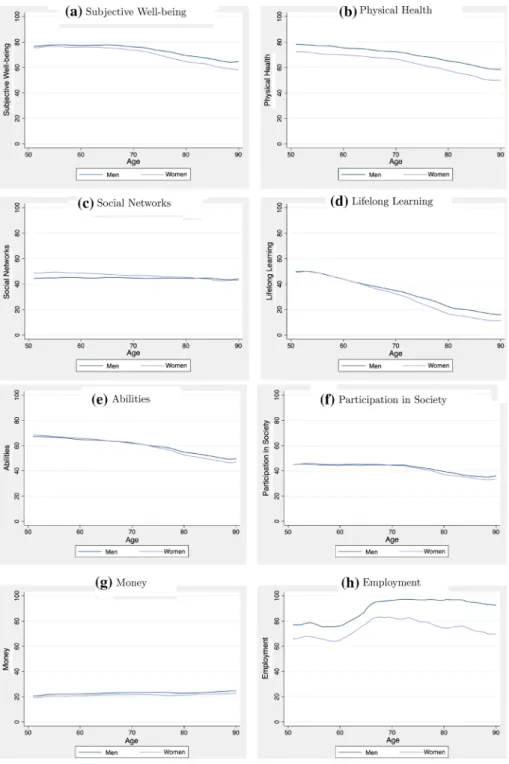
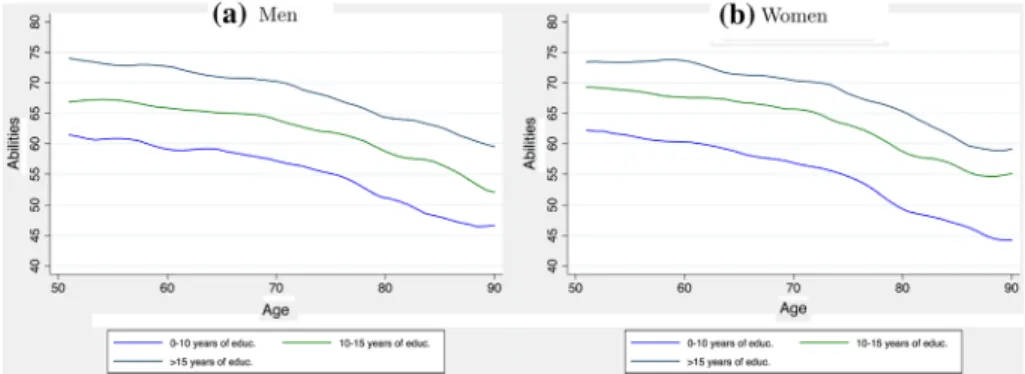
Our aggregate index might hide interesting gender differentials that occur in various dimen- sions. Figure
7 thus shows age profiles for each dimension separately. Note that slightlydifferent ranges of the y scale were applied because scores vary more in some dimensions than others.
Overall women rate their “Subjective Well-being” lower than men do, a gap that increases for older people. The results in the “Physical Health” dimension are consistent with the literature: even though women live longer, their (self-perceived) physical health status is lower than that of men. The “Social Networks” dimension is the only dimension where women on average score higher than men. This gender gap is no longer visible for the very old age cohort.
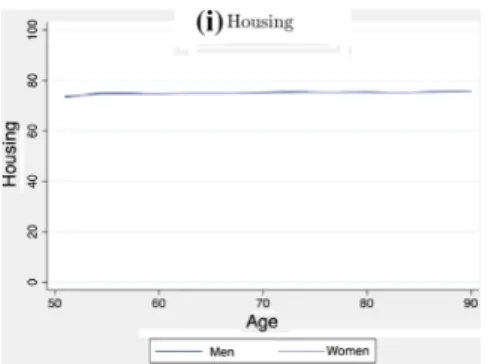
No major gender differences occur for the dimensions “Housing”, “Lifelong Learn- ing” and “Abilities”. For “Housing”, a majority of individuals interviewed live in a couple, which is why we observe no gender differences in this dimension. T-tests for the other two dimensions show that the gender differences only become significant between age 75 and 80. Scores in the dimension “Lifelong learning” fall by over 30 points from the age cohort of the 50 year old to the cohort of the 80 year old. One reason might be that especially the very old never had contact with computers or the Internet, and therefore score very low on ICT questions.
The scores in the “Money” dimension slightly increase with age. Since this dimen- sion does not only capture a pure financial status, but also subjective questions such as
7 For the graphical illustration of the age profiles, local polynomial smoothing was applied.
Fig. 7 Dimensions of SHARE-AAI: Score by age and gender
“does a shortage of money stop you from doing things” or “are you able to make ends meet”, a slight increase in the index score may result from older people being more content with what they have. This is consistent with successful ageing theory (e.g. Steverink et al.
(1998)). Due to physical limitations they may also be unable to spend money on various activities.
As already explained, the “Employment” dimension is just a reflection of people’s cur- rent job situation, i.e. if they have any form of paid income (employment or pension). The increase in points from age 60 to 70 might reflect a transition from unemployment to a paid pension. The huge gender gap reflects a dependence of older women on their husband’s income or pension. Moreover, these gender differences vary a lot by country.
In most dimensions we observe the SHARE-AAI Index-scores to decrease with age.
The strongest fall by age is found in the dimensions “Lifelong Learning”, “Abilities” and
“Physical Health”.
5.4 Correlates of Active Ageing: Education, Children, and Relationship Status The goal of policy makers is to enable older people to live an independent and secure life as long as possible. A lifetime perspective helps to better understand the causes of successful active ageing. In the next step we therefore investigate which lifetime-factors are related to the well-being at old age. The individual-level data we base our index on,
Fig. 7 (continued)Fig. 8 SHARE-AAI Index by level of education
combined with the data-richness of SHARE, is the reason why we can identify such determinants of active ageing. In particular, we explore correlates of well-being with education, number of children and relationship status. We will exemplarily show some applications of our index by plotting its scores against the external variables mentioned.
These variables are external in that sense that they are not included in the index (school- ing, e.g., takes place when young).
Fig. 9 Dimension abilities by level of education
Fig. 10 Dimension physical health by level of education
Fig. 11 SHARE-AAI Index by number of children
SHARE provides information, for example, on the education level of individuals. Edu- cation does influence many aspects of people’s life (no matter what age, see e.g. Brunello et al. (2016) or Schneeweis et al. (2014)), thus, it may not be surprising that it also affects the degree to which individuals age actively. Figure 8 shows the general SHARE-AAI index score in relation to years of education.
We see that there are large differences in active ageing by education (see e.g. Hank (2011)). Both for women and men, there is a 10 pp difference in the SHARE-AAI index score between persons with more than 15 years of education compared to those with less than 10 years of education; those with 10–15 years of education are situated in-between.
These effects are only marginally smaller in very old age.
Figures 9 and 10 present the index scores for the dimensions “Abilities” and “Physical Health” in relation to years of education and show that education has far reaching effects beyond working life. We observe substantial differences in abilities by education, but also physical health is significantly higher for better-educated individuals.
The relationship between children and active ageing is shown in Fig. 11. Whereas there are—by and large—no differences for women with respect to the number of children, childless men are associated with a significantly lower active ageing index score. Of course this may not necessarily mean that children keep their fathers young in their older age, there may also be a selection into fatherhood—e.g., more healthy men may be more likely to become fathers.
In the last Fig. 12 we present the average index score by relationship status. While there are only small advantages for females living in a relationship, effects for men are larger.
5.5 The Impact of Demographic and Socioeconomic Characteristics on Active Aging: Multivariate Analysis
So far, graphical analysis has suggested that personal characteristics can impact active aging. Next, the relation of such demographic and socioeconomic characteristics (for example, sex, education, relationship status) and active aging is tested more formally. For that purpose, we estimated multivariate OLS regressions to determine potential effects of personal characteristics on the index and sub-index scores. In particular, we estimated the following model:
(2)
yi=𝛼 + 𝛽1femalei+𝛽2singlei+𝛽3yeduci+𝛽4nchildi+𝛽5hhsizei+𝛽6agei+𝜖 Fig. 12 SHARE-AAI IndexScore by relationship status
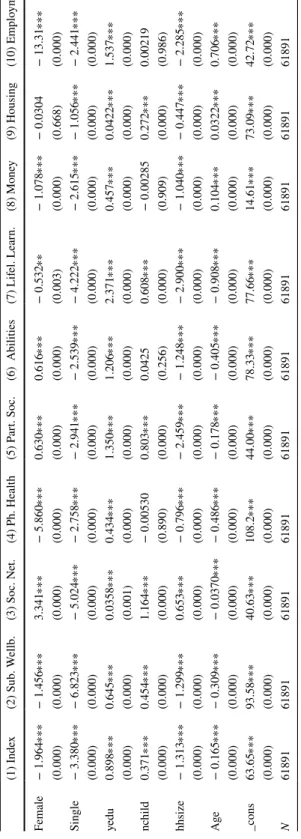
Table 4 OLS-estimation results for index and dimension OLS- regression results for respective countries for people aged between 50 and 90. p−values in parentheses ∗p<0.05 , ∗∗p<0.01 , ∗∗∗p<0.001 (1) Index(2) Sub. Wellb.(3) Soc. Net.(4) Ph. Health(5) Part. Soc.(6) Abilities(7) Lifel. Learn.(8) Money(9) Housing(10) Employm. Female− 1.964∗∗∗− 1.456∗∗∗3.341∗∗∗− 5.860∗∗∗0.630∗∗∗0.616∗∗∗− 0.532∗∗− 1.078∗∗∗− 0.0304− 13.31∗∗∗ (0.000)(0.000)(0.000)(0.000)(0.000)(0.000)(0.003)(0.000)(0.668)(0.000) Single− 3.380∗∗∗− 6.823∗∗∗− 5.024∗∗∗− 2.758∗∗∗− 2.941∗∗∗− 2.539∗∗∗− 4.222∗∗∗− 2.615∗∗∗− 1.056∗∗∗− 2.441∗∗∗ (0.000)(0.000)(0.000)(0.000)(0.000)(0.000)(0.000)(0.000)(0.000)(0.000) yedu0.898∗∗∗0.645∗∗∗0.0358∗∗∗0.434∗∗∗1.350∗∗∗1.206∗∗∗2.371∗∗∗0.457∗∗∗0.0422∗∗∗1.537∗∗∗ (0.000)(0.000)(0.001)(0.000)(0.000)(0.000)(0.000)(0.000)(0.000)(0.000) nchild0.371∗∗∗0.454∗∗∗1.164∗∗∗− 0.005300.803∗∗∗0.04250.608∗∗∗− 0.002850.272∗∗∗0.00219 (0.000)(0.000)(0.000)(0.890)(0.000)(0.256)(0.000)(0.909)(0.000)(0.986) hhsize− 1.313∗∗∗− 1.299∗∗∗0.653∗∗∗− 0.796∗∗∗− 2.459∗∗∗− 1.248∗∗∗− 2.900∗∗∗− 1.040∗∗∗− 0.447∗∗∗− 2.285∗∗∗ (0.000)(0.000)(0.000)(0.000)(0.000)(0.000)(0.000)(0.000)(0.000)(0.000) Age− 0.165∗∗∗− 0.309∗∗∗− 0.0370∗∗∗− 0.486∗∗∗− 0.178∗∗∗− 0.405∗∗∗− 0.908∗∗∗0.104∗∗∗0.0322∗∗∗0.706∗∗∗ (0.000)(0.000)(0.000)(0.000)(0.000)(0.000)(0.000)(0.000)(0.000)(0.000) _cons63.65∗∗∗93.58∗∗∗40.63∗∗∗108.2∗∗∗44.00∗∗∗78.33∗∗∗77.66∗∗∗14.61∗∗∗73.09∗∗∗42.72∗∗∗ (0.000)(0.000)(0.000)(0.000)(0.000)(0.000)(0.000)(0.000)(0.000)(0.000) N61891618916189161891618916189161891618916189161891
The dependent variable y stands for the overall index score or the score in a sub-dimension.
The personal characteristics we control for are variables which are already determined when individuals reach their old age. Female is a dummy variable for gender, single indi- cates if a person is currently in a relationship, yeduc are the years of education reported by the participant, nchild is the number of children, hhsize is the household size, i.e. how many people live in the participant’s household (reaching from 1 to 15).
The results are presented in Table
4 and highlight the importance of demographicand socioeconomic factors. Also when controlling for age and demographic variables, women score lower than men in the overall index, as well as in the subdimensions “Sub- jective Well-being”, “Physical Health”, “Lifelong Learning”, “Money”, and “Employ- ment”. The results also show that once we correct for demographic characteristics, women score higher than men in some dimensions, in particular “Social Networks”,
“Participation in Society”, and “Abilities”.
We also see that a one year increase in education has positive effects on all dimen- sions of active aging, conforming that education is associated with many positive aspects of social and personal life (Oreopoulos and Salvanes 2011). The effect is largest in “Lifelong Learning”. Single individuals do worse in all dimensions, but the causality is not clear: persons with a, say, poor physical health may face a lower probability to be in a partnership.
The number of children has an overall positive effect on active ageing, whereas house- hold size shows a negative correlation with the index score. An explanation could be that in many cases additional household members are people who need assistance in their daily life. A large household may also be the sign for scarce economic resources, as its house- hold members may not be financially able to live by themselves. Unsurprisingly, active ageing becomes more difficult as people age. That age correlates negatively with our index score is also reassuring concerning the validity of our index.
Table
5 presents the results of the estimation of model (2) for each country separately.The overall index score without the “Employment” dimension serves as dependent variable.
Even though job and pension status is an important factor of active ageing, the huge gender difference in this dimension might distort the overall results, therefore it was excluded.
After controlling for micro-level characteristics, differences between countries remain.
With respect to gender differences in active aging, we observe different effects for different type of countries. The biggest gender differences exist in the Mediterranean countries Por- tugal, Greece, Spain, and Italy. In the former Soviet/Socialist countries Poland, Estonia, and Czech Republic, as well as in Denmark, women on average score higher in active aging than men, whereas in Austria, Belgium, and Switzerland the opposite is true. No major gender differences are found in Germany, Slovenia, Sweden, and France. Age correlates negatively with active ageing in all countries; the quantitative effect is practically the same all over Europe. The same applies to education with a generally positive correlation across countries.
Another application of the index is to estimate model (2) for different age cohorts sepa-
rately, as shown in Table 6. Again we used the index without the “Employment”-dimension
as dependent variable. Big gender differences can be found especially among the older age
cohorts, aged above 70. A possible explanation is that especially older age groups grew up
with a traditional, male breadwinner paradigm, in which the man pursued paid employ-
ment, whereas the woman staid at home. Multiple gender inequalities may have resulted
from this paradigm. This finding again confirms the importance of a lifetime-approach on
active ageing. It is remarkable, that the correlation of our control variables, marital status,
education, number of children, household size as well as age shows such constancy across
age groups. This speaks towards a relatively robust SHARE-AAI.
Table 5 OLS-estimation results by country SHARE-AAI scores without Employment-Dimension serves as dependent variable. Individuals aged between 50 and 90. p values in parentheses ∗p<0.05 , ∗∗p<0.01 , ∗∗∗p<0.001 (SE)(DK)(AT)(BE)(CH)(CZ)(EE)(ES)(FR)(GR)(HR)(IT)(LU)(PL)(PT)(SL)(DE) Female0.1290.937∗∗∗− 0.745∗∗− 1.041∗∗∗− 1.054∗∗∗0.913∗∗∗1.157∗∗∗− 1.718∗∗∗− 0.370− 1.977∗∗∗− 0.0914− 1.612∗∗∗− 0.764∗0.628− 2.649∗∗∗0.3940.209 (0.507)(0.000)(0.004)(0.000)(0.000)(0.000)(0.000)(0.000)(0.123)(0.000)(0.784)(0.000)(0.044)(0.078)(0.000)(0.079)(0.362) Single− 3.685∗∗∗− 4.400∗∗∗− 2.801∗∗∗− 2.794∗∗∗− 3.263∗∗∗− 2.108∗∗∗− 2.246∗∗∗− 2.087∗∗∗− 3.253∗∗∗− 1.725∗∗∗− 1.776∗∗∗− 3.532∗∗∗− 3.132∗∗∗− 2.785∗∗∗− 1.060∗− 2.130∗∗∗− 3.259∗∗∗ (0.000)(0.000)(0.000)(0.000)(0.000)(0.000)(0.000)(0.000)(0.000)(0.000)(0.000)(0.000)(0.000)(0.000)(0.027)(0.000)(0.000) yedu0.427∗∗∗0.614∗∗∗0.272∗∗∗0.729∗∗∗0.219∗∗∗0.797∗∗∗0.915∗∗∗0.543∗∗∗0.871∗∗∗0.558∗∗∗1.150∗∗∗0.812∗∗∗0.896∗∗∗1.048∗∗∗1.014∗∗∗1.051∗∗∗0.684∗∗∗ (0.000)(0.000)(0.000)(0.000)(0.000)(0.000)(0.000)(0.000)(0.000)(0.000)(0.000)(0.000)(0.000)(0.000)(0.000)(0.000)(0.000) nchild0.1620.380∗∗∗0.194∗0.196∗0.297∗∗− 0.200∗0.577∗∗∗− 0.01440.274∗∗− 0.04680.200− 0.268∗∗0.0747− 0.276∗− 0.01950.105− 0.0396 (0.051)(0.000)(0.047)(0.012)(0.004)(0.046)(0.000)(0.836)(0.003)(0.643)(0.224)(0.004)(0.627)(0.023)(0.896)(0.405)(0.700) hhsize− 1.039∗∗− 0.680∗∗− 0.317− 0.201− 0.581∗- 0.177− 0.357∗∗− 0.368∗∗∗− 1.048∗∗∗0.06160.386∗∗− 0.578∗∗∗− 0.2150.0163− 0.352∗− 0.0491− 0.158 (0.002)(0.007)(0.066)(0.220)(0.018)(0.098)(0.006)(0.001)(0.000)(0.624)(0.003)(0.000)(0.310)(0.884)(0.028)(0.645)(0.445) Age− 0.356∗∗∗− 0.274∗∗∗− 0.342∗∗∗− 0.294∗∗∗− 0.323∗∗∗− 0.291∗∗∗− 0.323∗∗∗− 0.334∗∗∗− 0.291∗∗∗− 0.323∗∗∗− 0.259∗∗∗− 0.211∗∗∗− 0.245∗∗∗− 0.233∗∗∗− 0.236∗∗∗− 0.328∗∗∗− 0.273∗∗∗ (0.000)(0.000)(0.000)(0.000)(0.000)(0.000)(0.000)(0.000)(0.000)(0.000)(0.000)(0.000)(0.000)(0.000)(0.000)(0.000)(0.000) _cons82.82∗∗∗71.91∗∗∗81.37∗∗∗69.09∗∗∗83.24∗∗∗62.44∗∗∗60.17∗∗∗70.93∗∗∗66.85∗∗∗66.52∗∗∗54.12∗∗∗59.39∗∗∗63.87∗∗∗52.78∗∗∗61.01∗∗∗63.29∗∗∗67.62∗∗∗ (0.000)(0.000)(0.000)(0.000)(0.000)(0.000)(0.000)(0.000)(0.000)(0.000)(0.000)(0.000)(0.000)(0.000)(0.000)(0.000)(0.000) N37003140305848862702450746474877343741892115442813651578144938033741
6 Summary and Discussion
”Active Ageing” is a multi-faceted concept used by policy makers and social scientists to describe the process of optimizig opportunities for health, participation and security in order to enhance quality of life as people age. Next to indices originating from aggregate data (Zaidi and Stanton 2015) or those inspired by those (Barslund et al. 2017), we pro- pose a new—explicitly individually-based—index, the SHARE-AAI index, which is built on individual information from SHARE, a survey that collects micro data specifically on the elderly. With this index, we can compare the ageing experience not only across coun- tries, but also for individuals from different socio-economic groups within a country. In particular, the index lends itself easily for comparisons across gender. This adaptability and comparability is one major advantage of this new SHARE-AAI index.
We show some exemplary results of such an index. While there are sizeable differences across countries, in particular concerning gender differences, effects of other demographic characteristics (like age, education, or household composition) are relatively similar between countries.
Gender differences in “active ageing” are pervasive, but not in all dimensions: women score lower than men in the overall index, in “Subjective Well-being”, “Physical Health”,
“Lifelong Learning”, “Money”, and “Employment”. In the dimensions “Social Networks”,
“Participation in Society”, and “Abilities”, women score higher than men.
Across countries, the biggest gender differences occur in the Mediterranean countries Portu- gal, Greece, Spain, and Italy. In the former Soviet/Socialist countries Poland, Estonia, and Czech Republic, as well as in Denmark, women on average score higher than men, whereas in Austria, Belgium, Switzerland the opposite is true. No major gender differences are found in Germany, Slovenia, Sweden, and France. Unsurprisingly, age correlates negatively with active ageing in
Table 6 OLS-estimation results by age-groupSHARE-AAI scores without Employment-Dimension serves as dependent variable.p-values in parentheses
∗ p<0.05 , ∗∗p<0.01 , ∗∗∗ p<0.001
50–54 55–59 60–64 65–69 70–74 75–79 80–84 85–90
Female − 0.159 − 0.554∗∗∗ 0.0157 − 0.312∗ − 0.613∗∗∗ − 0.946∗∗∗ − 1.603∗∗∗ − 1.686∗∗∗
(0.489) (0.001) (0.918) (0.042) (0.000) (0.000) (0.000) (0.000) Single − 3.679∗∗∗ − 3.028∗∗∗ − 3.301∗∗∗ − 3.831∗∗∗ − 3.385∗∗∗ − 3.421∗∗∗ − 2.485∗∗∗ − 2.180∗∗∗
(0.000) (0.000) (0.000) (0.000) (0.000) (0.000) (0.000) (0.000) yedu 0.858∗∗∗ 0.797∗∗∗ 0.814∗∗∗ 0.833∗∗∗ 0.812∗∗∗ 0.809∗∗∗ 0.794∗∗∗ 0.749∗∗∗
(0.000) (0.000) (0.000) (0.000) (0.000) (0.000) (0.000) (0.000) nchild 0.552∗∗∗ 0.470∗∗∗ 0.283∗∗∗ 0.396∗∗∗ 0.290∗∗∗ 0.423∗∗∗ 0.334∗∗∗ 0.557∗∗∗
(0.000) (0.000) (0.000) (0.000) (0.000) (0.000) (0.000) (0.000) hhsize − 0.357∗∗ − 0.933∗∗∗ − 1.211∗∗∗ − 1.505∗∗∗ − 1.467∗∗∗ − 1.378∗∗∗ − 0.951∗∗∗ − 1.087∗∗∗
(0.002) (0.000) (0.000) (0.000) (0.000) (0.000) (0.000) (0.000) Age 0.278∗∗ − 0.255∗∗∗ − 0.150∗∗ − 0.195∗∗∗ − 0.314∗∗∗ − 0.476∗∗∗ − 0.283∗∗∗ − 0.289∗∗∗
(0.006) (0.000) (0.004) (0.000) (0.000) (0.000) (0.000) (0.001) _cons 32.46∗∗∗ 64.48∗∗∗ 58.21∗∗∗ 61.79∗∗∗ 70.96∗∗∗ 82.77∗∗∗ 67.31∗∗∗ 67.76∗∗∗
(0.000) (0.000) (0.000) (0.000) (0.000) (0.000) (0.000) (0.000)
N 5006 9633 11,328 11,370 9111 7471 5069 2937
all countries—the quantitative effect is practically the same all over Europe. The same applies to education that positively correlates with active aging in all countries.
The SHARE-AAI presents a valuable tool to inform discussion about different aspects of “active ageing”. While there are sizeable tendencies across age groups, e.g., gender differences are much larger for older Europeans, these results have to be interpreted cau- tiously. Being based on a cross-section of data only, these differences can be interpreted as effects of an ageing population, but could also simply result from differences among cohorts. SHARE as a true panel going into the eighth wave would be the right data source to explore such ageing-cohort controversies.
Acknowledgements Open access funding provided by Johannes Kepler University Linz. This paper uses data from SHARE, The Survey of Health, Ageing and Retirement in Europe (for methodological details see Börsch-Supan 2005) that has been funded by the European Commission and various national funding sources (see www.share-project.org). We want to thank the Federal Ministry of Science, Research and Econ- omy and the Federal Ministry of Labour, Social Affairs and Consumer Protection for funding the SHARE research infrastructure in Austria as well as the Austrian Christian-Doppler Society. Rudolf Winter-Ebmer is also affiliated with IHS, Vienna.
Open Access This article is licensed under a Creative Commons Attribution 4.0 International License, which permits use, sharing, adaptation, distribution and reproduction in any medium or format, as long as you give appropriate credit to the original author(s) and the source, provide a link to the Creative Com- mons licence, and indicate if changes were made. The images or other third party material in this article are included in the article’s Creative Commons licence, unless indicated otherwise in a credit line to the material. If material is not included in the article’s Creative Commons licence and your intended use is not permitted by statutory regulation or exceeds the permitted use, you will need to obtain permission directly from the copyright holder. To view a copy of this licence, visit http://creativecommons.org/licenses/by/4.0/.
Appendix
Variables that are used for the final index by dimension (Tables 7, 8, 9, 10, 11, 12):
Table 7 Variables of dimension
“subjective well-being” Variable Shortcut Scale
Looking forward to each day look_forw 1–4
Life has meaning life_meani 1–4
Feeling full of energy energy 1–4
Full of opportunities opportunity 1–4
Future looks good future 1–4
Life Satisfaction lifesat 0–10
Look back on life with happiness lifehap 0–10 Probability of living in ten years lifeex 0–100
Loneliness loneliness 0–10
Age prevents from doing things age_prev 1–4 Feeling things are out of control control 1–4
Feeling left out of things left_out 1–4
Do the things you want to do do_things 1–4
EURO-D Depression Scale eurod 0–12
Table 8 Correlation matrix for dimension “subjective well-being” look_forwlife_meanienergyopportunityfuturelifesatlifehaplifeexlonelinessage_prevcontrolleft_outdo_thingseurod look_forw1.00 life_meani0.571.00 (0.00) energy0.410.451.00 (0.00)(0.00) opportunity0.430.480.551.00 (0.00)(0.00)(0.00) future0.450.500.540.641.00 (0.00)(0.00)(0.00)(0.00) lifesat− 0.37− 0.41− 0.39− 0.42v0.481.00 (0.00)(0.00)(0.00)(0.00)(0.00) lifehap− 0.35− 0.42− 0.33− 0.38− 0.390.351.00 (0.00)(0.00)(0.00)(0.00)(0.00)(0.00) lifeex− 0.22− 0.27− 0.35− 0.30− 0.350.270.171.00 (0.00)(0.00)(0.00)(0.00)(0.00)(0.00)(0.00) loneliness0.280.350.330.330.35− 0.38− 0.23− 0.211.00 (0.00)(0.00)(0.00)(0.00)(0.00)(0.00)(0.00)(0.00) age_prev− 0.21− 0.25− 0.40− 0.33− 0.350.280.150.31− 0.291.00 (0.00)(0.00)(0.00)(0.00)(0.00)(0.00)(0.00)(0.00)(0.00) control− 0.22− 0.26− 0.33− 0.28− 0.310.320.160.22− 0.350.431.00 (0.00)(0.00)(0.00)(0.00)(0.00)(0.00)(0.00)(0.00)(0.00)(0.00) left_out− 0.28− 0.33− 0.33− 0.34− 0.350.370.230.21− 0.550.380.511.00 (0.00)(0.00)(0.00)(0.00)(0.00)(0.00)(0.00)(0.00)(0.00)(0.00)(0.00) do_things0.270.310.360.340.34− 0.27− 0.21− 0.190.23− 0.24− 0.21− 0.241.00 (0.00)(0.00)(0.00)(0.00)(0.00)(0.00)(0.00)(0.00)(0.00)(0.00)(0.00)(0.00)
Table 8 (continued) look_forwlife_meanienergyopportunityfuturelifesatlifehaplifeexlonelinessage_prevcontrolleft_outdo_thingseurod eurod0.340.390.470.370.43− 0.43− 0.25− 0.260.46− 0.32− 0.37− 0.360.251.00 (0.00)(0.00)(0.00)(0.00)(0.00)(0.00)(0.00)(0.00)(0.00)(0.00)(0.00)(0.00)(0.00) Pearson’s correlation coefficients of a sub−sample for the dimension “well-being”. n=200. Significance level in parentheses. Variables in this dimension: look forward to each day (look_forw), life has meaning (life_meani), feel full of energy (energy), full of opportunities (opportunity), future looks good (future), life satisfaction (lifesat), look back on life with happiness (lifehap), living in ten years (lifeex), loneliness, age prevents from doing things (age_prev), out of control (control), feel left out of things (left_out), do the things you want to do (do_things).
Table 9 Anti-image-covariance-matrix for dimension “subjective well-being” Look_forwLife_meaniEnergyOpportunityFutureLifesatLifehapLifeexLonelinessAge_prevControlleft_outdo_thingsEurod look_forw0.61 life_meani− 0.200.54 energy− 0.04− 0.040.53 opportunity− 0.04− 0.04− 0.110.49 future− 0.04− 0.05− 0.06− 0.170.46 lifesat0.040.030.000.030.080.64 lifehap0.050.110.030.050.05− 0.080.74 lifeex0.000.030.070.010.07− 0.040.010.81 loneliness0.00− 0.030.01− 0.01− 0.010.050.000.010.60 age_prev− 0.02− 0.010.090.020.03− 0.010.03− 0.110.010.69 control0.000.000.03− 0.010.01− 0.040.02− 0.010.00− 0.150.65 left_out0.010.02− 0.010.020.00− 0.04− 0.010.000.22− 0.07− 0.190.55 do_things− 0.02− 0.04− 0.08− 0.04− 0.040.030.010.00− 0.020.030.010.020.81 eurod− 0.03− 0.03− 0.110.02− 0.040.090.000.02− 0.150.020.08− 0.010.000.62
• Abilities: orientation to date, month, year, and day of week; score of words list learning test; score of verbal fluency test; numeracy score: mathematical performance; score of memory test; self-rated reading skills; self-rated writing skills; Eyesight reading; Hear-
• subjective well-being: look forward to each day; life has meaning; feel full of energy; ing full of opportunities; future looks good; life satisfaction; life happiness; living in ten years; age prevents from doing things; out of control; feel left out of things; do the things you want to do; EURO-D depression scale
Table 10 Eigenvalues for PCA for dimension “subjective well- being”
Eigenvalue Proportional vari-
ance Cumulative
variance
Comp1 5.522 0.394 0.394
Comp2 1.315 0.094 0.488
Comp3 0.973 0.069 0.558
Comp4 0.809 0.058 0.616
Comp5 0.721 0.052 0.667
Comp6 0.684 0.049 0.716
Comp7 0.671 0.048 0.764
Comp8 0.613 0.044 0.808
Comp9 0.590 0.042 0.850
Comp10 0.537 0.038 0.888
Comp11 0.430 0.031 0.919
Comp12 0.416 0.030 0.949
Comp13 0.374 0.027 0.975
Comp14 0.343 0.025 1.000
Table 11 Component loadings for dimension “subjective well- being”
Component 1 Unex-
plained variance
look_forw 0.27 0.61
life_meani 0.30 0.51
energy 0.31 0.47
opportunity 0.31 0.47
future 0.32 0.42
lifesat − 0.28 0.56
lifehap − 0.22 0.72
lifeex − 0.20 0.77
loneliness 0.26 0.63
age_prev − 0.24 0.69
control − 0.24 0.69
left_out − 0.27 0.61
do_things 0.21 0.75
eurod 0.28 0.57