Policy Research Working Paper 6516
Climate Change in the Himalayas
Current State of Knowledge
Mahesh R. Gautam Govinda R. Timilsina
Kumud Acharya
The World Bank
Development Research Group Environment and Energy Team June 2013
WPS6516
Public Disclosure AuthorizedPublic Disclosure AuthorizedPublic Disclosure AuthorizedPublic Disclosure Authorized
Produced by the Research Support Team
Abstract
The Policy Research Working Paper Series disseminates the findings of work in progress to encourage the exchange of ideas about development issues. An objective of the series is to get the findings out quickly, even if the presentations are less than fully polished. The papers carry the names of the authors and should be cited accordingly. The findings, interpretations, and conclusions expressed in this paper are entirely those of the authors. They do not necessarily represent the views of the International Bank for Reconstruction and Development/World Bank and its affiliated organizations, or those of the Executive Directors of the World Bank or the governments they represent.
Policy Research Working Paper 6516
This paper reviews the literature on the potential biophysical and economic impacts of climate change in the Himalayas. Existing observations indicate that the temperature is rising at a higher rate in Nepal and Chinese regions of the Himalayas compared with rest of the Himalayas. A declining trend of monsoon in the western Indian Himalayas and an increasing trend in the eastern Indian Himalayas have been observed, whereas increasing precipitation and stream flow in many parts of Tibetan Plateau are noted. Glaciers in both the eastern and western Himalayas are mostly retreating, but the majority of the glaciers in Karakorum are either stable or advancing slowly. Expansion of glacier lakes is reported,
This paper is a product of the Environment and Energy Team, Development Research Group. It is part of a larger effort by the World Bank to provide open access to its research and make a contribution to development policy discussions around the world. Policy Research Working Papers are also posted on the Web at http://econ.worldbank.org. The authors may be contacted at gtimilsina@worldbank.org.
with the highest rate in Nepal and Bhutan. Most
literature predicts increases in temperature and monsoon
precipitations and decreases in winter precipitations in
the future thereby leading to monsoon flooding and
increased sediments in stream flow. Available hydrological
simulations indicate reduced rainfall and shrinkage of
glacier thereby leading to shortage of water supply for
power generation and irrigation in winter particularly
in highly glaciated basins. Projected economic impacts
of glacial lake outburst floods can be substantial on the
developed river basin with infrastructures and population
centers. However, there is a clear gap in knowledge of
economic impacts of climate change in the Himalayas.
Climate Change in the Himalayas: Current State of Knowledge
#Mahesh R. Gautam, Govinda R. Timilsina, and Kumud Acharya
§Key words: Climate change, Himalayas, Impacts of climate change JEL Classification: Q54
Sector Boards: Energy and Mining, Environment
# The author would like to thank Don Alford, Anna M. Knust, Samjwal Bajracharya, Urvashi Narain, Rabin Shrestha and Winston Yu for their valuable comments and suggestions. The views and interpretations are of authors and should not be attributed to the World Bank Group and the organizations they are affiliated with. We acknowledge World Bank Research Support Grant for financial support.
§ Mahesh Gautam and Kumud Acharya are, respectively, Post-Doctoral Fellow and Research Professor at Desert Research Institute, Las Vegas, NV and Govinda Timilsina is Senior Economist at World Bank, Washington, DC.
2 1. Introduction
With the largest snow and ice cover in the world outside the polar regions, the Himalayan region is one of the most important mountain systems in the world and is referred to as the “third pole” (Schild, 2008) and the “water tower of Asia” (Xu et al., 2009). Extending along the
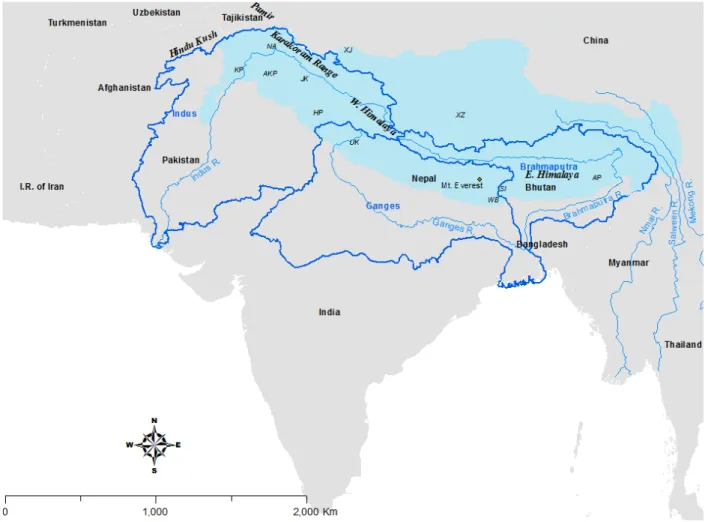
northern fringe of the Indian subcontinent, from the bend of the Indus River in the northwest to the Brahmaputra River in the east, the Himalayas directly or indirectly affect lives and livelihood of over 300 million people (Schild, 2008). Through their massive fresh ice reserve, the
Himalayas influence flow to thousands of rivers and rivulets that converge into the three main river systems in the region: the Ganges, the Brahmaputra (called Yarlung Zangbo in China), and the Indus (Fig 1).
The Himalayas play a key role on supporting economy of nations like Nepal and Bhutan, which depend heavily on the Himalayas for hydropower, water supply, agriculture, and tourism.
For example, Bhutan’s export revenue from hydropower contributed 16.3% of nominal gross domestic product (GDP) or 39% of total exports in 2009/2010 (RMA, 2011). In Nepal,
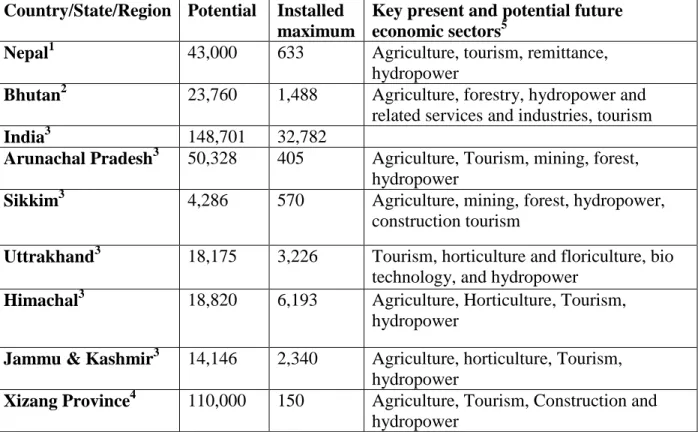
agriculture has remained a key economic sector, contributing about 34% of GDP in 2009 (World Bank, 2011) and employing 93% of the workforce in 2004 (ADB and IFPRI, 2009). Nepal's long term economic development plan centers on hydropower development, although current installed capacity is barely 1.5% of the total 43,000 MW potential. Himalayan States of India and Xizang Province of China also rely on hydropower, tourism, and agriculture for sustaining their
economy. All these countries and states have remarkably high potential for hydropower of which only a small fraction has been harnessed. The Government of India released a study (GOI, 2012) showing that the Indian Himalayan states alone have over 70% of India’s hydropower potential in terms of installed capacity greater than 25 MW
The Himalayan region holds significant importance in terms of biological (species) richness, biodiversity, socio-cultural diversity, and wealth. The region is one of 34 worldwide
“biological hotspots” (i.e., a natural environment with a high biodiversity containing a large number of endangered endemic species) as identified by Conservation International (CI, 2011).
The region’s indigenous people consider the Himalayas sacred and look upon them with reverence. In essence, the Himalayas are both pride and necessity of the region.
3
Figure 1 Map Showing the Hindu Kush-Himalayan Region. The coverage of this study is shown in sky blue color. KP: Khyber Pakhtunkhwa, NA: Northern Areas; AKP: Azad Kashmir; JK: Jammu and Kashmir; HP: Himachal Pradesh; UA: Uttrakhand; S: Sikkim;
AC: Arunachal Pradesh; XJ: Xianjiang, XZ: Xizang, (Sources: ESRI, ArcWorld and ArcWorld Supplement and ICIMOD).
The fragile landscapes of the Himalayan region are highly susceptible to natural hazards, leading to ongoing concern about current and future climate change impacts in the region (Cruz et al., 2007). Climate change concerns in the Himalayas are multifaceted encompassing floods, droughts, landslides (Barnett et al., 2005), human health, biodiversity, endangered species, agriculture livelihood, and food security (Xu et al., 2009). While there are some reviews of existing literature on climate change observations and physical impacts on some of these aspects, a comprehensive review covering the Himalayan region from all dimensions of impacts is
missing. This omission in the literature has fostered an opportune environment for controversies
in the past. Specifically, past controversies (Bagla, 2009) are related to glacier retreat, melting,
4
and regional dependence on glacier melt. While many of these controversies seem resolved at present (Cogley et al., 2010; Inman, 2010), they give some critical insights into the reality.
Armstrong (2010) and Kargel et al. (2011) have made excellent contributions toward solving some of the controversies and myths. A comprehensive review not only helps to expose common myths, but also to identify research gaps and areas where scientific investigation is critically important.
Economic development is a key issue in the Himalayan region and analyses of existing knowledge, and gaps in that knowledge, on how key economic sectors will be impacted under climate change is essential. Similarly, given the regional dependence and emphasis on
hydropower, it is important to analyze the current economic impact of climate change on hydropower. Thus, this study has two specific objectives: (i) to synthesize the current state of knowledge on climate change impacts on the biophysical system (e.g., temperature, precipitation, snow coverage, streamflow, glacier melt, and ecosystem changes) in the Himalayan region and (ii) to review existing literature on economic impacts of climate change in the region. This study will help identify critical research gaps on the impacts of climate change in the Himalayas.
The study has a broad coverage of both biophysical and economic impacts of climate change on the Himalayas and there exists huge volume of literature on biophysical side. It is beyond the scope of this study to go through every available literature and judge their quality.
Instead, we limited our review mostly to peer reviewed journal articles assuming that journals have a rigorous peer-review process and findings of the articles in these journals are credible.
Besides, journal articles, we have included reports and articles published by national and
international agencies assuming that these agencies are sensitive on knowledge products they
produces and results of their studies are credible. However, we have taken every caution to
interpret results of the existing studies. For example, many articles were found reporting trends
without statistical significance, we have excluded interpretations of such trends. We have also
considered other factors to scrutinize reported trends are data type (gridded versus gauged,
recorded versus reconstructed), data length, spatial coverage, and analytical techniques. The
trend test results are summarized together with information on statistical significance, data type
and length. It should be noted that Himalayan hydroclimatological observations are limited; at
higher altitude they are very limited. Therefore, caution is required on the interpretation of
results based on observations from a few stations. However, until more monitoring networks are
5
established, existing stations may be the only available means of looking into hydroclimatic trends in the region.
2. Climate Change Observations 2.1 Strong evidence of warming
Temperature data in the Himalayas overwhelmingly show a warming trend, albeit at different rates in different periods depending on the regions and seasons (Table 1). In a very recent regional study using Climate Research Unit’s reconstructed temperature dataset (Brohan et al., 2006), Diodato et al. (2011) show that in the last few decades the Himalayan and Tibetan Plateau region have warmed at a rate higher than that in the last century. They show a 0.5 °C in annual average maximum temperature (Tmax) warming over 1971-2005 compared to 1901- 1960. Dash et al. (2007) report that the western Indian Himalayas saw a 0.9 °C rise over 102 years (1901-2003). They report that much of this observed trend is related to increases after 1972. Using winter (Dec-Feb) monthly temperature data from 1975-2006, Dimri and Dash (2011) also found a warming trend over the western Indian Himalayas, with the greatest observed increase in Tmax (1.1-2.5 °C). Over the northwest Indian Himalayan region, Bhutiyani et al. (2007) found 1.6 °C warming (0.16° C /decade) in the last century. Singh et al. (2008) observed increasing trends in Tmax and seasonal average of daily maximum temperature for all seasons except monsoon over the lower Indus basin in the northwest Indian Himalaya. Fowler and Archer (2005) report increasing trends in winter temperature during 1961-2000 in the upper Indus basin (Pakistan) with varying warming rates of 0.07-0.51 °C/decade in annual mean temperature (Tav) and 0.1-0.55 °C/decade in Tmax. Increasing winter maximum temperature in the upper Indus basin was also reported by Khattak et al. (2011) who found an increasing warming trend of 0.45,0.42,0.23 °C/decade in Tmax for the upper, middle, and lower regions, respectively, during 1967-2005.
Although, studies specific to the eastern Indian Himalaya are not available in the
literature, many of the studies discussed above include the eastern Indian Himalaya as part of the
greater northeast Indian region. For 1901-2003, Dash et al. (2007) found a rise in Tmax of 1°C
over the whole northeast India. The study reports annual average daily minimum temperature
(Tmin) increasing after 1972 following a sharp drop of 1.4 °C during 1955-72. Other studies also
6
report significant warming in the eastern Indian Himalaya. For example, Jhajharia and Singh (2011) show a 0.2-0.8 °C/decade increase in Tav, 0.1-0.9 °C/decade in Tmax, and 0.1-
0.6°C/decade in Tmin for stations exhibiting warming trend. Immerzeel (2008) reports a basin- wide warming trend similar to global average Tav (0.6 °C/100 year for the 1901-2002 gridded dataset) for the Brahmaputra basin in the eastern Indian Himalaya and Tibetan Plateau.
The Nepalese Himalaya also saw a warming trend in the last century. Shrestha et al. (1999) reports a trend varying between 0.4 and 0.9 °C/decade in the mean annual maximum temperature across different ecological belts of Nepal, with the high Trans-Himalayan region showing the highest and the Terai (lowland region) showing the lowest. While for the same regions for winter season they reported a trend varying between no trend in Terai to 1.2 °C/decade in the Trans-Himalaya. Tse-ring et al. (2010) report (Table 1) trend similar to that reported by Shrestha et al. (1999) for a slightly different time period. In Bhutan, average temperature in the Himalaya regions increased by 0.5 °C in the non-monsoon season from 1985-2002 (Tse-ring et al., 2010).
Several studies report similar higher warming trends for the eastern Himalayas in China(Liu et al., 2006; Liu and Chen, 2000; Wang et al., 2008; Xu et al., 2008; Yang et al.,2011; You et al., 2008; Yunling and Yiping, 2005). Liu and Chen (2000) show a rate of 0.16 °C/decade for the annual mean temperature for 1955-1996. However, analyzing data from 90 stations recently Wang et al.
(2008) found increased warming over the whole Tibetan Plateau with a rate of 0.36 °C/decade) during 1961-2007. Other studies with proxy temperature data reconstructed from tree ring width have also confirmed warming in the Tibetan Plateau. For example, Liang et al. (2009)
reconstructed mean summer temperature (June-August) and found the last decade to be the warmest in the last 242 years (1765-2007) in southeast part of Xizang province of China. Yang et al. (2010) also observe distinct evidence of late 20
thcentury warming in reconstructed annual mean temperature in southwest part of Xizang province of China, although within the range of natural climatic variability in the region.
The Everest (Qomolangma) region in China also exhibits warming at an average rate of 0.234 °C/decade in Tav from 1971-2004 (Yang et al., 2006). Higher warming rates of 0.28
°C/decade for annual average temperature are noted in the Chinese side of Brahmaputra basin
(Yarlung Zangbo River Basin) during 1961-2005 (You et al., 2007).
1
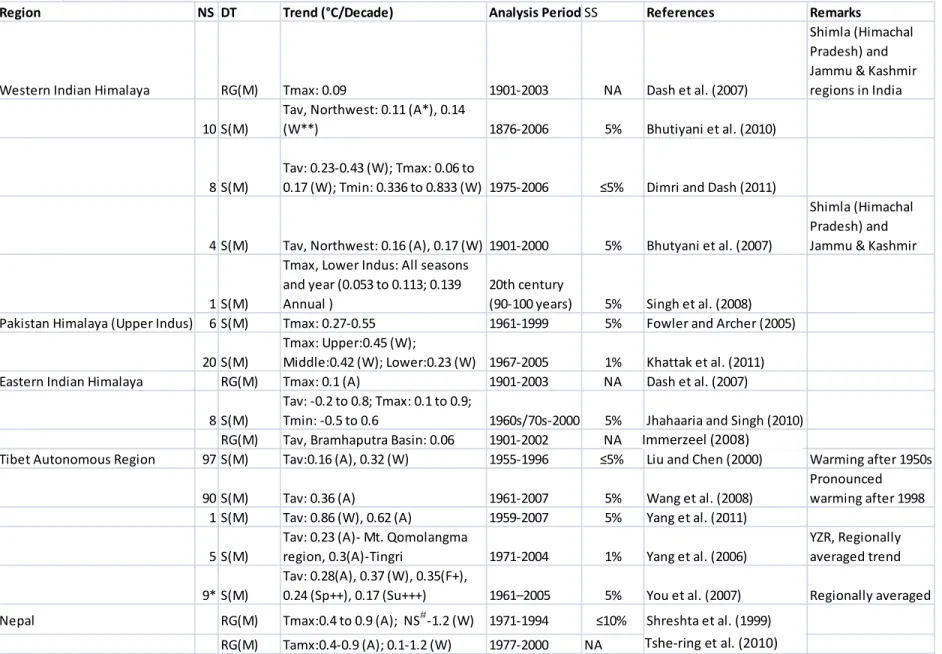
Table 1 Summary of Temperature Trend Studies in the Himalayas (NS= Number of stations; DT= Temperature data type (RG= reanalyzed grid; S=Station; M=monthly); SS=
Statistical significance)
*A=Annual; **W=Winter; +F = Fall; ++Sp=Spring;+++ S= Summer; # NS = Not significant)
Region NS DT Trend (°C/Decade) Analysis PeriodSS References Remarks
Western Indian Himalaya RG(M) Tmax: 0.09 1901-2003 NA Dash et al. (2007)
Shimla (Himachal Pradesh) and Jammu & Kashmir regions in India 10 S(M) Tav, Northwest: 0.11 (A*), 0.14
(W**) 1876-2006 5% Bhutiyani et al. (2010)
8 S(M) Tav: 0.23-0.43 (W); Tmax: 0.06 to
0.17 (W); Tmin: 0.336 to 0.833 (W) 1975-2006 ≤5% Dimri and Dash (2011)
4 S(M) Tav, Northwest: 0.16 (A), 0.17 (W) 1901-2000 5% Bhutyani et al. (2007)
Shimla (Himachal Pradesh) and Jammu & Kashmir
1 S(M)
Tmax, Lower Indus: All seasons and year (0.053 to 0.113; 0.139 Annual )
20th century
(90-100 years) 5% Singh et al. (2008) Pakistan Himalaya (Upper Indus) 6 S(M) Tmax: 0.27-0.55 1961-1999 5% Fowler and Archer (2005)
20 S(M) Tmax: Upper:0.45 (W);
Middle:0.42 (W); Lower:0.23 (W) 1967-2005 1% Khattak et al. (2011)
Eastern Indian Himalaya RG(M) Tmax: 0.1 (A) 1901-2003 NA Dash et al. (2007)
8 S(M)
Tav: -0.2 to 0.8; Tmax: 0.1 to 0.9;
Tmin: -0.5 to 0.6 1960s/70s-2000 5% Jhahaaria and Singh (2010) RG(M) Tav, Bramhaputra Basin: 0.06 1901-2002 NA Immerzeel (2007)
Tibet Autonomous Region 97 S(M) Tav:0.16 (A), 0.32 (W) 1955-1996 ≤5% Liu and Chen (2000) Warming after 1950s
90 S(M) Tav: 0.36 (A) 1961-2007 5% Wang et al. (2008) Pronounced
warming after 1998 1 S(M) Tav: 0.86 (W), 0.62 (A) 1959-2007 5% Yang et al. (2011)
5 S(M)
Tav: 0.23 (A)- Mt. Qomolangma
region, 0.3(A)-Tingri 1971-2004 1% Yang et al. (2006)
YZR, Regionally averaged trend 9* S(M) Tav: 0.28(A), 0.37 (W), 0.35(F+),
0.24 (Sp++), 0.17 (Su+++) 1961–2005 5% You et al. (2007) Regionally averaged Nepal RG(M) Tmax:0.4 to 0.9 (A); NS#-1.2 (W) 1971-1994 ≤10% Shreshta et al. (1999)
RG(M) Tamx:0.4-0.9 (A); 0.1-1.2 (W) 1977-2000 NA Tshering et al. (2010) Immerzeel (2008)
Tshe-ring et al. (2010)