TRANSPORT NOTES
ROADS, HIGHWAYS & RURAL TRANSPORT THEMATIC GROUP
THE WORLD BANK, WASHINGTON, DC Transport Note No. TRN-32 May 2006
Highway and Railway Development in India and China, 1992-2002
Clel Harral, Jit Sondhi and Guang Zhe Chen
T HE EVOLUTION OF THE TWO ECONOMIES
In the last two decades, the GDP growth rate in India has been around 5.5% with the economy growing about 2.6 times reaching a level of about US$510 billion in 2002. In China the GDP has been growing at about 9.5 % over the same period with the economy growing more than five fold between 1982 and 2002 reaching a level of about US$
1,232 billion in 2002. The GDP of China, which was about 1.2 times that of India in 1982, had by 2002 grown to 2.6 times that of India. In terms of impact of the economic growth on poverty reduction, by 2002 China had lifted 400 million people out of poverty and its poverty rate had declined to 4.6%. In India over the same period the poverty rate declined from 36% to 29%.
The structure of the two economies also evolved differently, with the share of the agriculture sector declining more sharply in China – to less than 15% of GDP in 2002 – while in India it was nearly 23%. In India the contribution of services to GDP grew to above 50%; in China services contributed 33.7 %. In India, industry share of GDP is about 27% and in China it is 52%. Moreover, by 2002/2003, the amount of foreign direct investment and volume of trade in China have reached a level that is many times of those in India. On balance, the Chinese economy has thus become more freight transport-intensive than that of India.
T HE DEVELOPMENT OF THE HIGHWAYS AND RAILWAY IN FRASTRUCTURE
At the beginning of the 1990s, India
’s highway and railway infrastructure was ahead of those in China in terms of total route km, route km/square km, and route km/head of population, but the utilization of the infrastructure, particularly for railways, was quite different.
India
’s road network was more extensive than that of China in 1992, but the quality of the road networks in both countries was severely deficient relative to the standards of modern highways in virtually all dimensions – pavements, road geometry, and traffic management. Informal evidence
1suggests that the quality of the two road networks was roughly on a par, except that China had perhaps generally better road maintenance. The uncontrolled mixing of pedestrians, animals, and other slow moving traffic was similar in both countries, contributing to slow travel speeds, uncertain journey times, and high accident rates.
1
Clell Harral, formerly Highway Design and Maintenance Advisor to the World Bank, traveled several thousands of km of highways in both India (1964-2003) and China (1980-1990).
Table 1. Key Economic Data for India and China, 1992-2002
India China
1991-
92 2001-
02 1992 2002 Population
(million) 846 1,000 1,171 1300 Poverty rate
(%) 36 29 40 7
GDP (current $
billion) 244.2 510.2 454.6 1,233 GDP growth rate
(%) 5.5 4.4 14.4 8.0
Share of GDP
(%) – Industry 26.7 26.6 43.9 51.7 Share of GDP
(%) - Services 42.3 50.7 34.3 33.7 Volume of trade
(current $ billion) 46 157 165 623 Foreign direct
investment current $ billion) (
1.8 4 11 53
Source: World Bank “India at a Glance” and “China at a Glance”.
http://www.cpirc.org.cn/yjwx/yjwx_detail .asp?id=3204 for China
data.
In 1992, the two railways then carried almost exactly the same volume of passenger km (pkm, 314 vs 315 billion), while China Railways (CR) managed to carry 1,157 billion ton km (tkm) of freight – or 4½ times that of Indian Railways (IR) of 257 billion tkm – through far more efficient exploitation of track, locomotives, and wagons, and by assigning lower priority to passenger services. IR operations were dominated by passenger services (including suburban operations, a burden not imposed on CR), but, reflecting the fact that India
’s citizens enjoyed a far higher propensity to travel, the 314 billion pkm carried by IR constituted only 20% of India
’s estimated total passenger pkm, while the 315 billion pkm via CR constituted 45% of China
’s estimated total passenger market. The share of both railways in their respective freight markets had already substantially eroded over the preceding two decades as trucking, coastal shipping, and, in China, also inland water transport took an ever larger share. IR
’s share stood at 45% in 1992, slightly superior to that of CR at just under 40%.
22
Traffic statistics for the railways sector may be reasonably accurate, but statistics for other modes, particularly roads, are subject to wide margins of error, so that reported modal share should be taken as indicative at best; published estimates vary widely: e.g. Pittman (2004) reports CR’s current share at an implausible 70-80 % of surface freight transport.
Public Disclosure Authorized Public Disclosure Authorized Public Disclosure Authorized Public Disclosure Authorized
37369
Over the ensuing decade (1992-2002), China
’s highway and railway development overtook that of India
’s.
Having started the development of a National Trunk Highway System (NTHS)
3in 1992, China took advantage of the macro-economic slowdown following the Asian financial crisis that began in 1997 to more than double its spending on highways, from US$13 billion in 1997 to US$30 billion per annum or more during the ensuing years. Highway building is estimated to have increased China
’s GDP by a full 2 % per annum over the subsequent years. India
's road expenditures averaged only US$1 billion to US$3 billion per annum during this decade.
China
’s Rail network extension and capacity expansion also exceeded that in India, as the double- tracked network was extended by 69% (+9,400 km), electrified track km doubled (+8,975 km), and the overall network route km extended by 24% (+13,797 km). The latter included 12,367 km built by new local rail corporations, many with private participation, owned and operated separately from the National Railway, unlike India, where IR retained a monopoly for rail services. The investment in the government owned railways during the decade 1992-2002 in China and India was US$ 85 and 17.3 billion, respectively. The
increment in annual freight traffic (from 1,157 to 1,551= 394 billion tkm) taken on by CR over 1992-2002 exceeded the entire freight traffic carried by Indian Railways in 2002 (336 billion tkm), reflecting, among other things, the far greater freight intensiveness of China
’s economy.
It was in the highways sector, however, where the contrast, in both objectives and achievements, was greatest. While India
's road network officially grew by 600,000 km (from 2.7 to 3.3 million km, or 22%), virtually all of the increase was in very low-standard roads to reach more of the rural areas which had before been outside the reach of all weather access. High standard arterial highways to connect the four main cities of India were largely neglected; the effort to widen the 6,500 km Golden Quadrilateral to 4 lanes without controlled access, began in 1998 and is not expected to be completed before 2005. In contrast, China
's road network officially grew by only 443,000 km (from 1.32 to 1.77 million km, or 28%), but the emphasis was on the arterial networks. By 2002 some 25,130 km of access-controlled expressways with minimum 4-lanes and another 27,468 km of 4-lane dual carriageway highways without controlled access feature had been completed, including 27,000 km of the NTHS.
Over this period, India
's rail network grew by only 682 route km (1%), double track by 1,519 km (10%), and electrified line by 5,192 km (48%). Interestingly, IR
’s gain in annual traffic carried per US dollar of investment (14.9 tkm+pkm) over the decade was more than twice (2.2 times) that of China Railways (6.8 tkm+pkm), but the gain in labor productivity was only 61% (from 402 to 648 tkm+pkm) vs the 90% gain on CR (from 728 to 1385 tkm+pkm). Apparently CR spent extra capital partly to purchase improved labor productivity, to achieve an
3
This is a program to develop 35,000 km of expressway network of 12 corridors in the country, planed to be completed by 2020. By 2002, however, about 27,000 km (or 77%) of the NTHS have been completed. The government has since decided to push up the completion date to 2007.
average output per employee more than twice (2.1 times) that of IR. It is also the perception that CR has developed rail line capacity that would cater to growth of demand over the next 10 years or so while India has not done so.
Finally, CR has invested heavily to ease the shortage and improve availability of wagons to its clients.
In sum, after suffering from transport constraints impinging on its economic growth for more than a decade since the start of the economic reforms and liberalization in 1978, China decided in the early 1990s to address the problem head on. A choice was made to build capacity not merely to alleviate the most serious immediate bottlenecks on its existing, largely outmoded transport infrastructure, but to go beyond and build a high-capacity system of modern highways and railways that would provide for future needs as well. This would smooth the path for sustained future growth for the rapidly growing coastal provinces, and extend improved economic opportunity to the vast population residing in its distant, impoverished hinterlands. It appears that rapid capacity expansion on highways and railways has contributed significantly to the high economic growth rate in China. Indeed, it is doubtful whether China could have sustained its rapid growth without addressing the serious constraints in its transportation system.
How did China accomplish this extraordinary breakthrough? Does its experience suggest development options and offer lessons learned that could be considered by policy makers in India today, as it faces many similar problems to those faced by China in 1992? This paper addresses these questions first for the highways sector and subsequently for the railways sector.
HIGHWAYS
Key Strategies Pursued by China. In achieving the rapid expansion of its arterial highway network, China had to overcome two basic constraints: (i) highway finance, and (ii) physical implementation capacity, including planning, design, tendering, and supervision of construction.
H IGHWAY FINANCE
The huge increase in funding for highways was accomplished through a wide spectrum of measures, several of which have the characteristics of temporary expedients that will have to be substantially restructured or replaced over the long run. The great majority of financing for roads in China has been secured from public sources, either directly from the government budget or through government borrowings or guarantees. About one-quarter of new construction expenditures came from China
’s road user charges system – the Road Maintenance Fee (US$10 billion in 2002), the Vehicle Purchase Fee (US$ 4.5 billion), and the Highway Transport Management Fee(US$2.5 billion). Although authorized by the new road law in 1998, the Government of China has so far been unable to agree on a fuel tax for road construction; consequently vast additional sums had to be sought elsewhere.
A notable feature over recent years (particularly
since the explosion of expenditures from 1997) is
that virtually half of road development has been
financed by domestic bank loans guaranteed by
local government and by central government bond
proceeds which were on-lent to local governments.
4This mode of finance is unlikely to be sustainable at these magnitudes over time.
Tolling of improved roads was already introduced and widely practiced in China prior to initiation of the NTHS program, and it was decided from the beginning that the NTHS (like most other major new roads) would be operated as toll facilities. That decision, of course, did not provide the immediate finances for construction of the network or its initial years of operation before growth of traffic generated significant revenues. Financing of the construction of the NTHS and other major components of the highway development program has involved both public and private finance, the latter largely equity, as long-term debt from private sources has not generally been available without government guarantees.
The application of tolls has also caused important operational problems and economic distortions, the most significant of which has been substantial traffic diversion, reducing both the financial and economic rates of return, as older non-tolled facilities have continued to carry heavier traffic in many cases than the newer, high quality facilities. Fragmentation of ownership and operation of the toll network has also caused other operational inefficiencies – e.g., more than 300 toll stations were reported in place in Guangdong Province alone in 2001, with the excessive segmentation increasing the costs of construction and operation, causing road users much unnecessary delay, and magnifying risks for investors and lenders.
The innovations in road finance, some more successful than others, have included extensive efforts to engage private finance to complement public funding. During 1990-2000, there were more than 80 cooperative joint-venture (public-private partnership) road projects between Hong Kong developers and provincial or municipal authorities which mobilized some RMB 75 billion (>US$9 billion) from private sources. In addition, since 1996, asset securitization (sale of equity in existing toll highway companies) raised another RMB 16 billion (US$2 billion) through listing of eight expressway development companies on the domestic stock exchanges and five in Hong Kong.
5The absolute magnitude of private finance is thus significant
—and quite large relative to that achieved in other emerging economies – but the total has been well under 10% of the total funding committed to road investments in China over this period. The disinterest of institutional lenders (such as insurance companies and pension funds) in providing long-term debt to support road development in China in the absence of a government guarantee is a major constraint. “In the absence of a well structured legal and regulatory framework, most mainland companies do not have access to sources of long-term domestic funds from institutional investors.
6Arranging sustainable, economically efficient sources of finance for a highway system that is still expanding rapidly, while at the same time coupling with mounting maintenance and rehabilitation
4J. Yenny, “China Higwhay Strategy Review”, draft report to World Bank (July 27, 2001).
5
J. Yenny (2001).
6
M. Bellier and Y.M. Zhou, Private Participation in
Infrastructure in China (World Bank, 2003), p. 49.demands, is yet an unresolved set of issues in China. The prospective elements of a long-term solution include both a fuel tax and a restructuring of ownership and method of collecting tolls, which are expected to grow with rapidly rising incomes, personal car ownership, and consequent traffic. Bellier and Zhou (2003), provide an overview of the potentials of private finance and a blueprint for exploiting those potentials for highway finance in China. These potentials should not be exaggerated, however. The magnitude of funding required, the strong public goods characteristics of roads, and the particular character of the roads remaining to be built in China (primarily lower-volume non-arterial networks) are likely to dictate that the dominant portion of resources for road development continues to come from public funding.
H IGHWAYS IMPLEMENTATION: PLANNING, DESIGN, TENDERINDG, AN SUPERVISION OF CONSTRUCTION China was not yet equipped with modern industries for highway planning, design, or construction in 1992, and the massive expansion of highway construction engendered countless challenges. While the problem- solving capacities of its civil works industries, fueled by vast sums of money, and assisted in some key aspects by the international community, rose to meet the challenge of one of the largest highway building programs ever undertaken anywhere, the process of transition of this sector to a competitive market-based economy is still a work in progress. Today, the industry – in its various facets of design, tendering, contracting, supervision and quality control – still lingers to a degree in a
‘dual economy
’structure: alongside a modern industry with world-class capabilities, there remain many vestigial enterprises that have not adapted, sustained for now by state subsidies in one form or another that distort market competition.
International Competitive Bidding was introduced under World Bank financed projects from 1985 and competitive tendering of one form or another (whether local or international) has since grown to supplant direct labor (
‘force account
’) for most road construction projects.
Construction bureaus were separated from the governmental roads authority (Ministry of Communications, MOC, at the central level, and the Provincial Communications Departments, PCDs, at theprovincial level), and over time many have been reorganized (at least ostensibly) as financially autonomous corporations.
Competition has been actively promoted. While there was a vast expansion of demand for road construction, supply was also greatly expanded by encouraging participation of construction enterprises from railways and other sectors in road construction. Hundreds of construction enterprises with modern equipment are now said to be qualified to construct expressways.
FIDIC contract structures and conditions were
introduced and broadly adopted from the early
1990s, but its application is still evolving, with some
important modifications. While there has been growing
independence of the contractors from the highway
administration, there is as yet no independent supervision
industry. The independence of the Resident Supervising
Engineer (who is selected by competition) is constrained
(at least in the case of expressways) by a higher Chief
Supervision Engineer, who, together with his staff, is appointed by and answers directly to the Employer. The independence of contractors is also evolving, due to their traditional linkage to the government a state owned enterprises (SOE) under the centrally planned system, and is being addressed as part of the SOE reform and introduction of bankruptcy law.
While quality of construction for arterial highways procured under ICB contracts is tightly supervised, there have been significant quality problems to be overcome even under ICB contracts. One of the causes for the persistent quality problem has been the very low bid prices offered by quazi SOE contractors. To address this problem, following collapse of some bridges in 1999, new laws were passed placing lifetime responsibility on designers and contractors for faulty design or construction.
The problem of under-design of pavements – to meet the official legal limit rather than the actual much heavier loadings – has so far defied resolution, with the result that China will soon be facing large outlays for pavement strengthening that could have largely been deferred by several years at low marginal cost. By contrast India has tackled this problem by designing pavements for actual axle loads as determined from load surveys.
Today China has 240 design institutes that can design any highway short of expressway standards and 79 design institutes that are qualified to design expressways. The total technical staff is said to number more than 60,000 engineers.
A RE THERE POTENTIAL LESSONS LEARNED FOR I NDIA’S HIGHWAY SECTOR DEVELOPMENT?
Required expansion of resources for highways development. After under-investing in highways for decades, China increased its allocations for highways by a factor of nearly 40 times over 1991-2002, from about US$1 billion to 38 billion, or 3.1% of GDP in 2002.
Similarly, large increases in funding for highways in India would be necessary to modernize its highway networks on a comparable scale.
Source of finance. While China raised some $11 billion from private investors in highways, this amounted to less than 10% of the total investments. However, a recent study by the World Bank
7suggests that the better established capital markets and associated legal infrastructure in India offer superior prospects for private participation in highway finance. Moreover, the arterial networks which are yet to be built in India may provide attractive opportunities for Private-Public Partnerships, if appropriately structured and managed. The World Bank and the Asian Development Bank (ADB) have been asked to support the national highway authority of India in establishing a major PPP program to tap private capital markets to augment public funding for highways, and the prospects appear good. However, for this to be realized, substantial increases in state funding of highways will be required to provide the public share for a massive expansion of the total program, even if the public contributes the lesser share. Public
participation up to 40% of construction costs should
7
World Bank, “Private Finance of Highways in India: An Assessment” South Asia Energy and Infrastructure Unit (SASEI) (January 2004a).
support a substantial PPP program of highways development.
8Cost recovery: tolls, taxes, and other road user charges. While China has not yet implemented a significant fuel levy and has placed reliance instead on direct tolling as the primary source of cost recovery to meet debt service and dividends on private equity, it is as yet unclear whether this strategy will ultimately prove successful, and, if so, in what time frame. What is already clear is that the tolls and the proliferation of toll collection stations have caused substantial economic and financial distortions from under-utilization of new high standard highways and continued congestion of existing lower- standard but untolled routes. In this context, India should avoid repeating China
’s mistakes in this respect and choose a more efficient way of effecting cost recovery. Until such time as revolutionary new technologies may be invented that permit tolling of all highways (or any chosen sub-set thereof, separately for each type of vehicle), India
’s current choice to place primary reliance on fuel levies (the central road fund), complemented by direct tolling only where the demand for the tolled facility is highly inelastic, is the appropriate one. A study of India
’s policy options for comprehensive road user charges encompassing economic as well as financial dimensions has recently been undertaken by the World Bank.
9No similar study of China
’s user charges policy options was uncovered during the preparation of this paper.
Choice of investment priorities and design standards. China chose to give first priority to development of its arterial networks, and allocated 60% of a vastly expanded road sector budget for more than a decade to achieving that outcome. Moreover, for the arterial networks it chose high design standards, including access control features, from the earliest stage of construction, resulting in high initial costs. India
’s decision makers have until now made very different choices, choosing first to emphasize feeder networks linking local markets with the low cost all-weather access, and only in 1998/1999 started the National Highway Development Project - a program to four-laning about 13,000 km of its core national highway network, without limited access features. We have seen no systematic quantitative analysis to justify the strategy in either country, but Indian officials have commented that the latter choice was dictated in part by the difficulties in India of securing the right-of-way to permit higher standards, including access controls, and in part by budgetary constraints. Unfortunately, recent road travel in India has revealed that the issue of mixed traffic remains a major problem (generating both congestion and accidents) on those widened roads where access has not been restricted, and subsequent upgrading will be more costly than it would have been if done originally. At
8
In December 2003, there were press reports that the Government had decided to limit the public participation to 25% of construction costs. We understand that the proposal has since been withdrawn.
9
World Bank, “Highway Finance in India: Policy Note,
“South Asia Energy and Infrastructure Unit (SASEI)
(January 2004b).
the opposite extreme, in China there are reportedly many segments of costly access-controlled facilities that have limited traffic and may remain underutilized for years, even if the toll diversion is eliminated. The optimal solution likely lies somewhere between the two extremes chosen by India and China, and will often vary from segment to segment of the network.
What is striking is that this problem is one that can be quantitatively analyzed with time staging options for alternative design standards, using the planning tools already available in both countries.
The lesson in this case is that the choice of design standards should be properly analyzed and determined on a project-by-project basis.
RAILWAYS
Comparative financial and operational performance.
The total transportation output (measured in
“equated units
”= passenger km+ton km) of China Railways (CR) was about two and half times that of Indian Railways (IR) in 1992 as well as in 2002. Over this decade, the performance of CR has come to surpass in most dimensions that of IR by a wide margin, including:
Network length and standards
Realized throughput capacity
Labor and equipment productivity (locomotives, wagons, coaches)
Maintenance of assets
Financial profitability
Self financing capability through rail construction surcharge
Restructuring, including separation of non core business and introduction of incentives for managers.
A summary of reported financial results for IR and CR is given in table 2. The operating ratio for IR is shown to have deteriorated from 0.90 in 1991/92 to 0.96 in 2002.
The operating ratio for CR is much healthier at 0.74 in 2002 (based on operating revenue plus construction surcharge).
It is to be noted that IR
’s operating ratio of 0.96 is substantially understated, as the provision of depreciation is well below actual requirements. If IR were to make adequate provision for annual asset renewal, a fortiori if it were to make adequate provision for the large backlog of overdue equipment and track renewals, as well as pension accruals, in normal commercial accounting term, it is very likely that IR would be a heavily-loss-making entity – in fact one well along the path toward bankruptcy, if it were not state owned.
On the expenditure side, IR
’s staff costs account for 53% of working expenses, while on CR these costs are only 25%. It is also noted that all a small portion of the passenger services that dominate IR
’s operations are loss-making. The most extreme case is the
‘ordinary stopping trains
’where the cost recovery is estimated to be less than 30% while these consume scarce line capacity.
Investment and financing. In the period 1992-2002 the investment on IR and CR was US$17.3 and US$85 billion respectively. China has a system of levying a Construction Surcharge on freight tariff. The proceeds from this are utilized for investments in construction of new lines with the approval of the Planning Commission and the State Council. Further, CR
’s operating ratio is healthier than that of IR leading to surplus that has been used for investment. In the five years to 2002, 57% of investments on CR were funded by internal accruals (including construction surcharge) as compared with 35%
on IR. The rest of the funding on CR was from borrowing (32%) and other sources including government (11%).
IR obtained remaining investment funding from market borrowing (31%) and government (34%). CR pays taxes on profits.
Table 2: Financial Results for IR and CR, 1991/2-2001/2
INDIA CHINA
1991-92 2001-02 Ratio 1991-92/
2001-02
1992 2002 Ratio
1992-2002
Employees total (million) 1.65 1.51 0.91 3.41 1.76 0.51
Operational employees (est. million) 1.42 1.3 0.91 2.04 1.39 0.68 Output per operational employee 1000
equated units 402 648 1.61 728 1,385 1.90
Transportation revenue (billion) INR 137 INR 378 2.76 RMB 69.9 RMB 142.0 2.96
Operating expenses & pensions (billion) INR 104 INR 343 RMB 24.6 RMB 112.0
Depreciation INR 20 INR 20 RMB 13.5 RMB 22.3
Total working Expenses including
depreciation and pensions INR 124 INR 363 2.92 RMB 35.8 RMB 134.3 3.75
Working ratio % 0.76 0.94 0.35 0.62
Operating ratio % 0.90 0.96 0.51 0.74
H OW DID C HINA R AILWAYS ACHIEVE HIGHER OUTPUT AND PRODUCTIVITY?
Physical features. In China, railways has been growing rapidly, and consequently much of its system is new, incorporates higher design standards, has high service reliability and requires less maintenance and less downtime. Moreover, maintenance of older assets is also performed in a timely manner to high standards, so that equipment downtime is low and full productivity is generally sustained. IR, on the other hand, has relatively older assets that, even when new, did not incorporate performance standards that have since become industry standards. Furthermore, many of its assets (including way and structures, locomotives, wagons, and coaches) are not always in a satisfactory state of repair. Speed restrictions, failures of rolling stock and infrastructure affect not only the productivity of the particular asset, but, given system interdependencies, also propagate shock waves and reduce the throughput capacity of broader network segments.
Institutional factors - Commercial objectives and competition. Although China
’s national railways, like Indian Railways, are still part of the Ministry of Railways (MOR), CR has placed increasing emphasis on commercial focus and financial performance. Increase in passenger fares to achieve financial viability for passenger service was an important step. From 1999, Chinese MOR introduced an assets operation liability system (AOLS) under which MOR entered into management contracts with the 14 Regional Railway Administrations (RRAs), which are engaged in a closely monitored competition, with clear benchmark performance indicators, management in centives (both positive and negative) to encourage profitability rather than physical targets. The best performing managers receive significant financial and other incentives, while poor performers are quickly identified and removed.
CR has undergone major restructuring since 1999, a vertical dis-integration that has separated non- core activities and cut CR staffing rosters by half, down to 1.7 million employees. In accordance with modern railway management structures in almost all countries today, many of CR
’s former social services (education and health services) have been divested, as have 38 construction units, 4 railway design units, and extensive manufacturing facilities (for locomotives, coaches, wagons, signaling and communications equipment, and track components). In addition, in a first step to deal with non-economic branch lines, about 100 such line segments have been separated from main lines on an accounting basis. Three special purpose companies have also been created to handle containers, special cargo (oversized and perishable cargos), and Post and Parcels.
The advent of the local and joint venture railways under separate management from MOR could ultimately prove a stepping stone in the direction of opening the railway operations to competition, and a new law has been passed to permit foreign investment in China
’s railway sector, in accordance with the World Trade Organization articles.
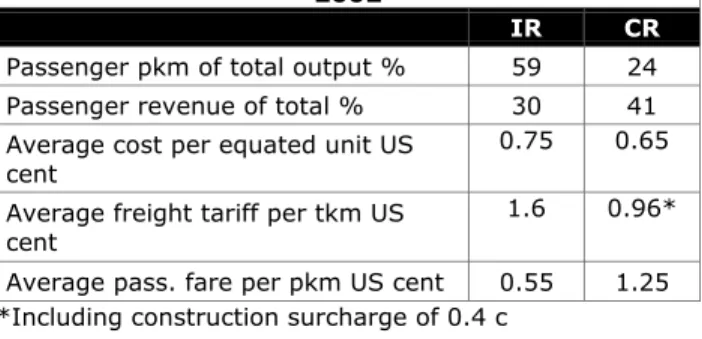
Table 3. Cost and Fare Structure for IR and CR, 2002
IR CR
Passenger pkm of total output % 59 24 Passenger revenue of total % 30 41 Average cost per equated unit US
cent
0.75 0.65 Average freight tariff per tkm US
cent
1.6 0.96*
Average pass. fare per pkm US cent 0.55 1.25
*Including construction surcharge of 0.4 c
CR has managed passenger business quite differently – cross subsidy from freight traffic to passenger traffic, while still prevailing in IR, has been all but eliminated in CR. Till the late 1980s, government controlled tariffs did not cover cost of passenger services. In order to minimize losses CR kept the volume of passenger business low. The seats on trains were rationed and prospective rail passenger had to wait weeks for a seat allocation. With the transition to market economy it was apparent that this situation would not be sustainable. To help address this problem, the Chinese Government decided to allow CR to substantial fare increases to cover costs plus an element of profit.
Passenger services have been separated on an accounting basis. Once this was achieved, CR then started increasing capacity for passenger trains. In the decade under review CR
’s passenger throughput (pkm) increased by 58% and the revenue by 130%. The table below shows the cost and fare structure for 2002. It is significant that unit cost per equated traffic unit on CR is 15% lower than that on IR and freight tariff on CR is 30% lower than that on IR, while the average passenger fare on CR is almost twice the average cost per equated traffic unit. Significantly, CR
’s ratio of revenue per passenger km to ton km, which had been less than 1 in 1992, stood at 1.3 in 2002. For Indian Railways, this ratio stood at only 0.34.
L ESSONS LEARNED FROM C HINA R AILWAYS
CR
’s improved performance can be attributed largely to six interrelated groups of factors:
Better focused, less conflicted objectives of the government owner, which is seeking an increasingly market-based commercial determination of price and outputs, relatively free of unprofitable public service obligations (PSO) and employment generation demands, and is willing to grant railway management related autonomy to achieve the agreed objectives, together with the associated accountabilities.
Senior management appeared to have strong commitment to reform to achieve efficiency and profitability, backed by strong individual and collective incentives.
Undertaking large scale restructuring, including separation of non-core activities and outsourcing.
Introduction of quasi-competition in rail operations (benchmarking of RRAs)
Superior financial management, including at least five
key facets: (i) Willingness of the government to accept
market-based pricing principles and output decisions for passenger as well as freight transport; (ii) implementation of modern accounting/information systems on costs and profit/loss of specific lines of business, services, and facilities; (iii) better maintenance of assets; (iv) application of available investment funds to most productive uses; (v) availability of larger investment budgets; and
Introduction of privatization through local railway joint ventures and corporatization with sale of shares in existing railway units (including listing in the New York as well as Hong Kong stock exchanges).
What Did China Railways Not Do?
CR did not develop sufficient capacity for freight transport in time to meet the demand from increased imports and domestic consumption. CR is now struggling to keep up with demand for freight transport.
CR has not created an enabling environment for attracting private capital. In fact, recently it cancelled the existing system of private ownership of freight wagons. It has thus missed an opportunity of sourcing private capital for rolling stock that would have helped alleviate the current wagon shortage.
Unlike IR (in the case of Concor), CR was slow in providing enabling environment for movement of containers by rail. As a result most container traffic in China moved by road. CR has recently established a company that would focus on rail transport of containers.
Although CR has taken several steps to separate its non core business and has been formulating plans for restructuring for some years, it has not yet been able to establish a road map for separation of ministry functions (policy and regulation) from the operational railway responsible for the enterprise.
A RE THERE POTENTIAL OPTIONS FOR I NDIA’S RAILWAYS DEVELOPMENT?
IR is facing the same problem that railways in many other countries have had to face: a loss of monopoly position, and with it the need to adapt to a competitive environment. IR has been losing market share to road transport in both passenger and freight services. Unless it improves its commercial orientation, IR
’s position in freight will further erode as India upgrades its highways network, and its premium passenger services may lose to an increasingly competitive aviation industry. The only unique aspect of IR is its scale of operations and the sheer size of its labor force. These make IR
’s adaptation more difficult, but not less urgent. In comparison, CR has been confronted with the similar changing environment, but has begun its process of transformation to meet the challenges, with measurable initial results.
To realize IR
’s full potential contribution to India
’s transport system and economic growth, substantial investment will be required to fund track modernization, capacity expansion and safety enhancement. However, as the CR experience shows, such investment needs to be undertaken in conjunction with pragmatic actions by the government and IR to address the railways
’institutional performance issues. GOI needs to signal its strategy for IR. Several of the changes necessary to allow IR to compete effectively in the transport market, and
to fulfill the railways
’potential, are outside the direct control of Railway management and requires strategic policy direction from GOI. These include the phasing out of cross-subsidies between freight and passengers, and between the core commercial railway and the network of non-commercial lines and services.
Rightsizing of the labor force and de-politicization of investments will also require a clear expression of political will by GOI. The GOI has to decide that it desires IR to function as a commercial entity.
In particular, the Government, as Owner, needs to:
resolve the conflict between the objectives it has imposed on IR – on the one hand, the ostensible obligation to operate as a commercial organization, and on the other, the very real social obligations, including the loss making ordinary rail passenger services (although very often these services could be provided far more efficiently and to higher standard by road transport), maintenance of uneconomic levels of employment and a long list of politically/socially motivated investments that continue to divert scarce investment resources from profitable investments critically needed to reduce congestion and improve service standards on the arterial mainlines;
refrain from interference in the day-to-day management of railway operations, but, in return for the granting of management autonomy, impose an effective system for contracting performance targets with IR Management, monitoring them in a benchmarking competition, and holding Management accountable, including significant positive incentives for managers and labor forces.
IR Management and Labor could:
(a) In terms of its operations:
Recognize that the performance of IR in terms of productivity of labor, equipment, and infrastructure is a fraction of the productivity of CR and other well run railways;
Invest in areas that would help increase utilization of existing assets, reduce unit costs and increase profit margins, e.g., technology improvement in signaling, more powerful locomotives, modern train control systems, IT, etc.;
Invest in improving maintenance of infrastructure and rolling stock so that these are used to full potential and loss of capacity due to failures and speed restriction is reduced;
Invest in improving quality of service, both for freight and passenger services in order to compete for high margin traffic; and
Invest for capacity enhancement on corridors where additional traffic is expected.
(b) In terms of its management structure
recognize that the prolonged period of protection of IR from inter-modal competition (road and airlines) will be coming to an end in the near future;
restructure IR, separating non-core functions (not
only social services but also manufacturing
services to create a competitive railway supply
industry) and discarding IR
’s traditional functional
organization in favor of a modern lines-of-business
structure, centered around the major clients, with
the management of each unit focused on meeting client service quality requirements, costs, pricing, and net revenues to sustain IR in future years;
review passenger services (especially ordinary trains) and fare structure to reduce cross subsidies and reduce freight rates to grow freight business;
•introduce a modern cost accounting and information system that would be able to measure performance and profitability of IR as a commercial entity;
implement a
‘benchmark competition
’system across the 16 regional administrations of IR based on comparative performance of key indicators, particularly, profitability;
prepare a long-term (10-15 year) business
strategy and associated investment plan to enable IR to better meet profitable market demands and shed unprofitable services and facilities; and
implement a new system of capital budgeting and investment prioritization based on the Net Present Values using the opportunity cost of capital in the marginal application that must be forgone.
The changing operating environments confronted by CR in the late 1990s and by IR now are not very different. The experience of CR
’s reform since 1999 suggests that substantial progress is possible, provided that there are serious commitment by the leadership in both government and railway management, and that an accommodation acceptable to the millions of affected laborer is found.
A NNEX : C OMPARATIVE RAILWAY ASSETS AND PHYSICAL PERFORMANCE (1992 AND 2002) Comparative network assets and performance of China Railways (CR) and Indian Railways (IR) at 1992 and 2002 are given below.
INDIA CHINA
1991-
92 2001-02 Ratio
91-92/
01-02
1992 2002 Ratio
1992/2002
Population million 846 1,000 1.18 1,171 1,300 1.11
Railway route km Broad Gauge Double track km Electrified km
62,458 35,109 14,605 10,809
63,140 45,099 16124 (25.5%)
16001 (25%)
1.01 1.28 1.10 1.48
58,100 NR53565 13658(25.
5%) 8434(15.7
%)
71,897*
NR 59530 23,058(38.
7%) 17,409(29.
2%)
1.24 1.11 1.69 2.06
Railway track km 109,338 109,227 1.0 106,184 127,949 1.20 Automatic Block track km 2,594 3,571 1.38 11,287 20,682 1.83 Passengers carried million
(non Suburban) 4,049
(1637) 5,093
(2094) 1.26
(1.28) 997 1,056 1.06
Average per capita trips per
year total 4.78
(1.93) 5.09 0.85 0.82
Passenger km billion 314 493 1.57 315 497 1.58
Passenger originating
market share % 20 15 11.6 6.6
Av. Trip length Total
non-suburban km 77.7
153.4 96.9
191.6 1.25
1.25 316 471 1.49
Freight originating tons
million 360 522 1.31 1,576 2,043 1.30
Freight tkm billion 257 336 1.31 1,157 1,551 1.34
Average haul distance km 714 643 0.90 734 759 1.034
Freight originating ton
market share % 45 30 15.1 14.6
Equated traffic units 571 829 1.45 1,472 2,048 1.39
Source: Chinese Railways CR Facts 2002 Edition, Indian Railways Year Book 2001-02 and 1992-93