• Keine Ergebnisse gefunden

Behavior in Rent-Seeking Contests:

N/A
N/A
Protected

Academic year: 2021

Aktie "Behavior in Rent-Seeking Contests:"

Copied!
152
0
0

Wird geladen.... (Jetzt Volltext ansehen)

Volltext

(1)

Behavior in Rent-Seeking Contests:

The Role of Beliefs, Bounded

Rationality, Envy, and Group Identity

Inauguraldissertation zur Erlangung des Doktorgrades

der Wirtschafts- und Sozialwissenschaftlichen Fakultät der Universität zu Köln

2016

vorgelegt von Marcin Waligora, M.Sc.

aus Poznan (Polen)

(2)

Referent: Professor Dr. Bettina Rockenbach

Korreferent: Professor Dr. Dirk Sliwka

Tag der Promotion: 21. Dezember 2016

(3)

A CKNOWLEDGMENTS

This thesis would not have been possible without excellent supervision by Bettina Rockenbach, who constantly advised and encouraged me throughout the three years of our joint work and experimental research on rent-seeking behavior. Thank you for all the support.

I am also indebted to other members of the thesis committee: Oliver Gürtler and Dirk Sliwka.

I thank my co-author and friend, Uta Schier, not only for very smooth cooperation, but also for being a wonderful companion during my doctorate studies.

I was lucky to work with great people. My sincere thanks to my friends and colleagues for their help and many fruitful discussions, as well as for a friendly working atmosphere: Suparee Boonmanunt, Lea Cassar, Agne Kajackaite, Thomas Lauer, Mark Pigors, Anne Schielke, Sebastian Schneiders, Sebastian Tonke, Lukas Wenner, Christoper Zeppenfeld, Jarid Zimmermann, and Nina Zimmeramann.

Also outside of academia, my dear friends stood by my side and supported me in my moments of doubt. Sanja Kerosevic and Mike Grzeszik – thank you.

I am deeply grateful to the Cologne Graduate School in Management, Economics and Social Sciences (CGS) for financial support through the scholarship program and to Dagmar Weiler for great organizational and moral support. The project Envy in Dynamic Contests (Chapter 6) was funded by the Center for Social and Economic Behavior at the University of Cologne, as well as by the CGS.

Finally, I thank my mother, who has always believed in me more than I have.

(4)
(5)

C ONTENTS

Chapter 1: I NTRODUCTION ... 1

1.1. The economic research on rent-seeking ... 2

1.2. The scope of the thesis and its findings ... 3

1.3. Scientific relevance and contribution of the thesis ... 5

Chapter 2: B ELIEFS AND B EHAVIOR IN T ULLOCK C ONTESTS ... 7

2.1. Introduction ... 7

2.2. Our research agenda ... 9

2.3. Experimental game, design and procedure ... 11

2.3.1. Experimental game ... 11

2.3.2. Experimental implementation ... 12

2.3.3. Experimental procedure ... 13

2.4. Beliefs and behavioral responses ... 13

2.4.1. Accuracy of beliefs ... 14

2.4.2. Myopic beliefs ... 14

2.4.3. Behavioral response to beliefs ... 15

2.4.4. Observed responses to beliefs in the light of QRE-approach ... 18

2.5. The role of limited computational abilities ... 19

2.6. Beliefs and Behavior in Asymmetric Contests ... 21

2.6.1. Main behavioral regularities ... 22

2.6.2. Matching pattern under cost asymmetry ... 24

2.7. Conclusion ... 26

2.8. Appendix A. Additional tables and figures ... 28

2.9. Appendix B. Contest behavior under Fehr-Schmidt preferences (1999) ... 37

2.10. Appendix C. Decision screens and experimental instructions ... 38

Chapter 3: O N THE R ELUCTANCE TO P LAY B EST R ESPONSES IN T ULLOCK C ONTESTS ... 43

3.1. Introduction ... 43

3.2. Research questions and related literature ... 45

(6)

3.4. The experiment ... 47

3.4.1. Experimental implementation ... 47

3.4.2. Experimental treatments ... 48

3.4.3. Hypotheses ... 50

3.4.4. Procedure ... 52

3.5. Results ... 52

3.5.1. Overbidding and overspreading ... 52

3.5.2. The effect of the matching protocol ... 53

3.5.3. Difference-in-differences ... 57

3.5.4. The effect of limited computational abilities ... 58

3.5.5. What if not best responses? ... 60

3.6. Discussion and conclusion ... 60

3.7. Appendix A. Additional tables and figures ... 62

3.8. Appendix B. Decision screens and experimental instructions: P ARTNER _C ALCULATOR treatment. ... 67

Chapter 4: P USHING THE B AD A WAY : R EVERSE T ULLOCK C ONTESTS ... 72

4.1. Introduction ... 72

4.2. The theoretical framework of reverse Tullock contests ... 73

4.3. Related literature ... 75

4.4. The experiment ... 75

4.4.1. The experimental design ... 75

4.4.2. Treatments and hypothesis ... 76

4.4.3. Sample Size ... 77

4.4.4. Procedure ... 78

4.5. Results ... 78

4.6. Conclusion ... 80

4.7. Appendix A. Additional treatment T2 ... 81

4.8. Appendix B. Additional tables and figures ... 83

4.9. Appendix C. Experimental instructions. Treatment T1 (translation from German) ... 85

Chapter 5: H ETEROGENEOUS E FFECT OF G ROUP I DENTITY IN C OLLECTIVE R ENT - S EEKING ... 90

5.1. Introduction ... 90

5.2. Related literature ... 91

(7)

5.3. The experimental design ... 91

5.3.1. The experimental set-up ... 92

5.3.2. Hypotheses ... 92

5.3.3. Procedure ... 93

5.4. Results ... 93

5.5. Conclusion ... 97

5.6. Appendix A: Written instructions for subjects (translation from German) ... 98

Chapter 6: E NVY IN D YNAMIC C ONTESTS ... 102

6.1. Introduction ... 102

6.2. Related literature ... 104

6.3. The theoretical framework ... 106

6.3.1. The two-battle contest ... 108

6.3.2. Equilibrium analysis under standard preferences ... 108

6.3.3. Other-regarding preferences: intuition ... 109

6.3.4. Equilibrium analysis under symmetric envious preferences ... 110

6.3.5. Efficiency of equilibrium behavior ... 113

6.4. The experiment ... 115

6.4.1. The experimental implementation ... 115

6.4.2. Treatments ... 116

6.4.3. Hypotheses ... 117

6.4.4. Experimental procedure ... 118

6.5. Results ... 119

6.5.1. Behavior in the second battle ... 119

6.5.2. Behavior in the first battle ... 122

6.5.3. Beliefs and behavior in static Tullock contests (S TATIC treatment) ... 124

6.5.4. Efficiency of the rent-seeking ... 124

6.6. Conclusion ... 126

6.7. Appendix A: Proofs ... 127

6.8. Appendix B: Additional figures ... 127

6.9. Appendix C: Theoretic prediction under relative payoff maximization. ... 129

6.10. Appendix D: Computer screens and experimental instructions. ... 131

R EFERENCES ... 136

(8)
(9)

1. Introduction

Chapter 1:

I NTRODUCTION

Rent-seeking is omnipresent. Across different domains of economic and social activities, people compete against each other to obtain a favorable position that brings certain monetary or non-monetary advantages. However, these advantages are not generated in the course of competition, but are rather induced by the re-allocation of resources already present in the economic system. This means costly efforts of rent-seeking activities are economically not productive from a societal perspective.

Rent-seeking is not only often observed in markets (e.g., advertising campaigns), but also in politics (e.g., electoral campaigns, lobbying), in law practice (e.g., litigation) and in sports (see Szymanski 2003 for an extensive overview). Not all rent-seeking is legal (e.g., bribing and vote buying).

Moreover, rent-seeking competition has become more and more frequent in modern economies. It is often organized in forms of ‘beauty contests’. In beauty contests, an organizer invites proposals that are costly to prepare for participants. In many industries, such as consulting, construction or architectural design, such procedures have become common.

Similarly, in many prestigious sporting events, like the Olympic Games and the Soccer World Cup, the host is chosen through a beauty contest between cities or countries.

The social costs of rent-seeking are difficult to estimate. Scarce empirical literature is often based on only fragmentary data. Still, present analyses confirm that rent-seeking activities can be very costly (Angelopoulos et al. 2009) and can hamper economic growth (Murphy et al.

1993). One can argue that resources spent on rent-seeking activities are not necessarily wasted,

per se – it is possible that they create new jobs, which may have some positive economic

consequences. Still, it is very likely that this is not the most efficient way to spend resources.

(10)

1. Introduction

Finally, rent-seeking produces inefficiencies in modern job markets. We live in “winner- take-all” societies (Frank and Cook 1995), in which many job markets are characterized by the following remuneration structure: A relatively small number of top performers are paid very well and get additional non-monetary benefits, such as fame or prestige. A large proportion of mediocre-performers are, however, paid poorly and work under precarious conditions. In such markets, a promise of big success attracts a lot of young, talented people who decide to receive an education in a certain domain. Since many of them are deemed to fail, they often end up in jobs below their qualifications and potential. Entertainment (film industry in particular), sports and the arts are the traditional examples of such job markets. A closer look at the higher education and research industries reveals that we face a very similar structure of incentives and a similar disparity between top-performers and almost top-performers in academia. This inefficiency of the misallocation of talents (Frank and Cook 1995, pp. 9-10) may be even more tremendous than the one described earlier. However, it is extremely difficult to estimate the magnitude of the phenomenon and the monetary consequences of wasted talents and skills.

1.1. The economic research on rent-seeking

Given how common, costly and inefficient rent-seeking behavior can be, there is no doubt that the topic deserves economists’ attention and it is not surprising that it has been studied in economics for about fifty years now. Economic research on rent-seeking was pioneered by Tullock (1967), Krueger (1974) and Posner (1975). Tullock (1967) was the first who recognized that the endogeneity of political decisions on creating monopolies and tariffs increases social costs of such regulations beyond the Harberger’s triangle because some resources are wasted in the contest between economic actors aiming at becoming the monopolist. Moreover, it became rapidly clear that similar situations are frequent in economic and social interactions and that the concept of rent-seeking has a much broader application than the context of striving for a monopolistic position (Congleton et al. 2008b, p. 1).

Economic research on rent-seeking behavior has been accelerated by the seminal work of Tullock (1980), who provided a simple analytical framework of rent-seeking contests. 1 First, it reflects a realistic assumption that the winner in such settings is selected by a combination of

1 Note that the Tullock (1980) contest is used not only in rent-seeking settings. However, it is its most important application. Therefore, it is common to use the terms “Tullock contests” and “rent-seeking contests”

interchangeably. So do I in this thesis.

(11)

1. Introduction

merit and luck. Second, its analytical simplicity is a great asset that allows for a tractable game- theoretic analysis and numerous theoretical extensions. Tullock’s (1980) framework provides researchers with neat and clear game-theoretic predictions. In most cases, a Tullock contest is characterized by a unique Nash equilibrium in pure strategies (Perez-Castrillo and Verdier 1992;

Szidarovsky and Okuguchi 1997).

Empirical investigations of rent-seeking are hampered by the difficulty of obtaining reliable data. In many contexts mentioned above, no data is available to research, particularly due to its nontransparent nature – e.g., in lobbying, litigation or bribing. This is why economic experiments offered an appealing way of providing empirical data. The first experiments on rent- seeking were conducted in late 1980s (Millner and Pratt 1989, 1991). Since then, rent-seeking behavior has been studied in economic laboratories across the world. This led to extensive experimental literature on the topic (see recent surveys by Dechenaux et al. 2015 and Sheremeta 2013). Even though economic experiments have substantially advanced economists’

understanding of rent-seeking, several robust results from the laboratories remain puzzling.

Overbidding (i.e., subjects invest significantly more than the Nash equilibrium predicts) and overspreading (i.e., subjects frequently use almost the entire strategy space) have gained the most attention (Sheremeta 2013, 2014).

1.2. The scope of the thesis and its findings

This thesis consists of five studies on rent-seeking and contributes to the behavioral and experimental analyses of this phenomenon. Using experimental methods and insights from behavioral economics, I test theoretic predictions of standard economics for rent-seeking settings and complement standard models by behavioral extensions.

Chapter 2 (Beliefs and Behavior in Tullock Contests) is joint work with Bettina

Rockenbach and is the first systematic analysis of beliefs and behaviors in experimental Tullock

contests. In a series of experiments, we investigate how subjects build their beliefs in repeated

contests, and, more importantly, how they respond to beliefs. We enrich the standard

experimental design with the procedure of incentivized belief elicitation. This allows us to test

the theoretical prediction in new dimensions. Our experimental data provides clean evidence for

myopic belief formation and thus yields a strong justification for a common assumption in

contest models. Moreover, we investigate how subjects respond to expected off-equilibrium

strategies of the competitor. We find that best-responding is rare in general. Instead, subjects

(12)

1. Introduction

tend to match their belief with their own investment. This leads to a linear response function, which substantially differs from the game-theoretic prediction, and causes the well-documented phenomenon of overbidding. We consider several possible explanations for the revealed behavioral regularities. We show that neither limited computational abilities, nor random mistakes, nor inequity aversion drive the pattern. An analysis of behavior in asymmetric contests brings us to the conclusion that the desire to win is a dominant motive for “matching-behavior”.

Chapter 3 (On the Reluctance to Play Best Responses in Tullock Contests) is joint work with Bettina Rockenbach. We investigate the effect of the matching protocol in repeated experimental contests on investment behavior. We test whether the rarity of best responses in Tullock contests is due to the inter-temporal dynamics between partners in repeated contests.

Since subjects’ computational limitations might impair the implementation of intended strategies, we also manipulate across treatments the saliency of best responses. We find that the matching protocol itself has no effect on the willingness to best-respond. This holds irrespective of whether best responses are made very salient to subjects or not. On the other hand, providing direct hints at best responses increases their occurrence, albeit to only about 20 percent.

Chapter 4 (Pushing the Bad Away: Reverse Tullock Contests), joint work with Bettina Rockenbach, is a study on behavior in reverse Tullock contests. While most research considers rent-seeking for achieving gains, we recognize that contests are often conducted for avoiding losses. We show that the equilibrium prediction under standard preferences is robust against such a variation. However, prospect theory (Kahneman and Tversky 1979) suggests that contests involving negative prizes may be fiercer than traditional contests with positive prizes. We test this hypothesis in a new experiment. We find that average investments in reverse contests are higher by 15 percent than in conventional contests. However, the effect is statistically not significant.

Chapter 5 (Heterogeneous Effect of Group Identity in Collective Rent-Seeking) investigates collective rent-seeking, in which groups instead of individuals compete against each other for a prize that is a public good for the winning team. The equilibrium analysis predicts that teams in such competition invest as much as individual players. However, Abbink et al.

(2010) show that investments in collective contests are much higher than in individual contests.

Moreover, the authors find that within groups, large differences in contributions are very

persistent. In a new experiment, I replicate Abbink et al.’s results regarding both overbidding

and behavioral heterogeneity. I explain the large and persistent within-group heterogeneity in

(13)

1. Introduction

behavior with the heterogeneous effect of group identity. Subjects identify themselves with their teams to very different extents. Those who report a strong attachment to their groups keep investing much, even though their team mates who do not report any attachment to the team consequently free-ride. This shows that group identity is an important driver of contest behavior.

Moreover, it demonstrates that group identity may have detrimental consequences in rent- seeking settings, as it boosts efforts of a wasteful nature.

Chapter 6 (Envy in Dynamic Contests), which is joint work with Uta K. Schier, is a theoretical and experimental study on the role of envy in dynamic contests. First, we conduct a game-theoretic analysis of a set-up with two battles, in which only the winner of both battles is awarded a prize. A tie in wins (1:1) leads to the prize not being awarded. We demonstrate that the equilibrium predictions under standard preferences, does not hold for subjects that dislike lagging behind; that is, subjects who are inequity averse. We show theoretically that envious losers of the first battle do not give up in the second battle and try to prevent the competitor from winning the prize. We test the theoretical prediction in a laboratory experiment and find clear evidence for envy-driven behavior. We observe that the first-battle-losers frequently do not give up in the second battle. As a consequence, in 30 percent of the cases the prize is not awarded to any contestant. This suggests potential for large inefficiencies.

1.3. Scientific relevance and contribution of the thesis

This thesis provides new results and insights on rent-seeking behavior relevant from both (economic) methodological and political perspectives. Therewith it advances the economic analysis of rent-seeking in two important dimensions.

From the methodological point of view, it contributes to a better understanding of

behavior in experimental contests. A profound understanding of motives, decision-processes and

goals in the lab is crucial for researchers to be able to interpret observed behavior correctly. The

thesis answers several questions important for researchers designing experiments on contest

behavior, for example: To what extent is the matching protocol important in repeated Tullock

contests? Is the assumption of myopic beliefs in repeated contests justified? Does a

computational tool help solve the problem of not following best responses? These insights might

be useful for future experimental studies on rent-seeking, given the increasing interest in

experimental evidence on contest behavior.

(14)

1. Introduction

From a policy perspective, the studies presented in this thesis help understand what drives competitive behavior in rent-seeking situations and, therefore, offer several implications for policy-makers designing contests. They provide at least partial answers to such questions as:

Why are tie-rules in dynamic contests important and should be chosen carefully? How large is the danger of collusion in rent-seeking contests? Are the contests organized to avoid bad outcomes different from contests organized to obtain a gain? Why can team contests between groups with a strong common identity be dangerous? Moreover, I consider not only conventional (i.e., individual and static) contests but also richer and more complex settings. Therefore, the findings presented in the thesis better reflect frequent examples of dynamic contests and contests between groups.

Chapters 2 contributes to a vivid discussion in the recent literature on the reasons for overbidding in experimental contests – the research question that has dominated the experimental investigation of rent-seeking in the last years. Bettina Rockenbach and I demonstrate the crucial role of beliefs in explaining overbidding. Anticipation of opponents’ aggressive behavior drives higher investments that ends up in well-documented overbidding. This result can be important for both researchers designing contests in the lab and policy-makers.

The data collected in the lab expands the research beyond theoretical considerations and proves that the standard game-theoretic analysis based on the homo oeconomicus paradigm requires behavioral supplements. On the one hand, I show that standard assumptions are not met:

Subjects’ rationality is bounded, they face difficulties with computing best responses, and they

are inequity averse. On the other hand, standard analysis misses important non-monetary

incentives, such as loss aversion, joy of winning, and group identity.

(15)

2. Beliefs and Behavior in Tullock Contests

Chapter 2:

B ELIEFS AND B EHAVIOR IN

T ULLOCK C ONTESTS

Joint work with Bettina Rockenbach

2.1. Introduction

Rent-seeking is frequent in politics, markets, sports, education, or in research. 1 It causes tremendous monetary and non-monetary costs and often leads to inefficiencies in resource allocations (e.g., Murphy et al. 1993, Stewart and Wu 1997, Angelopoulos et al. 2009). Tullock (1980) proposed a simple model of rent-seeking behavior that has become a standard analytical framework in economic research on contests. 2,3 Since observational field data on rent-seeking behavior are only rarely available, economists have turned to experimental methods to obtain controlled empirical evidence on rent- seeking behavior, extending the research beyond the theoretic considerations and models. More than 25 years of experimental investigation of rent-seeking (pioneered by Millner and Pratt 1989, 1991) has led to an extensive body of literature on experimental contests (see Dechenaux et al. 2015 for a comprehensive overview). In the face of a large number of studies, it is striking that some very robust phenomena of contest behavior observed in laboratories remain unexplained. The main, well-reported (and yet not fully

1 Konrad (2009) discusses a wide range of applications in more detail.

2 Earlier on, Tullock (1967) and Krueger (1974) already discussed economic consequences of rent- seeking.

3 Throughout the paper, the term “contest” refers to Tullock contests. For differences between Tullock

(16)

2. Beliefs and Behavior in Tullock Contests

understood) phenomenon is overbidding: Subjects invest systematically more than predicted by the theoretic equilibrium analysis (Sheremeta 2013). Researchers have been exploring several mechanisms that possibly drive this result. Among these, bounded rationality, utility of winning, other-regarding preferences, or probability distortions belong to the most widely considered. Yet in his survey Sheremeta (2013, p. 508) concludes that “it remains an open question as to whether some of these factors are correlated as if so, which are the most important ones.”

In this chapter we advance our understanding of contestants’ overbidding by providing the first study systematically focusing on contestants’ beliefs about competitors’ behavior and their responses to these beliefs. In a series of laboratory experiments on contest behavior with incentivized belief elicitation, we vary the salience of best-response behavior as well as the presence (and degree) of investment cost asymmetry between players. 4

Our findings are extremely clear. With regard to belief formation, we provide strong evidence that contestants hold myopic (Cournot) beliefs, i.e., they expect the opponent to invest as much as in the previous period. This pattern has been an implicit or explicit assumption in several previous studies, e.g., Fallucchi et al. (2013), Lim et al.

(2014), however, so far without any experimental support. Our main result, however, concerns behavioral responses to beliefs. In symmetric contests, we find that subjects predominantly invest as much as they believe the competitor does. This leads to systematic overbidding. We show that this is not an effect of limited computational abilities, as belief matching still prevails when subjects are equipped with a best-reply calculator. We can also exclude inequity aversion (Fehr and Schmidt 1999) in realized or in expected payoffs as an explanation for the observed behavior. Additionally, we show that (almost) linear response functions cannot be captured with statistical models involving noise, e.g., quantal response equilibrium (McKelvey and Palfrey 1995, Goeree et al. 2005). Finally, with a systematic analysis of contests with asymmetric investment costs, we show that belief matching is not driven by striving for equality in winning probabilities, but instead is in line with the desire to win. With an increasing cost

4 A very recent study by Sheremeta (2015a) also employs incentivized belief elicitation. However, both

the belief elicitation procedure and the focus of the paper are different from ours. We became aware of

Sheremeta’s study when completing our paper. Moreover, Herrmann and Orzen (2008) utilize the strategy

method (Selten 1967) in experimental contests, which, however, is a substantially different approach from

the direct response method in our experiment. See also discussion in Section 2.4.

(17)

2. Beliefs and Behavior in Tullock Contests

asymmetry, low-cost players more and more heavily exploit their advantageous position by bidding excessively more than needed to achieve equal winning probabilities, whereas high cost players are more likely to surrender.

The remainder of the chapter is organized as follows. In Section 2.2, we present our research agenda. Section 2.3 describes our experimental game and design. In Section 2.4, we report our results on elicited beliefs and behavioral responses to beliefs. In Section 2.5, we study the impact of the bounded computational abilities in experimental contests, and in section 2.6, we explore behavior in asymmetric contests. Section 2.7 concludes.

2.2. Our research agenda

Scholars have investigated several reasons for overbidding. In general, one can classify the examined explanations into those modifying subjects’ preferences and those allowing for subjects to make mistakes. Among the first category, social preferences (e.g., Herrmann and Orzen 2008), joy of winning (e.g., Sheremeta 2010) and evolutionary preferences (e.g., Hehenkamp et al. 2004) are most common. However, much attention is also devoted to the hypothesis that subjects make mistakes (see e.g., Potters et al. 1998). Sheremeta (2011) applies the Quantal Response Equilibrium (QRE) approach (McKelvey and Palfrey 1995) to fit the data from experimental contests and finds patterns in line with predictions of the QRE. Similarly, Lim et al. (2014) apply logit quantal responses to fit behavior in contest games with different numbers of players. The authors report that the average expenditure level does not depend on the group size. However, the expenditures are more dispersed in large groups. Lim et al.

link their descriptive observations to parameter estimates of the QRE-model and conclude that for larger groups the parameters depart further from perfect rationality.

Our research agenda is closely related to the stream of literature striving to explain overbidding in experimental contests. We provide new insights into rent-seeking behavior by investigating how subjects form their beliefs about the competitors’

behavior and how subjects respond to these beliefs. We can organize our research agenda

into three steps. In the first step, we extend the standard Tullock contest to include belief

elicitation. Two contestants, endowed with E tokens each, may buy tickets at a cost of 1

for a lottery with a winning prize of V. A contestant’s winning probability equals the

(18)

2. Beliefs and Behavior in Tullock Contests

number of one’s own tickets bought as a fraction of the total number of tickets bought by both contestants. In our experimental sessions, the same two contestants interact repeatedly over 20 periods. Our B ASELINE treatment extends this standard design through incentivized belief elicitation: Contestants are asked to guess the other contestant’s investment and earn more money when their guess is more accurate. We find that subjects predominantly hold myopic (Cournot) beliefs: They expect the opponent to invest as much as in the previous period. The main finding, however, lies in the pattern of responses to beliefs: Subjects predominantly invest the amount they believe their competitor invests. A linear reaction function is in stark contrast to the theoretic best-response function and results in overbidding (see Section 2.4).

In the second step (treatment C1), we investigate whether belief matching is caused by computational limitations. We modify our B ASELINE treatment by providing subjects with a computational tool, which allows for unambiguously identifying best responses (see Section 2.5). Yet we observe no difference in behavior as compared to the B ASELINE , either in the average investment levels or in the reaction functions. Thus, we can exclude limited computational abilities as a cause for belief-matching investments. We can also exclude that observed behavior is driven by inequity aversion (Fehr and Schmidt 1999) in realized or in expected payoffs, both in B ASELINE and in C1.

In the third step of our agenda, we introduce investment cost asymmetry between contestants to investigate whether matching investments on beliefs is driven by striving for equality in investments or for equality in winning probabilities. While in treatment C1 both contestants receive 1 ticket per token invested, the asymmetric treatments feature a low-cost and a high-cost player. The low-cost player receives 3 (in treatment C1.5), 2 (in treatment C2) and 4 (in treatment C4) tickets per token, while the high-cost player receives 1 ticket per token invested in C2 and C4 and 2 tickets per token in treatment C1.5. Thus, we vary the level of asymmetry, from relatively low to high. We find that in the asymmetric contests low-cost players exploit their advantageous position by investing even more than they expect from the opponent, resulting in very high winning probabilities. In contrast, as cost asymmetry increases, high-cost players are more likely to give in and not participate in the contest (see Section 2.6).

Table 2.1 presents an overview of our experimental treatments and their main

characteristics. In Section 2.3, we describe our experimental design in more detail.

(19)

2. Beliefs and Behavior in Tullock Contests

Table 2.1: Overview over the experimental treatments.

Treat- ment

No. of subjects

(indep.

observ.)

Belief elicit.

Computa-

tional tool Investment costs B ASE -

LINE 58 (29) Yes No Symmetry: Both players receive 1 ticket per token

C1 56 (28) Yes Yes Symmetry: Both players receive 1 ticket per token

C1.5 58 (29) Yes Yes

Low Asymmetry:

Low-cost player receives 3 tickets and high-cost player receives 2 tickets per

token

C2 60 (30) Yes Yes

Medium Asymmetry:

Low-cost player receives 2 tickets and high-cost player receives 1 ticket per

token

C4 60 (30) Yes Yes

High Asymmetry:

Low-cost player receives 4 tickets and high-cost player receives 1 ticket per

token

2.3. Experimental game, design and procedure 2.3.1. Experimental game

We design a laboratory environment that employs a two-player rent-seeking contest (Tullock 1980) for a monetary prize V. Assume that both contestants and have an endowment E and simultaneously invest in “lottery tickets” for the contest. For each unit invested, contestant receives lottery tickets 5 , = 1, 2 . If invests and the competitor invests , player wins the contest with probability:

= + (2.1)

and has a payoff of:

= = = 0

− + − (2.2)

(20)

2. Beliefs and Behavior in Tullock Contests

Player ’s best reply against contestant ’s investment is:

= − (2.3)

The unique equilibrium is symmetric with investments:

∗ = = ( + ) (2.4)

Therefore, in the symmetric cost case ( = > 0) , the unique Nash equilibrium under money-maximizing preferences is that both players invest one quarter of the prize, i.e.,

/4 (Szidarovsky and Okuguchi 1997).

2.3.2. Experimental implementation

In the experiment, we frame the game as a lottery. We choose an endowment of E=20 and a prize of V=20. Hence, in case of symmetric costs, in equilibrium both contestants invest 5. In addition to the decision on the investment in the lottery, subjects also have to guess what they expect the competitor to invest. We incentivize belief elicitation using a quadratic loss function. 6 Subjects can earn a bonus of up to 4 tokens in every round for their beliefs. The beliefs are rewarded according the following bonus function:

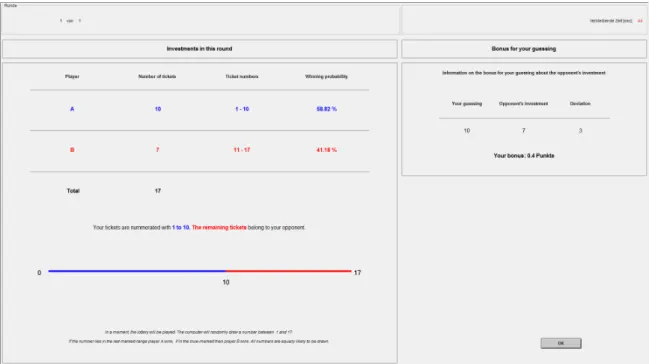
Bonus = max-0; 4 − 0.4(Belief − Actual investment) 8 . (2.5) Thereafter, subjects receive feedback about their own and their competitor’s decisions, and the resulting probabilities of winning are provided in numbers and represented graphically (as lengths of a segment) on the screen. 7 All bought tickets are numerated and subjects are informed which numbers correspond to their lottery tickets.

If no contestant buys any tickets, the lottery is not conducted and nobody wins the prize.

Otherwise, the computer randomly draws one of the purchased tickets. The ticket holder wins the lottery and receives the prize. Both contestants are informed about the winner of the lottery and their payoff.

6 For the advantages of the quadratic rules as compared to the linear ones, see e.g., Selten (1998) and Palfrey and Wang (2009). We are aware that there is no agreement in economic experimental methodology on whether to incentivize beliefs or not (see for example the recent survey by Schlag et al. 2015).

7 For translation of experimental instructions, see appendix C.

(21)

2. Beliefs and Behavior in Tullock Contests

Thus, the expected payoff (without a bonus for belief reports) of player with an investment of and a competitor’s investment of is given by:

Π = 20 − + + 20 (2.6)

In the experiment, the stage game is repeated for 20 periods in partner matching. 8 Every period has the same timing and is payoff-relevant. The experimental tokens are exchanged into Euros at the rate 45 tokens=1 Euro.

2.3.3. Experimental procedure

We conducted the experiment in the spring and fall 2015 in the Cologne Laboratory for Economic Research (CLER), Germany. The participants were students with various majors and were recruited via ORSEE (Greiner 2015). In total, 292 students (59% female) participated in ten experimental sessions split equally between five treatments (see Table 2.1). 9 Each subject participated only in one treatment. Depending on the treatment, experimental sessions lasted between 60 and 90 minutes. On average, subjects earned 14.20 EUR. The experiment was programmed and conducted with the software z-Tree (Fischbacher 2007).

2.4. Beliefs and behavioral responses

Figure 2.1 shows the results from our B ASELINE treatment (with = = 1) . Average investments are 6.48, significantly more than the equilibrium investment of 5 (p=0.013). 10,11 The average magnitude of overbidding (29.7%) is comparable to the results from the meta-analysis by Sheremeta (2013). Another robust finding about

8 The horizon of the game is standard; most previous experiments applied between 10 and 30 periods.

Moreover, in the previous research, both partner and stranger matching have been frequently used (see e.g., Table 1 in Fallucchi et al. 2013 for an overview).

9 We strived for 60 participants in each treatment (i.e., 300 in total). A lower number of subjects in some treatments is due to several no-shows.

10 In all reported tests, we consider a pair of players over 20 periods as one independent observation.

11 Throughout the paper, whenever we report significance levels in tests for differences, we refer to results

from a non-parametric two-sided Fisher-Pitman permutation test (with 200,000 runs). Depending on the

nature of the data, we apply a version for either independent samples or paired replications. Unlike the

Wilcoxon signed-rank test (which is the most common alternative to the Fisher-Pitman test), the Fisher-

Pitman test does not draw any conclusion about the underlying population. Therefore, it does not depend

on assumptions about the population (e.g., subjects being randomly drawn and symmetric around the

median). Moreover, the Wilcoxon test is based on ranks and therefore ignores a substantial part of the

information in the sample data. The Pitman-Fisher permutation test uses the more powerful approach

based on the original sample values without transformation (see Kaiser 2007; Selten et al. 2011). Unless

(22)

2. Beliefs and Behavior in Tullock Contests

contest behavior is overspreading: Subjects not only invest “close” to the equilibrium prediction of 5 but also use the entire strategy space. This is also the case in our data (see Figure 2.10 in appendix A).

Figure 2.1: Average investments and beliefs (B ASELINE treatment).

Result 2.1: In our B ASELINE treatment, contestants’ investments are in line with previous research and significantly higher than predicted in equilibrium.

2.4.1. Accuracy of beliefs

More than three quarters (77.9%) of the reported beliefs were rewarded with a positive bonus, which means that the absolute inaccuracy was not larger than 3 tokens.

More than one third (36.7%) of beliefs exactly matched the competitor’s behavior.

Figure 2.2 (panel A) depicts the distribution of belief inaccuracy. Over time, subjects increase their performance in predicting competitor’s behavior. The average inaccuracy is 3.13 in the initial five periods of the experiment and 1.81 in final five periods. The difference is highly significant (p<0.01).

2.4.2. Myopic beliefs

Several previous experimental studies on contest behavior analyze observed behavior under the assumption of myopic beliefs (e.g., Fallucchi et al. 2013, Lim et al.

2014). Our data allows us to identify to what extent this assumption is justified. We find clear evidence for myopic beliefs under partner matching. Figure 2.2 (panel B) shows that 44.2 percent of beliefs are perfectly myopic. In 68.9 percent of cases the difference between the reported belief and the myopic belief is not larger than 1. Moreover, the

0 2 4 6 8 1 0 In v e s tm e n t / B e lie f

0 5 10 15 20

Period

Investment Belief

(23)

2. Beliefs and Behavior in Tullock Contests

distribution of deviations from the myopic beliefs is symmetric. We can summarize this as:

Result 2.2: Subjects’ beliefs are highly accurate. They predominantly hold myopic beliefs or beliefs very close to myopic.

Figure 2.2: Beliefs in B ASELINE treatment.

2.4.3. Behavioral response to beliefs

In the next step, we study how subjects behave when holding certain beliefs. We compare the theoretic prediction with the behavioral responses to beliefs observed in our experiment. Figure 2.3 depicts the average investments for a given belief about competitor’s behavior and contrasts them with the theoretic prediction. Moreover, we plot the frequencies of reported beliefs.

The difference between the theoretic prediction and observed behavior is remarkable. Subjects substantially deviate from playing best responses. Instead, their behavior can be described with a linear reaction function. Subjects tend to invest as much as they expect from the competitor, which means that they match their investments with their beliefs. Whereas such behavior is justified in the symmetric equilibrium (both players invest 5 tokens), the theoretic best reply is never higher than 5 tokens and decreases for beliefs larger than 5. We find that subjects do not follow this rule. As a consequence, the discrepancy between theoretic prediction and observed behavior becomes larger the more aggressive the competitor is expected to be. The figure additionally shows that investment behavior cannot be described by playing a best reply

0 .1 .2 .3 .4 F ra c ti o n

0 5 10 15 20

Belief inaccuracy

0 .1 .2 .3 .4 F ra c ti o n

-20 -10 0 10 20

Reported belief - myopic belief

A. Belief inaccuracy B. Myopic beliefs

(24)

2. Beliefs and Behavior in Tullock Contests

under Fehr-Schmidt-preferences (1999), either in expected or in realized payoffs (for more details see appendix B).

Figure 2.3: Average responses to beliefs (B ASELINE treatment).

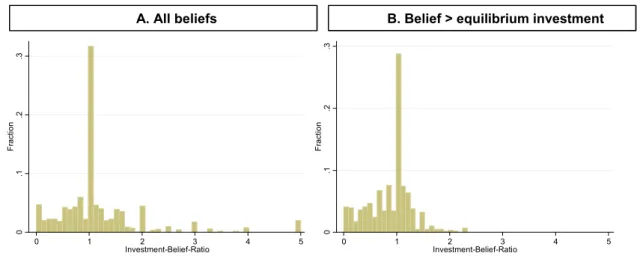
The matching pattern becomes even more apparent from the investment-belief- ratio, presented in Figure 2.4. In order to demonstrate that the results are not driven by the symmetric equilibrium nor are just an arithmetic phenomenon, we present the distribution for all beliefs (Figure 2.4, panel A) and separately the distribution only for beliefs larger than 5 (Figure 2.4, panel B). In both cases, the pattern is very similar; we observe a significant peak at the value of 1, where the investment exactly matches the belief. The significant role of the revealed heuristic is also confirmed in the regression analysis (see Table 2.3 in appendix A). We conclude the following:

Result 2.3: Subjects display a pattern of a linear reaction function (matching behavior with beliefs), which is in stark contrast to theoretic best replies.

The linear reaction function helps explaining why most previous studies on rent- seeking behavior report overbidding. It is likely that such results are driven by the responses to aggressive competitor’s behavior (or beliefs of high competitor’s investment).

0 .1 .2 .3 .4 .5 .6 .7 .8 F re q u e n c y o f th e b e lie f

0 5 1 0 1 5 2 0

In v e s tm e n t

0 5 10 15 20

Belief

Best reply (standard preferen.) Best reply (F-S in realized payoffs) Best reply (F-S in exp. payoffs) Average investment

Investment = Belief Frequency of the belief

(25)

2. Beliefs and Behavior in Tullock Contests

Figure 2.4: Investment-Belief-Ratio (B ASELINE treatment).

Note: Investment-Belief-Ratio for beliefs different from 0 and censored at 5.

We are aware of one previous study that employs elicitation of response functions. Herrmann and Orzen (2008) use the strategy method (Selten 1967) in a similar fashion as Fischbacher et al. (2001) do for public good games. Our result of a linear response function is not quite in line with the evidence reported by Herrmann and Orzen (2008), but it also does not strictly contradict their findings. The authors observe that about 1/3 of subjects in the repeated interactions display an increasing response function, whereas almost ½ of subjects display a hump-shaped response curve (Herrman and Orzen 2008, Table 4). Moreover, even for increasing-types, the reaction curve is far from linear, especially for lower investments by the competitor (Herrmann and Orzen 2008, Figure 4). There are several possible design-related sources of these discrepancies with our results. The behavioral changes induced by the strategy method (instead of the direct responses in our experiment) are certainly one of to the most likely reasons (see Brandts and Charness 2011).

Why do contestants deviate from best replies and match beliefs? Is it possible that the observed matching pattern is induced by the procedure of belief elicitation and we face a problem of an inverse causality, in which the chosen action induces reported beliefs? We can address this concern by comparing our results to previous experiments from Abbink et al. (2010) and Ahn et al. (2011), which are very similar in design but did not elicit beliefs. Both experimental studies include treatments where two players compete repeatedly in partner matching for an exogenously given prize. The main difference to our design is the value of the prize and, therefore, the resulting strategy

A. All beliefs B. Belief > equilibrium investment

0 .1 .2 .3 F ra c ti o n

0 1 2 3 4 5

Investment-Belief-Ratio

0 .1 .2 .3 F ra c ti o n

0 1 2 3 4 5

Investment-Belief-Ratio

(26)

2. Beliefs and Behavior in Tullock Contests

space. In both previous experiments, subjects invested an integer number between 0 and 1,000 to win a prize of 1,000 tokens. All other main elements are the same as in our design. 12 We compute average responses to beliefs under the assumption of myopic beliefs and present the results in a fashion analogous to Figure 2.3 in appendix A (Figures 2.16 & 2.17). Since in the previous experiments the investments were spread over a large strategy space, we aggregate them in 50-token increments in order to obtain reliable numbers of observations for computing average responses. We see that the matching pattern can also be found in the data collected by Abbink et al. (2010), as well as Ahn et al. (2011). This strongly speaks against the concern that the matching pattern is an artifact of our experimental procedure.

Another explanation for the observed matching pattern could stem from the repeated play. Investment matching could be used as a punitive action to penalize aggressive competitors in order to deter their investments in the future. However, such motivation should lead to more matching behavior in early rounds and less towards the end of the experiment. A panel probit regression provides evidence against this explanation (see Table 2.4, Panel A in appendix A). We do not observe less matching in the later rounds of the experiment than at the beginning. Moreover, a recent study by Schier and Waligora (see Chapter 6) reports a similar linear response function in one- shot Tullock contests, which also speaks against the role of dynamic interactions in the matching behavior.

2.4.4. Observed responses to beliefs in the light of QRE-approach

Previous studies used the quantal response equilibrium (QRE) model to explain experimental data on contests. QRE adds noise to the optimal behavior and helps to explain the over-dissipation of rents. We analyze how such an approach fits our results.

As a statistical equilibrium concept, QRE relies on payoff perturbations and assumes that mistakes follow a random process. McKelvey and Palfrey (1995) build their approach on the assumption that better actions (in terms of payoffs) are more likely to be chosen than worse actions. Both Sheremeta (2011) and Lim et al. (2014) apply the QRE-model to their aggregated data and estimate the precision parameter λ. In contrast

12 The only noteworthy difference from our design is the lump-sum endowment in Ahn et al.’s experiment,

which is different from the per-period endowments in Abbink et al.’s as well as in our experiments.

(27)

2. Beliefs and Behavior in Tullock Contests

to these studies, we do not conduct a complex econometric analysis, but rather apply the basic intuition of QRE to our experimental data.

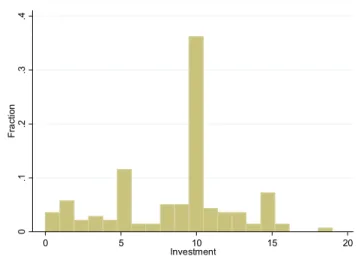
One of the assumptions underlying QRE is that the probability of a mistake is reversely proportional to the foregone payoff. Hence, more costly mistakes are less likely. Figure 2.5 presents the distribution of investments in the B ASELINE if the reported belief equals 10, for which the best response under standard preferences is 4. According to the QRE, smaller deviations from the best response should be more frequent than large (fairly costly) deviation. Even taking into account the distortive impact of prominent numbers (5, 10, 15), one cannot explain with the notion of payoff perturbations why a more costly mistake of investing 10 is three times more likely than a less costly mistake of investing 5. This clearly contradicts an explanation of the matching pattern drawn from QRE. We report similar regularities for other beliefs (see Figure 2.15 in appendix A).

Figure 2.5: Distribution of investments if the reported belief equals 10 (n=138 from 36 subjects). B ASELINE treatment.

2.5. The role of limited computational abilities

Tullock contests between two players with linear probabilities are characterized by a well-defined best-response function (see eq. 2.3). Its algebraic form and its shape are, however, neither trivial nor intuitive. In our experimental treatment C1, we test whether the matching pattern is induced by subjects’ difficulties in computing

0 .1 .2 .3 .4 F ra c ti o n

0 5 10 15 20

Investment

(28)

2. Beliefs and Behavior in Tullock Contests

probabilities and expected payoffs. 13 The only difference between C1 and B ASELINE is the availability of a computational tool. At the decision stage, the computer mask includes a what-if calculator (see Figure 2.21 in appendix C). Subjects can enter the expected investment of the competitor, and the calculator displays expected winning probabilities and expected payoffs for every possible investment of the subject. Such a tool allows easily identification of the investment maximizing subject’s expected payoff as well as the one maximizing the expected winning probability, given a certain belief on competitor’s behavior. Moreover, subjects can compare their expected payoffs and winning probabilities with the expectations for the competitor in various scenarios.

Subjects are allowed to use the calculator as many times as they want within the given decision time limit of 240 seconds in first ten rounds and 120 seconds in consecutive ten rounds.

Our experimental data show that the behavior in treatment C1 is – at the aggregate level – very similar to that in B ASELINE . Neither investments (mean: 6.855) nor beliefs (mean: 7.268) are significantly different from the results reported in the previous section (p-values 0.631 and 0.368, respectively). Additionally, Figures 2.10 to 2.13 in appendix A illustrate that the behavior and reported beliefs in C1 are in several other dimensions very similar to those in B ASELINE .

In the next step, we test whether subjects in treatment C1 are more likely to play best responses than in the B ASELINE treatment. In B ASELINE , in 15.43 percent of observations, subjects play exactly best responses; in C1 this proportion amounts to 15.00 percent. The difference is not significant (p>0.9). The same conclusion provides the panel data logit regression (see Table 2.4, Panel B in appendix A).

One obvious reason for no difference between treatments would be that subjects do not use the calculator. Therefore, we examine whether participants indeed use the tool we provided. Fifty-three out of 56 subjects (94.6 percent) use the calculator in at least one period. Figure 2.20 in appendix A depicts that most subjects make use of the tool at the beginning of the experiment. In periods 1-3, the average number of entries is 1.60, but it decreases rapidly, and by period 10 it drops to 0.18. The use of the calculator in the first periods is reflected in much longer decision times. Whereas in the B ASELINE

13 Note that we call this treatment C1 due to notation we use in asymmetric treatments reported in Section

2.6 (C stands for “calculator”).

(29)

2. Beliefs and Behavior in Tullock Contests

subjects in periods 1-3 make their decision on average within 12.18 sec., in C1 they need 52.34 sec. (see Figure 2.19 in appendix A). The difference is highly significant (p<0.001).

Figure 2.6: Average responses to beliefs (treatment C1).

Figure 2.6 demonstrates that the matching pattern in C1 is even slightly more pronounced than in the B ASELINE . The regression analysis also confirms that the matching pattern is not induced by the limited computational abilities (Table 2.4, Panel A in appendix A). The figure additionally shows that, as in B ASELINE , investment behavior cannot be described by best-reply behavior under Fehr-Schmidt-preferences (1999), either in expected or in realized payoffs (for more details see appendix B).

Result 2.4: Subjects use the what-if calculator but still do not play best responses, in particular for high beliefs. Instead they tend to match their own behavior with beliefs.

Thus, limited computational abilities do not seem to be the reason for the matching pattern in experimental contests.

2.6. Beliefs and Behavior in Asymmetric Contests

In order to disentangle whether the observed investment behavior is motivated by matching the opponent’s investment or matching the winning probability, we

0 .1 .2 .3 .4 .5 .6 .7 .8 F re q u e n c y o f th e b e lie f

0 5 1 0 1 5 2 0 In v e s tm e n t

0 5 10 15 20

Belief

Best reply (standard preferen.) Best reply (F-S in realized payoffs) Best reply (F-S in exp. payoffs) Average investment

Investment = Belief Frequency of the belief

(30)

2. Beliefs and Behavior in Tullock Contests

introduce cost asymmetry between contestants. 14 In three new treatments we manipulate the degree of asymmetry from relatively low to high. This provides richer insights into contest behavior and enhances our understanding of it.

In asymmetric treatments, we vary the number of tickets subjects can purchase per token ( ≥ 1) . The symmetric treatment C1, reported in the previous section, constitutes our benchmark. Consequently, the decision is framed across treatments as the number of tokens that a subject wants to spend on lottery tickets. Table 2.2 summarizes the ticket costs in the treatments. The treatment name corresponds to the ratio tickets per token ( ;<=>?<@A B;CDEF / G HG>?<@A B;CDEF ) . Moreover, using eq. (2.4) we can compute the theoretic benchmarks of Nash equilibrium. 15

Table 2.2: Asymmetric treatments. Overview.

Treatment C1 C1.5 C2 C4

# tickets per token spent

low-cost type 1 3 2 4

high-cost type 1 2 1 1

Nash equilibrium (5, 5) (5, 5) (4, 4) (3, 3)

2.6.1. Main behavioral regularities

In all asymmetric treatments, both low-cost and high-cost players invest significantly more than in the Nash equilibrium (all p<0.05). The detailed statistics and test results are presented in Table 2.5 in appendix A.

In order to recognize general behavioral patterns, we analyze in the first step the distributions of winning probabilities subjects believed they would achieve when making their decisions (see Figure 2.7). Expected winning probability results from own investments and reported beliefs. Inter-treatment and -type comparison allows us to identify three major behavioral regularities.

First, we find that under low cost asymmetry (treatment C1.5) both low-cost and high-cost types tend to strive for equal or similar winning probability as their competitor.

14 With respect to asymmetric contests, our study is related to previous work by Anderson and Stafford (2003), Fonseca (2009), Anderson and Freeborn (2010) and Kimbrough et al. (2014).

15 Note that we have to take the restriction on the strategy space into account; Subjects are allowed to

invest integer numbers of tokens.

(31)

2. Beliefs and Behavior in Tullock Contests

The exact matching is not as pronounced as in the symmetric treatment (C1); this is probably partially attributable to exact matching in probabilities not always being possible under the asymmetric cost due to restrictions on the strategy space.

Nevertheless, a great mass of distribution lies around 0.5. This is no longer the case under a larger cost asymmetry.

Figure 2.7: Expected winning probability. Empirical distributions by treatment and cost type.

0 .0 5 .1 .1 5 .2 .2 5 .3 F ra c ti o n

0 .2 .4 .6 .8 1

Expected winning probability

B ASELINE

0 .0 5 .1 .1 5 .2 .2 5 .3 F ra c ti o n

0 .2 .4 .6 .8 1

Expected winning probability

C1

0 .0 5 .1 .1 5 .2 .2 5 .3 F ra c ti o n

0 .2 .4 .6 .8 1

Expected winning probability

C1.5: Low cost

0 .0 5 .1 .1 5 .2 .2 5 .3 F ra c ti o n

0 .2 .4 .6 .8 1

Expected winning probability

C1.5: High cost

0 .0 5 .1 .1 5 .2 .2 5 .3 F ra c ti o n

0 .2 .4 .6 .8 1

Expected winning probability

C2: Low cost

0 .0 5 .1 .1 5 .2 .2 5 .3 F ra c ti o n

0 .2 .4 .6 .8 1

Expected winning probability

C2: High cost

0 .0 5 .1 .1 5 .2 .2 5 .3 F ra c ti o n

0 .2 .4 .6 .8 1

Expected winning probability

0 .0 5 .1 .1 5 .2 .2 5 .3 F ra c ti o n

0 .2 .4 .6 .8 1

Expected winning probability

C4: Low cost C4: High cost

(32)

2. Beliefs and Behavior in Tullock Contests

Second, low-cost types strongly match in investments, which – combined with a cost advantage – allows them to achieve high winning probabilities of 60%, 67%, and 80% for treatments C1.5, C2, and C4, respectively.

Third, high-cost types are more likely to give in when being highly disadvantaged. While the fraction of contestants investing zero is negligible under cost symmetry (in B ASELINE and C1), it increases with an increasing cost asymmetry between contestants. Under high cost asymmetry, about one third of high-cost contestants decide to “surrender” by not buying even a single lottery ticket (see Figure 2.7 right panels).

2.6.2. Matching pattern under cost asymmetry

To answer the question posed at the beginning of this Section, namely whether the investment behavior is driven by a desire for equal investments or equal winning probabilities, we compare how often subjects follow these behavioral rules. Since exact matching under cost asymmetry was not always possible, we slightly weaken the definition of matching and allow for a deviation from the described rules by at most one token. Figure 2.8 depicts the likelihood of following the matching rule across treatments.

Figure 2.8: Likelihood to match in investments (panel A) and in winning probabilities (panel B).

The stronger the cost asymmetry, the lower the likelihood of low-cost players matching both in investments and in winning probabilities. However, the decreasing trend for the likelihood of matching winning probabilities is much stronger. This is confirmed by non-parametric analyses. While the Jonckheere-Terpstra test (JTT) for

A. Matching in investments B. Matching in winning probabilities

.429 .429

.269

.195 .207

.135 .183

.037

0 .1 .2 .3 .4 L ik e lih o o d t o m a tc h

C1 C1.5 C2 C4

Treatment

Low cost type High cost type .429 .429

.362

.274 .310

.185 .312

.225

0 .1 .2 .3 .4 L ik e lih o o d t o m a tc h

C1 C1.5 C2 C4

Treatment

Low cost type High cost type

(33)

2. Beliefs and Behavior in Tullock Contests

ordered alternatives indicates an only weakly significant negative trend for likelihoods to match investments (p=0.052), it detects highly significant negative trend for the likelihood to match in probabilities (p<0.001, JTT). Moreover, the same conclusion provides a parametric analysis reported in Table 2.6 panel A in appendix A, where a much stronger and more significant effect of cost asymmetry is found for the matching in winning probabilities.

For high cost players, both matching rules become less and less frequent under increasing cost asymmetry; JTT indicates in both cases a highly significant negative trend (p<0.001). Again, this conclusion is supported by the parametric regression analysis (see Table 2.6 panel B in appendix A). As the matching rules become less common under cost asymmetry, it is instructive to compare average behavior to the considered behavioral benchmarks. We normalize each decision with respect to predictions of matching in investments or matching in winning probabilities. A value of 100% means that the matching behavior is exactly followed, while values over (under) 100% indicate that a subject invests more (less) than the matching rule requires. The average values of normalized behavior are presented in Figure 2.9. 16

Figure 2.9: Average behavior normalized with respect to matching rules.

In the symmetric treatment C1, subjects invest on average only slightly more than required for investment matching. In asymmetric treatments, however, low-cost

16 Note that if the reported belief is 0, the matching rule also predicts 0, which disables the normalization of the behavior. In these cases, we replace the benchmark of 0 with the benchmark of 1 and compare

A. Matching in investments B. Matching in winning probabilities

117.5% 117.5%

137.7%

109.0%

211.6%

107.8%

218.0%

122.9%

0%

50%

100%

150%

200%

C1 C1.5 C2 C4

Treatment

Low cost type High cost type

117.5% 117.5%

196.9%

73.7%

336.6%

53.9%

623.5%

61.6%

0%

200%

400%

600%

C1 C1.5 C2 C4

Treatment

Low cost type High cost type

100%

(34)

2. Beliefs and Behavior in Tullock Contests

players invest on average more than matching in investments would require; we observe a significant upward trend (p<0.001, JTT). Combined with the cost advantage effect, this gives them a rapidly increasing dominance in winning probabilities (p<0.001, JTT).

High-cost players, in contrast, continue matching in investments even when the asymmetry increases, such that we find no significant trend (p=0.413, JTT). Under the increasing disadvantageous cost asymmetry, this leads to a significant downward trend in probability matching (p<0.001, JTT).

We close our analysis of behavior in asymmetric contests with patterns of average responses to beliefs (see Figure 2.18 in appendix A). Here, again it becomes apparent that high-cost players tend to match in probabilities if the cost asymmetry is low (C1.5) and the expected opponent’s investment is relatively small. Otherwise, average responses follow the matching investment rule.

We summarize our evidence on behavior in asymmetric contests in the following conclusion:

Result 2.5: Subjects strive for equal winning probabilities only if the degree of asymmetry is low. Otherwise, low-cost players exploit their position to achieve high winning probabilities and often even deter the high-cost competitor from participating in the contest.

2.7. Conclusion

In our study, we extend the standard experimental setting of rent-seeking contests from previous research to include incentivized belief elicitation, which allows us to gain new insights into contest behavior. We show that our experimental design is not very intrusive and allows us to report results consistent with previous findings. However, it enriches our understanding of behavior in experimental contests in two significant dimensions. First, we find evidence for myopic (Cournot) beliefs; in repeated interactions under partner matching, subjects usually expect the competitor to behave exactly or similarly as in the last previous period.

Moreover, the belief elicitation allows us to examine the empirical response

function and to compare the behavioral responses with theoretic predictions. In stark

contrast to the game-theoretic best-reply function, which is parabolic with its maximum

Abbildung

Figure 2.4: Investment-Belief-Ratio (B ASELINE  treatment).
Figure 2.5: Distribution of investments if the reported belief equals 10 (n=138 from 36  subjects)
Figure 2.7: Expected winning probability. Empirical distributions by treatment and cost type
Figure 2.10: Distribution of investments over treatments.
+7

Referenzen

ÄHNLICHE DOKUMENTE

Security sensitive interfaces are protected by stan- dard Android permissions such as PHONE CALLS, INTERNET, SEND SMS meaning that applications have to possess these permissions to

For their part, the European Union and other Western actors cannot accept Russia’s military intervention, nor the violation of international law and the Ukrainian con-

The US plus the European four should present a united front, making the Friends of Syria Group an important forum in which to push the de-escalation initiative with regional allies

available on whether the DPRK has nuclear reentry vehicles for ballistic missiles. As to the outlook for North Korea’s nuclear capability, it will depend on the

The same holds for hypothesis 12, according to which the propaganda effect of reports about violence further a text un- derstanding in favor of the victim side, if the

In the Hawk Treatment the probability of a manager winning the additional 1000 points was equal to the total number of points invested by his or her own group, divided by the sum

The key question in this paper is whether management incentives influence the impact of a manager’s coordination efforts. To derive predictions about this impact the analysis starts

The next step is to show that the situation in which both groups adopt the same mixed incentive scheme M with weights a 1 =a 2 =a&gt;0 is not an equilibrium: each of the two groups